Modeling and Analysis
Workflow using sparse vintage data for building a first geological and reservoir model for CO2 geological storage in deep saline aquifer. A case study in the St. Lawrence Platform, Canada Maxime Claprood, Erwan Gloaguen, Bernard Giroux, Elena Konstantinovskaya, Michel Malo, Centre Eau, Terre & Environnement, Institut National de la Recherche Scientifique, 490, rue de la Couronne, Québec, QC, G1K 9A9, Canada. Mathieu J. Duchesne, Geological Survey of Canada, 490, rue de la Couronne, Québec, QC, G1K 9A9, Canada. Abstract: Among all geological CO2 storage possibilities, deep saline aquifers are of great interest due to their worldwide repartition and their important storage volume. We present a workflow using available vintage data with poor 2D seismic coverage for building a first geological and reservoir model for CO2 geological storage in the deep saline aquifers of the St. Lawrence Platform in the Bécancour area (Québec, Canada). In order to optimize the sparse available geoinformation using a geostatistical method, we krige the tops of the geological formations recorded at 11 wells using surfaces modeled from seismic horizons picked on 99.4 line-km of 2D seismic reflection data. Modeled geological horizons show a good compromise between the geometric structure expressed by the variograms and the interpreted variations evaluated from seismic horizons. Using available well logs, distribution of porosity and permeability are computed for generating multiple realizations of the petrophysical properties of the targeted aquifer by sequential Gaussian simulations. The scarcity of available petrophysical data in the targeted aquifer generates high variability between the different realizations. Due to this uncertainty, the population of the 3D geological model with petrophysical properties that are required for further geostatistical simulations of CO2 injection do not allow to achieve reliable results. The methodology presented in this paper shows the possibilities and limits of using vintage data, and provides evidence that geophysical data acquired in a 3D fashion are important to fully characterize a reservoir for CO2 geological storage. © 2012 Society of Chemical Industry and John Wiley & Sons, Ltd Keywords: CO2 geological storage, deep saline aquifers, geological model, geostatistical simulations, kriging with external drift, St. Lawrence Platform
Correspondence to: Maxime Claprood, Centre Eau, Terre & Environnement, Institut National de la Recherche Scientifique, 490, rue de la Couronne, Québec, QC, G1K 9A9, Canada. Email:
[email protected] Received February 17, 2012; revised April 20, 2012; accepted April 23, 2012 Published online at Wiley Online Library (wileyonlinelibrary.com). DOI: 10.1002/ghg.1292
260
© 2012 Society of Chemical Industry and John Wiley & Sons, Ltd | Greenhouse Gas Sci Technol. 2:260–278 (2012); DOI: 10.1002/ghg
Modeling and Analysis: Using sparse vintage data for CO2 geological storage in deep saline aquifer
Introduction eep saline geological formations are classified by the Intergovernmental Panel on Climate Change (IPCC, 2005)l as one of the four principal geological storage options of CO2. While CO2 storage is more likely to be economically viable in Enhanced Oil Recovery (EOR), Enhanced Gas Recovery (EGR), or Enhanced Coal Bed Methane Recovery (ECBMR) schemes, storage of CO2 in deep saline aquifers is considered to have the largest potential capacity because of the large volume of pore space in sedimentary basins.2 Worldwide projects of CO2 injection in deep saline aquifer were often initiated in areas where seismic data were previously acquired for imaging oil or gas pools beneath or above deep saline aquifer formations (e.g. the Sleipner site, North Sea;3,4 the Alberta Basin, Canada;5 and the Sacroc Unit in Texas, USA6). The European Union (EU) has funded and is presently funding several projects to investigate the possibility of CO2 storage in deep saline aquifers. In particular, the characterization of the Atzbach-Schwanenstadt gas field in Upper Austria for CO2 storage is part of the EU-supported CASTOR project,7 using 3D seismic covering part of the field, 2D vintage seismic lines, formation tops from 50 wells, and petrophysical interpretation of wireline logs in 8 wells. More recently, a 3D model of the deep saline aquifer located near the South-West border of the Paris Basin in the Orléans region is interpreted from background geological information, 2D seismic lines and well logs.8 One of the most documented EU-supported projects is the characterization of deep saline aquifers for CO2 storage at Ketzin, Germany,9 using a 3D baseline seismic survey with 12 km2 of subsurface coverage by a geostatistical approach to interpret a 3D geological model and its main structural elements.10 In all these case studies, good quality seismic data (preferably 3D seismic) is the most valuable asset for characterizing the reservoir, thanks to its ability to image the stratigraphy and the relationships between certain seismic parameters and certain petrophysical properties. The use of different types of information contained in seismic data (reflection amplitude, frequency, continuity, external and internal reflection configurations) is important to identify changes in lithology, physical properties, and the presence of structural features that makes a CCS project reliable.11 The use of coherence measures (cross correlation,
D
M Claprood et al.
semblance and eigen-decomposition of data covariance matrix) on 3D seismic data is used to image geological discontinuities such as faults and stratigraphic features.12 High quality prestack seismic data are essential to build an accurate velocity model which allow to convert seismic data acquired in two-way arrival time (TWT) to depth. The accuracy of the velocity model is crucial for further modeling activities.13 The use of geostatistics is essential to optimize the available information, and to evaluate the variability and uncertainty in the modeling of any kind of reservoirs.14 These heterogeneities and uncertainties drive the risk associated with the investment in a given geological project. For example, conditional simulations using multiple estimates of the velocity field derived by kriging with an external drift were used to compute a reliable averaged velocity field of the Troll Field (North Sea), using 2D and 3D seismic along with 26 wells.15 Collocated cokriging was used for transforming impedances into reservoir parameters through petrophysical relations,16 using wells with appropriate logs and a migrated 3D seismic block to constrain the inversion. Despite the reliability and good results obtained by geostatistical methods, it is important to be careful when the assumptions underlying the use of geostatistics are overlooked.17 Neglecting the geology and geophysics reduces geostatistics to a purely statistical process that may give false confidence in spurious results. Deep saline aquifers have been identified in the lower Paleozoic sedimentary succession of the St. Lawrence Platform, located along the St. Lawrence River in Canada, and are being studied for their potential for geological storage of CO2. The project described in this paper is part of work conducted by the CO2 Research Chair granted by the Ministère du Développement durable, de l’Environnement et des Parcs du Québec to explore the main options for the geological storage of CO2 in the province of Québec (Canada) and test a few sites for their potential for CO2 injection. Using criteria taken from the literature (e.g. onshore location, low seismicity, intermediate depth of the aquifer, and excellent reservoir-caprock pair),18,19 an initial study of the major sedimentary basins concluded that the St. Lawrence Lowlands sub-basin represents the most prospective basin for CO2 storage in the province of Québec (Canada).20 The site of Bécancour located along the St. Lawrence River (Figure 1) was selected for further analysis
© 2012 Society of Chemical Industry and John Wiley & Sons, Ltd | Greenhouse Gas Sci Technol. 2:260–278 (2012); DOI: 10.1002/ghg
261
M Claprood et al.
Modeling and Analysis: Using sparse vintage data for CO2 geological storage in deep saline aquifer
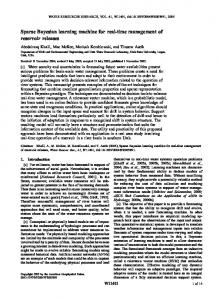
Figure 1. Localization of Bécancour (Québec, Canada), on the south shore of the St. Lawrence River. Distribution of sedimentary basins and major sources of CO2 in the Province of Québec. ASB: Anticosti sub-basin; LSB: St. Lawrence Lowlands sub-basin. Data source for CO2 emissions: Environment Canada (http://www.ec.gc.ca/ges-ghg/default.asp?lang=En&n= 040E378D-1). Modified from Malo and Bédard20. Bottom right inset is the digital elevation map of the Bécancour area. White lines are location of 2D seismic lines. Yellow dots are bottom-hole location of 11 wells where sonic logs are available. Dashed white rectangle is approximate limits of 3D geological model (13.6 km × 10.5 km). Dashed orange rectangle is approximate limits of the flow grid (5.3 km × 2.0 km).
because of the availability of geophysical data. The geological and structural settings of the area have been analyzed to complete the initial appraisal stage concerning the potential of the Bécancour area for CO2 injection.21 In this paper, we present the next step in evaluating the reliability of injection of CO2 in a reservoir: i.e. the construction of a 3D model for the reservoir and caprock units, and evaluating the petrophysical properties of the most favorable units for the reservoir-caprock system using available data.22 At the actual stage of the project and with the data available in the Bécancour area, we want to answer the simple question: “Will it be possible to inject CO2 in the targeted geological formation: Yes or No?”. We are presently not capable to determine a precise
262
volume of CO2 which could be injected, or to map its propagation in the aquifers. However, we are interested to assess the possibility to inject some CO2 in the targeted saline aquifer and justify further investments in terms of additional data and drilling. Knowledge of such projects is often limited, and private or public fundings can not always support the acquisition of data needed for detailed reservoir characterization. Hence, apart from rare showcases, there is a need to evaluate the reliability of CO2 injection projects using existing but sometimes poor quality data before investing considerable amount of money in the acquisition of new data. The objective of this paper is to present the different steps of a workflow that optimizes available vintage and sparse geophysical data for building a geological model
© 2012 Society of Chemical Industry and John Wiley & Sons, Ltd | Greenhouse Gas Sci Technol. 2:260–278 (2012); DOI: 10.1002/ghg
Modeling and Analysis: Using sparse vintage data for CO2 geological storage in deep saline aquifer
and evaluating whether or not the injection of CO2 is possible in the Bécancour area. The 3D geological model is first built by using a geostatistical approach (i.e. kriging with an external drift) through the integration of 2D seismic data and well logs. The second step consists in evaluating the distribution of the petrophysical properties (porosity and permeability) within the sedimentary units. In the final step of the workflow, we present how we could integrate the 3D geological model and petrophysical properties to complete simulations of CO2 injection in the targeted saline aquifer, showing the possibilities and limits of using vintage geophysical data for reservoir characterization.
Geological setting The sedimentary succession of the St. Lawrence Platform is located between the Precambrian
M Claprood et al.
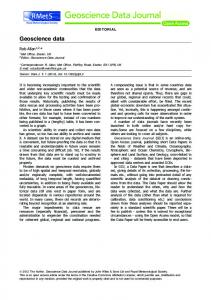
Grenville basement in the north-west and the Appalachian thrusts domain in the south-east (Figure 1). Lithostratigraphic correlations and well log interpretation were performed to help determine the geometry of the stratigraphic units of the St. Lawrence Platform and interpret their location on the 2D seismic lines. A simplified stratigraphic column of the sedimentary succession of the St. Lawrence Platform is presented in Figure 2. The Yamaska fault is a major south-east dipping syn-sedimentary normal fault in the study area, with a 800 - 850 m vertical offset,23,24 affecting the Grenville basement and most geological units of the sedimentary succession.21,25,26,27 A south-east verging minor reverse fault is also identified on some seismic profiles.21,28,29 The Yamaska fault separates the Bécancour area into two blocks, a shallow block in the northwest of the fault, and a deep block in the southeast of the fault. Regional scale study of the
St. Lawrence Lowlands stratigraphy Age
Modeled horizon
Group
Queenston
ORDOVICIAN
UPPER
Shales, siltstones and sandstones
Lorraine
Upper Utica
Calcareous shale
Lower Utica
Shales and limestones
Trenton - Black River Upper Chazy Lower Chazy
Limestones Limestones, dolostones and sandstones
MIDDLE
LOWER
Beekmantown
Beauharnois Fm Theresa Fm
Dolostones Dolomitic sandstones
Cairnside Fm
Quartz sandstone
Covey Hill Fm
Sandstones and conglomerates
Potsdam CAMBRIAN
PRECAMBRIAN
Grenville basement
Figure 2. Simplified stratigraphy of the St. Lawrence Platform. Thick red lines are the 9 seismic horizons modeled, representing major changes in the stratigraphic sequence. The saline aquifers in the Bécancour area are located in the sandstones of the Potsdam Group and Theresa Formation and the limestone of the Trenton Group.
© 2012 Society of Chemical Industry and John Wiley & Sons, Ltd | Greenhouse Gas Sci Technol. 2:260–278 (2012); DOI: 10.1002/ghg
263
M Claprood et al.
Modeling and Analysis: Using sparse vintage data for CO2 geological storage in deep saline aquifer
present-day stress orientation and magnitude determined that high-angle NE-SW regional faults and fractures that affect the Paleozoic sedimentary succession and the Grenville basement are oblique to the maximum horizontal stress orientation (SHmax), and could be reactivated if the fluid pressure exceed a critical threshold.24 The first step in reservoir characterization is to provide the geological model of the selected area. In the Bécancour area, nine horizons are identified on the seismic profiles, corresponding to the formation tops defined from well logs (thick red lines on Figure 2). The Potsdam Group, unconformably covering the Precambrian Grenville basement, comprises the Covey Hill (sandstones and conglomerates) and the Cairnside (quartz sandstone) formations. The Beekmantown Group includes the Theresa (dolomitic sandstones) and the Beauharnois (dolostones) formations. The lower Chazy unit is composed of limestones, dolostones, and sandstones. The Trenton, Black River, and upper Chazy groups, indistinguishable on the seismic profiles because of their similar physical properties, are made of limestones. The Trenton Group is overlain by the Utica Shale and several hundred meters of interbedded shales, siltstones and sandstones of the Lorraine Group. The lower Utica Shale comprises limestone beds and is more calcareous than the upper Utica Shale. The average depth and thickness between the formation tops are computed from the 3D geological model (Section 4.6) for the two blocks located north and south of the Yamaska fault in the Bécancour area (Table 1). The Covey Hill Formation offers the best conditions for CO2 storage. Petrophysical analyses confirmed a high netpay thickness (188 m), relatively good porosity (6%) and matrix permeability (0.25 mD)
(see Section on Evaluating petrophysical properties).29,30 Only the Covey Hill aquifer is located at depths where injected CO2 is predicted to behave as supercritical fluid (below 1026 m) according to observed pore pressures, temperatures, and calculated CO2 density.30 The Utica Shale and the Lorraine Group are characterized by low permeability (