Journal of Experimental Psychology: Learning, Memory, and Cognition 2011, Vol. 37, No. 2, 308 –324
© 2011 American Psychological Association 0278-7393/11/$12.00 DOI: 10.1037/a0022216
Working Memory Capacity and Go/No-Go Task Performance: Selective Effects of Updating, Maintenance, and Inhibition Thomas S. Redick
Alejandra Calvo
Georgia Institute of Technology
York University
Catherine E. Gay
Randall W. Engle
Arizona State University
Georgia Institute of Technology
The ability to temporarily maintain information in order to successfully perform a task is important in many daily activities. However, the ability to quickly and accurately update existing mental representations in distracting situations is also imperative in many of these same circumstances. In the current studies, individuals varying in working memory capacity (WMC) performed different varieties of go/no-go tasks that have been hypothesized to measure inhibitory ability. The results indicated that low-WMC individuals relative to high-WMC individuals showed worse performance specifically in certain conditions of the conditional go/no-go task. Further analyses showed that increasing the temporal lag/number of intervening items between the previous target and the current lure had a deleterious effect on the performance of the low-WMC group only. The results indicate a relationship between WMC and the ability to selectively update, maintain, and retrieve information, especially in interference-rich conditions. Keywords: working memory, individual differences, updating, maintenance, inhibition
The ability to temporarily maintain information across time and modify this information as necessary allows us to keep up with our ever-changing environments. Baddeley and Hitch (1974) proposed that individuals flexibly use the working memory system to temporarily hold information over short intervals while performing other tasks. For example, perhaps you have gone to a group dinner, and afterwards you have to calculate your portion of the bill. Calculating the amount you owe requires maintaining the products of various operations and then updating your total by addition of the tax and tip. Ideally, you would be able to successfully remember relevant information only until the appropriate goal were fulfilled (e.g., the numbers of individual items you ordered are only important until you have calculated your total sum), so the representation must be both durable to withstand the effects of distraction (e.g., playful ribbing from companions) and malleable to respond to changes in the environment (e.g., someone tells you that the waiter already added gratuity to the bill). Variation in the functioning of the working memory system is important for successful performance in this situation and others like it.
Individual Differences in Working Memory Capacity Most working memory theories are based on the model explicated by Baddeley and Hitch (1974). This model was developed as a more dynamic system to represent the true nature of human cognition, in contrast to the conception of short-term memory as primarily a temporary store of information. According to this model, the working memory system is composed of domainspecific buffers controlled by a domain-general central executive. The numerous roles of the central executive include coordinating, scheduling, and switching rapidly between tasks (Baddeley, 1996). In addition, Baddeley (2000) added the episodic buffer to the model as a capacity-limited component where representations from different modalities can be integrated. Most of the working memory research in the experimental tradition has focused on specifying the properties of the different structures proposed by Baddeley (see Unsworth & Engle, 2007a, for a review of typical working memory effects). However, there is also a long-standing psychometric tradition within the working memory literature. Daneman and Carpenter (1980) developed the reading span task as a way of measuring an individual’s working memory capacity (WMC). Daneman and Carpenter creatively adapted a serial-order word recall task to tax the working memory system. In the reading span test, participants read individual sentences and were instructed to remember the sentence-final words for later recall. After a series of sentences, participants were prompted to recall those words in serial order. The logic of the reading span as a measure of WMC is that reading the sentences would prevent rehearsal of the to-be-remembered within short-term memory and thus require the individual to use their working memory to recall the information. Therefore, an
This article was published Online First February 7, 2011. Thomas S. Redick and Randall W. Engle, School of Psychology, Georgia Institute of Technology; Alejandra Calvo, Department of Psychology, York University; and Catherine E. Gay, Arizona State University. We thank Nash Unsworth and the members of the Attention and Working Memory Lab and CoNTRoL at Georgia Institute of Technology for their helpful comments on the data presented in the article. Correspondence concerning this article should be addressed to Thomas S. Redick, School of Psychology, Georgia Institute of Technology, 654 Cherry Street, Atlanta, GA 30332. E-mail:
[email protected] 308
WORKING MEMORY CAPACITY AND GO/NO-GO
individual that could maximally remember two sentence-final words would have a smaller WMC than an individual that was able to remember five sentence-final words. Although there are a plethora of WMC tests in use throughout virtually all areas of psychology (Conway et al., 2005), relatively little is understood about the causes of individual differences in WMC as measured by performance on these complex span tests. In addition, Engle and colleagues (for review, see Kane, Conway, Hambrick, & Engle, 2007) have demonstrated that individual differences in performance on WMC tests are predictive not only of high-level ability test scores but also of performance on relatively low-level selective attention tasks. For example, multiple studies have shown that, relative to high-WMC individuals, individuals with lower WMC test scores show impaired performance on the interference conditions of Stroop (Kane & Engle, 2003; Long & Prat, 2002), antisaccade (Kane, Bleckley, Conway, & Engle, 2001; Unsworth, Schrock, & Engle, 2004), and flankers (Heitz & Engle, 2007; Redick & Engle, 2006) tasks. The purpose of the current study was to compare competing theories of individual differences of WMC in their ability to account for selective relationships with interference and noninterference conditions within different versions of an inhibitory task.
309
Studies with the antisaccade task helped to validate the lowlevel predictions of the executive attention account (Kane et al., 2001; Unsworth et al., 2004). For example, Unsworth et al. (2004) presented high- and low-WMC individuals with a flashing box on either the left or the right side of the computer screen. In the prosaccade condition, participants were instructed to look toward the stimulus, but in the antisaccade condition, participants were instructed to look in the opposite direction instead. Unsworth et al. (2004) found that the WMC groups did not differ in performance in the prosaccade condition, but in the antisaccade condition the low-WMC individuals made more reflexive errors toward the stimulus and were slower even when they correctly looked away from the stimulus. The results were interpreted as indicative of low-WMC individuals being less likely to maintain the task goal (viz., look away from the flash); even when they did remember it, they took longer to select the weaker but contextually appropriate response of looking away from the stimulus. No WMC differences were observed on prosaccade trials because even if the task goal was not maintained, the low-WMC individuals could still respond quickly and accurately by executing the prepotent response. However, because the prepotent response is incompatible with the goal-desired response on antisaccade trials, failure to maintain the goal led to more errors for the low-WMC individuals.
Working Memory Capacity Theories A number of theories have been developed in an attempt to explain both individual and developmental differences in scores on WMC tests such as the reading span test. Some examples include the time-based resource-sharing theory (Barrouillet, Bernardin, & Camos, 2004) and the time-based forgetting theory (Towse, Hitch, & Hutton, 2000). Although these views have had varying levels of success in accounting for variation in performance on WMC tests, the theories do not extrapolate to account for the relationships observed between WMC tests and low-level cognition. However, several other views have put forth an explanation for individual differences in WMC and the relationships previously mentioned. These theories are discussed briefly below.
Executive Attention Theory One prominent WMC theory is the executive attention account (Engle & Kane, 2004; Kane et al., 2007). According to this view, the functioning of the central executive represents the ability to control attention in a goal-directed manner. Specifically, this ability is important in situations where behavior can be guided by contextually inappropriate prepotent actions, especially if the relevant goal information is not actively maintained. Thus, individual differences in WMC are important not only in memory tasks but also in the aforementioned selective attention tasks. Notably, these differences in WMC will be manifested in high-interference situations where controlled attention is necessary for successful task performance. For example, individual differences arise on the reading span task because high scorers can selectively attend to and maintain the to-be-remembered items within a trial while processing the interleaved (and irrelevant) task of reading sentences. This ability to selectively allocate attention is something that low-WMC individuals have difficulty doing, and thus on tasks such as the reading span test, they are unable to recall as many items in the correct serial order.
Maintenance/Retrieval Theory More recently, Unsworth and Engle (2007a, 2007b) have proposed a revised view of WMC based on the primary memory– secondary memory distinction emphasized by Craik (1971) and Waugh and Norman (1965). Individual differences in WMC reflect not only the contribution of actively maintaining a select number of items but also the ability to quickly retrieve information from secondary memory once those representations have been displaced from primary memory. The support for the maintenance/retrieval account comes from several sources, but one illustration is that individual differences in WMC were found to be related to performance on memory tests that have not been considered as typical working memory tasks, including immediate, delayed, and continuous free recall (Unsworth, 2007; Unsworth & Engle, 2007b). Accordingly, on WMC tests such as the reading span test, an individual’s score is jointly determined by his or her ability to unload very recent item(s) from primary memory and use retrieval cues to delimit the secondary memory search process to just the relevant to-be-remembered items for that trial. Participants are unable to hold all to-be-remembered items for a given trial within primary memory because the interleaved processing task displaces them into secondary memory. The maintenance/retrieval account of the antisaccade results discussed previously is virtually indistinguishable from the executive attention view. Individuals with low WMC are less likely to successfully maintain within primary memory the task goal of looking away from the flashing stimulus on antisaccade trials and thus are more likely to retrieve from secondary memory the inappropriate stimulus–response mapping and look toward the stimulus instead of away from it. However, a reinterpretation of the results from a different experiment in Unsworth et al. (2004) clarifies an important distinction between the executive attention and maintenance/retrieval theories.
REDICK, CALVO, GAY, AND ENGLE
310
In Experiment 2 of Unsworth et al. (2004), the authors made a critical change to the antisaccade task described previously. Here, a cue presented 1,200 ms before the critical stimulus indicated whether each trial required a pro- or an antisaccade as the correct response. Given this manipulation, one might expect that the participants could use the cue to prepare a general response rule for the upcoming stimulus (look toward stimulus/look away from stimulus), but preparation and execution of a specific response is not possible until the actual stimulus is presented. Unsworth et al. (2004) found that the low-WMC group was slower and more error-prone than the high-WMC group on both prosaccade and antisaccade trials. Note that this finding is somewhat at odds with the executive attention framework. Regardless of whether the cue (prosaccade or antisaccade trial) is maintained, low-WMC individuals would be more likely to execute the prepotent response of looking toward the flashing stimulus. This is how Kane and Engle (2003) explained the Stroop performance by low-WMC individuals. Kane and Engle argued that participants were more likely to read the word instead of name the color. Consistent with this idea, the low-WMC participants had a larger Stroop facilitation effect than did high-WMC participants, indicating that they did read the word more often. However, in order to produce prosaccade errors on the cued-saccade task, low-WMC individuals had to go against the prepotent response by looking away from the stimulus. This is clearly at odds with the explanation of Kane and Engle’s (2003) Stroop results. However, the results are consistent with the maintenance/ retrieval account. According to this view, low-WMC individuals have more difficulty retrieving the appropriate response from secondary memory, irrespective of the prepotency of any competing response. These individuals could not or did not maintain the stimulus–response mappings conveyed by the cue and instead attempted to retrieve the cue information and stimulus–response mappings after the stimulus appears. This retrieval search process is more vulnerable to proactive interference from previous trials (Unsworth & Engle, 2007b) than maintaining the appropriate stimulus–response rules within primary memory, and thus lowWMC individuals made more errors on both prosaccade and antisaccade trials.
Inhibition Theory An inhibition theory of WMC (Hasher & Zacks, 1988; Lustig, Hasher, & May, 2001; May, Hasher, & Kane, 1999) is predicated on the idea that inhibitory abilities are the primary determinant of many other cognitive abilities, including WMC. A series of quotes by this research group illustrate this point: Individuals with large [WMC] spans may be those who are best able to handle the proactive interference (PI) that builds up across the series of multiple study and test trials that constitute the span task. (Lustig et al., 2001, p. 200) Inhibition is a fundamental determinant of the apparent differences in what many investigators term “working memory capacity.” (Hasher, Lustig, & Zacks, 2007, p. 229) Our evidence raises the possibility that what most working memory span tasks measure is inhibitory control. (Hasher et al., 2007, p. 231)
To support this view, May et al. (1999) and Lustig et al. (2001) presented two versions of the reading span task to participants. In
one version, the list lengths progressively increased (two, three, four), whereas in the second version, the list lengths progressively decreased (four, three, two). This manipulation should primarily affect performance on a list length of four trials “because set sizes are presented in ascending order and because PI accumulates over trials, those trials with the greatest memory loads are also those subjected to the greatest PI” (May et al., 1999, p. 760). Accordingly, May et al. and Lustig et al. both observed that older adults performed significantly better on the descending compared with the ascending reading span test, consistent with the idea that inhibition of proactive interference is important for scores on WMC tests. However, the list-length manipulation only affected the reading span scores of older adults and not those of young adults. This is important given that Hasher and Zacks’s (1988) theory primarily dealt with the inhibitory failures observed in cognitive aging, and only more recently (e.g., Hasher et al., 2007) has the theory been used to also account for individual differences in WMC within young adults. The executive attention and maintenance/retrieval accounts have explained the pattern of antisaccade results as a consequence of individual differences in WMC (Redick, Heitz, & Engle, 2007). However, if variation in inhibitory abilities is the primary determinant of scores on WMC tests, then inhibition is the cause of the WMC differences on the antisaccade task. Seen in this light, the relationship between performance on WMC and antisaccade tasks is unsurprising: The deficient inhibitory abilities that caused an individual to score poorly on the reading span are also responsible for the inhibitory failures on antisaccade trials. The prosaccade results of Experiment 2 of Unsworth et al. (2004) can also be interpreted within an inhibition framework: Individual differences in inhibitory ability are important for quickly resolving proactive interference in the retrieval of the stimulus–response mappings.
Experiment 1 Given the various theories to explain individual differences in WMC, and specifically the relationships obtained with interference-rich conditions from various experimental tasks, we sought to compare the executive attention (Kane et al., 2007), maintenance/retrieval (Unsworth & Engle, 2007b), and inhibition (Lustig et al., 2001) accounts. Individuals varying in WMC were administered a go/no-go task in order to compare performance according to the different theories. The go/no-go task is widely used as an inhibitory measure, in the developmental (Thorell, Lindqvist, Nutley, Bohlin, & Klingberg, 2009), aging (Rush, Barch, & Braver, 2006), psychopathological (Nigg, 2001), and neuroimaging (Wager et al., 2005) literatures. For example, as Lustig, Hasher, and Zacks (2007) stated, “Perhaps the most studied function of inhibition is to suppress or restrain strong responses that are inappropriate for the current situation. Go/no-go and stop-signal tasks are often used to study this function” (p. 148). Thus, the go/no-go task allows comparison of high- and low-WMC individuals on interference (no-go trials) and noninterference (go trials) conditions, similar to previous studies with other tasks mentioned earlier (e.g., antisaccade, Stroop, flankers). The inhibition account predicts that low-WMC individuals will make more no-go errors. This prediction follows from the idea that low-WMC individuals suffer primarily from a deficit in inhibitory abilities and that they will have more problems withholding the
WORKING MEMORY CAPACITY AND GO/NO-GO
habitual response on no-go trials. The executive attention account similarly predicts that the low-WMC individuals will commit more no-go errors. The experimental context does not reinforce the task goal because the participants respond to go stimuli on 80% of all trials. Thus, failures to maintain the task goal of when not to respond will lead to a habitual but incorrect response to no-go stimuli. However, even when the task goal is maintained, the executive attention account predicts that low-WMC individuals will have difficulty withholding the prepotent response to no-go stimuli. As stated by Kane and Engle (2003), “low [WMC] spans have a relatively enduring deficit in the competition-resolution mechanism, independent of goal maintenance” (p. 63). The maintenance/retrieval account predicts a divergent set of results, namely, that go/no-go performance is not related to individual differences in WMC. Certainly withholding prepotent responses to infrequent no-go trials is difficult relative to responding on go trials, as evidenced by virtually all previous go/no-go studies. However, the stimulus–response mappings are consistent within a block of trials. That is, a specific stimulus is always either a go stimulus or a no-go stimulus, and the stimulus–response mapping is not conditional on previous stimuli or cues. This means that the participant does not have to update the contents of working memory for success on the go/no-go task, in contrast to the cued-version of the antisaccade task discussed previously. The maintenance demand on primary memory is relatively minimal, and even if the task instructions are temporarily forgotten, they can be easily retrieved from secondary memory because there is relatively little interference present. The prediction of no relationship with WMC clearly separates the maintenance/retrieval account from the inhibition and executive attention accounts, and we sought to compare how these three theories account for the pattern of results on the go/no-go task.
Method Participants. Participants were all healthy young adults between 18 and 35 years of age. All participants were recruited from the metropolitan Atlanta area and consisted of college students and community volunteers. Participants received their choice of course credit or a check for $20 as compensation for their participation. Participants were chosen for Experiment 1 on the basis of their performance on three complex span tasks (described below) in a previous visit to the lab. Specifically, scores on the automated operation, symmetry, and reading span tasks were used as indices of WMC. The participants’ performance on each task was transformed into a standardized score, and then their performance across all three tasks was then averaged to form a z-score WMC composite. Participants whose z-score WMC composite was below the 25th percentile of scores from our database were assigned to the low-WMC group, whereas participants whose z-score WMC composite was above the 75th percentile of scores from our database were assigned to the high-WMC group. These high- and low-WMC individuals were then invited to participate in the current study. Although each complex span task is described briefly below, interested readers should consult Unsworth, Heitz, Schrock, and Engle (2005) and Unsworth, Redick, Heitz, Broadway, and Engle (2009) for more detailed information, along with validity and reliability statistics from those samples.
311
Forty-one participants completed Experiment 1. One highWMC participant was removed from all analyses for failing to follow instructions on this and all other tasks completed in the study session. Demographic information about the remaining sample is presented in Table 1. Tasks and procedure Operation span. In the operation span task, participants attempted to mentally solve mathematical problems while also remembering letters in serial order for subsequent memory tests. Participants were presented with three to seven items on each trial, with three trials at each list length, for a total maximum score of 75 letters recalled in the correct serial position across trials. Symmetry span. In the symmetry span task, participants made vertical symmetry judgments about black-and-white figures while also remembering locations of a red square in a 4 ⫻ 4 matrix in serial order for subsequent memory tests. Participants were presented with two to five items on each trial, with three trials at each list length, for a total maximum score of 42 squares recalled in the correct serial position across trials. Reading span. In the reading span task, participants verified the semantic quality of individual sentences while also remembering letters in serial order for subsequent memory tests. Participants were presented with three to seven items on each trial, with three trials at each list length, for a total maximum score of 75 letters recalled in the correct serial position across trials. Go/no-go task. Individual letter stimuli were presented at the center of the computer screen, and participants were instructed to respond to identified go stimuli using their dominant hand by pressing the center button on a Psychology Software Tools response box. Letters were presented in white against a black background. Each trial consisted of an individual letter presented for 300 ms, followed by a blank screen for 700 ms. Participants had a total of 1,000 ms to respond to each letter. In the first block, participants were instructed to make a button response anytime the letter X was presented onscreen (go trials). Participants were instructed not to respond to any non-X letters (no-go trials). Fifteen consonant, non-X letters were randomly used as no-go stimuli. Go stimuli occurred on 80% of trials, with no-go stimuli occurring on the remaining 20% of trials. Participants completed a practice session of 20 trials (16 go and four no-go trials). During practice only, participants were given Table 1 Demographic Information Across Experiments z-WMC Experiment/ group Experiment High Low Experiment High Low Experiment Overall Experiment High Low Note.
Age in years
n
M (SD)
Male/female
M (SD)
23 17
0.89 (0.20) ⫺1.12 (0.50)
4/19 4/13
24 (3.9) 25 (4.5)
21 21
0.95 (0.18) ⫺1.00 (0.50)
11/10 10/11
23 (4.2) 25 (4.6)
159
0.00 (0.80)
80/79
23 (4.4)
16 15
0.92 (0.26) ⫺1.24 (.69)
5/11 7/8
22 (2.6) 24 (2.9)
1 2 3 4
z-WMC ⫽ working memory capacity z-composite variable.
REDICK, CALVO, GAY, AND ENGLE
312
auditory feedback in the form of a brief beep after any errors that were made. In order to ensure that the participants understood the task instructions, a criterion of 75% accuracy was set for participants to continue to the experimental trials. All participants were able to meet this criterion after one block of practice (except for one participant who required two practice blocks), and the number of blocks to reach criterion did not differ between the WMC groups. During the first experimental block of trials, 200 trials (160 go trials and 40 no-go trials) were administered. The first block took approximately 3.5 min to complete. After completing the first block, participants were instructed to make button responses to all non-X letters (go trials) and to withhold responding to the letter X (no-go trials). This manipulation was included to create even more interference on the go/no-go task. That is, participants were expected to produce more no-go errors after the response-mapping changed because they had previously made responses to X. Participants then completed a second practice and experimental block with the reversed stimulus–response mapping. Other than the change in stimulus–response mapping and frequency of the respective categories of letters (X and non-X), the procedure was identical to the first block. The participants then completed tasks that are not the focus of the current report. Design and analysis. The study was a 2 (WMC) ⫻ 2 (trial type) ⫻ 2 (block) design, with WMC (high, low) as a betweensubjects variable and trial type (go, no-go) and block (first, second) as within-subject variables. Signal detection analyses (d⬘ and C) were calculated on the basis of go hit rates and no-go false alarm rates; hit and false alarm rates equal to 0 or 1 were adjusted by .01. An alpha of p ⬍ .05 was used for all statistical tests in this and all subsequent experiments. In addition to reporting individual p values, 2p is provided as index of effect size.
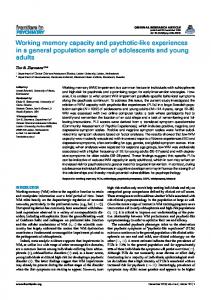
Results Accuracy. Figure 1 presents the accuracy data for the go/ no-go task for the high- and low-WMC groups. As can be seen, no-go trials were less accurate than go trials, and performance in Block 2 was less accurate compared with those in Block 1. In addition, no-go performance declined across blocks, whereas go trials remained highly accurate. However, the WMC groups do not appear to differ in their error performance on the go/no-go task.
1.00
Proportion Correct
High
Low
0.95 0.90 0.85
These observations were confirmed with a 2 (WMC) ⫻ 2 (trial type) ⫻ 2 (block) analysis of variance (ANOVA). The main effects of trial type, F(1, 38) ⫽ 46.04, p ⬍ .01, 2p ⫽ .548, and block, F(1, 38) ⫽ 42.45, p ⬍ .01, 2p ⫽ .528, were significant as was the Trial Type ⫻ Block interaction, F(1, 38) ⫽ 35.00, p ⬍ .01, 2p ⫽ .479. However, none of the effects involving WMC group approached significance (all Fs ⬍ 1). Response times. Mean RTs on correct go trials are presented in Table 2. Go trials in Block 2 were slower than those in Block 1, but no WMC group differences were present. A 2 (WMC) ⫻ 2 (block) ANOVA indicated a significant main effect of Block, F(1, 38) ⫽ 39.59, p ⬍ .01, 2p ⫽ .510. The main effect of WMC group and the interaction did not approach significance (both Fs ⬍ 1). We also assessed the RT variability of each participant’s responses on correct go trials by calculating individual standard deviations (ISD). Examining variability, RTs in Block 2 were more variable than those in Block 1, but they did not appear to differ as a function of WMC group (see Table 2). RT variability, as indexed by ISD, was assessed by a 2 (WMC) ⫻ 2 (block) ANOVA. Mirroring the analyses of the mean RTs above, the main effect of block was significant, F(1, 38) ⫽ 8.06, p ⬍ .01, 2p ⫽ .175. The main effect and interaction involving WMC group did not approach significance (both Fs ⬍ 1). No-go RT performance in Block 1 was not explicitly assessed, as four low-WMC and five high-WMC participants made zero no-go errors in Block 1. However, all participants except for one high-WMC participant made at least one no-go error in Block 2, and so a one-way ANOVA with WMC as the between-subjects variable was used to examine the RT data on incorrect no-go trials for Block 2. The WMC groups did not statistically differ in their no-go RTs in Block 2 (F ⬍ 1). In addition, Block 2 RT performance was assessed separately for the participants who made at least one no-go error. There was a significant main effect of trial type, F(1, 37) ⫽ 117.71, p ⬍ .01, 2p ⫽ .761, with faster RTs observed on incorrect no-go trials than on correct go trials. However, neither the WMC ⫻ Trial Type interaction, F(1, 37) ⫽ 1.13, p ⫽ .30, nor the WMC main effect (F ⬍ 1) was significant. Signal detection indices. As can be seen in Table 2, sensitivity (d⬘) decreased across blocks, and the bias (C) to respond increased across blocks as well. Again, the WMC groups did not differ in their performance. A 2 (WMC) ⫻ 2 (block) ANOVA was used to separately examine d⬘ and C. For d⬘, the main effect of block was significant, F(1, 38) ⫽ 48.41, p ⬍ .01, 2p ⫽ .560, but neither the main effect of WMC group, F(1, 38) ⫽ 1.04, p ⫽ .32, nor the WMC ⫻ Block interaction (F ⬍ 1) was significant. For C, the main effect of block was significant, F(1, 38) ⫽ 42.73, p ⬍ .01, 2p ⫽ .529, but the main effect and interaction involving WMC did not approach significance (both Fs ⬍ 1).
0.80
Discussion 0.75 0.70
go1
go2
nogo1
nogo2
Trial Type
Figure 1. Mean proportion correct as a function of working memory capacity group, trial type, and block in Experiment 1. Error bars represent ⫾ 1 standard error.
Results in Experiment 1 were in line with expectations in regard to the effect of task manipulations on performance. Accuracy on no-go trials was worse than on go trials, and when incorrect responses to no-go stimuli were made, they were faster than correct go responses. In addition, changing the go/no-go response mapping led to slower and more variable responses to go stimuli and to more errors on no-go trials. The signal detection analyses
WORKING MEMORY CAPACITY AND GO/NO-GO
Table 2 Go Response Time (RT) and Signal Detection Theory Data in Experiment 1 for High and Low Working Memory Capacity (WMC) Groups
WMC group
Block 1
Block 2
M (SD)
M (SD)
High Low
Mean go RT (ms) 321 (43.1) 326 (48.2)
354 (56.8) 352 (51.4)
High Low
ISDs for go RT (ms) 63 (21.4) 63 (13.7)
72 (28.3) 74 (23.1)
High Low
d⬘ (sensitivity) 4.1 (0.53) 3.9 (0.72)
3.4 (0.58) 3.3 (0.56)
High Low
C (bias) ⫺0.32 (0.258) ⫺0.37 (0.268)
Note.
⫺0.58 (0.297) ⫺0.64 (0.360)
ISDs ⫽ individual standard deviations.
corroborated the pattern of accuracy results as a function of trial type and block. The most striking finding was the lack of WMC group differences on any of the dependent variables from the go/no-go task. While forming strong conclusions based on failure to reject the null hypothesis can be misleading, the consistency of the similarity in performance of the high- and low-WMC groups across all of the dependent variables warrants consideration that WMC may not be important for performance on the go/no-go task. Although accuracy on go trials was very high, no-go accuracy was much lower, suggesting that this condition was sensitive enough to detect differences in performance. In addition, participants were given a total of 1,000 ms to respond to each letter, and on average both WMC groups responded well within this deadline. Note that recent studies utilizing the same extreme-groups design and method of identifying WMC groups have found significant differences using similar sample sizes (Heitz & Engle, 2007; Unsworth, 2007; Unsworth & Engle, 2007b). As described below, Experiment 2 used a similar sample size, and WMC group differences were obtained only after a critical task manipulation occurred. What, then, can we conclude about the results of Experiment 1 in relation to the various theories of WMC outlined in the introduction? First, the similarity in performance of the WMC groups is damaging to the inhibition hypothesis, to the extent that performance on the go/no-go task reflects inhibitory abilities. This interpretation of the go/no-go task is found throughout the literature; for example, Thorell et al. (2009) described the go/no-go task as measuring one of the “most fundamental forms of inhibition: inhibition of a motor response” (p. 108). Some researchers have argued for separable inhibitory functions (Friedman & Miyake, 2004; Harnishfeger, 1995; Hasher, Zacks, & May, 1999; Nigg, 2000). Thus, the inhibition view can be modified to state that the go/no-go task measures motor or behavioral inhibition, and so
313
WMC differences would only be found on tasks specifically tapping cognitive inhibition. However, the go/no-go task used in Experiment 1 falls within the executive classification of inhibition tasks according to Nigg (2001). Similarly, according to Friedman and Miyake’s (2004) taxonomy, performance on go/no-go tasks reflects prepotent response inhibition, which is “the ability to deliberately suppress dominant, automatic, or prepotent responses” (p. 104). Friedman, Miyake, and colleagues (Friedman & Miyake, 2004; Friedman et al., 2006; Miyake et al., 2000) typically have used the Stroop and antisaccade tasks, among others, to reflect this type of inhibition, so worse performance by low-WMC individuals would still be expected on the go/no-go task. In addition, the results are inconsistent with the predictions of the executive attention account. As stated earlier, successfully preventing a response on no-go trials should depend on the goal maintenance and/or response conflict resolution abilities fundamental to individual differences in WMC (Engle & Kane, 2004). One possibility is that low-WMC individuals can adequately maintain the goal during the go/no-go task, and thus any deficits in goal maintenance are not evident in performance on this task. In addition, there is no dimensional overlap on the go/no-go task, according to the stimulus–response compatibility taxonomy used by Kornblum, Hasbroucq, and Osman (1990). That is, the relevant dimension of the stimulus is the letter’s identity, and there is no irrelevant dimension or incompatibility with the response method. This is different from the Stroop and antisaccade tasks described previously and could indicate a critical factor in determining whether individual differences in WMC are important for performance on a given task. The results are consistent with the maintenance/retrieval hypothesis (Unsworth & Engle, 2007b). The rules for responding to the stimuli in the go/no-go task (e.g., “if X, response; if not-X, no response”) are consistently mapped (Schneider & Shiffrin, 1977). Thus, the maintenance demand in primary memory is relatively minimal and does not change within the block. In addition, as long as the task instructions are actively maintained, there is no need to retrieve any information from secondary memory. That is, one does not need to remember the previous stimuli in order to respond correctly to each new letter. This is different from the cuedsaccade task described in the introduction, where the ability to quickly update and then maintain the cue for the current trial is central to success on the task. In the go/no-go task, primary memory capacity is large enough for both high- and low-WMC individuals to actively maintain the response rule(s), and retrieval from secondary memory is not needed to successfully perform the task. Thus, both high- and low-WMC participants are equally likely to quickly and consistently select the correct response for both go and no-go trials.
Experiment 2 Whereas Experiment 1 was a first step in identifying the role of individual differences in WMC in determining go/no-go task performance, several questions were left unanswered. First, although the null results of Experiment 1 are consistent with the maintenance/retrieval view, a more convincing demonstration of the adequacy of this hypothesis would come from both a replication of these null results and the demonstration that manipulating the maintenance and retrieval demands of the go/no-go task leads to
REDICK, CALVO, GAY, AND ENGLE
314
WMC differences. Thus, Experiment 2 compared the standard go/no-go task used in Experiment 1 with a conditional go/no-go task in order to examine how these changes affect the relationship with individual differences in WMC. By comparing the two versions of the go/no-go task within the same participants, we can demonstrate that our assessment of WMC is sensitive and that the null results obtained in Experiment 1 do not represent misidentification of WMC. Although performance on the standard go/no-go task was expected to again produce no WMC group differences (according to the maintenance/retrieval account), performance on the conditional go/no-go task was predicted to be worse for the low-WMC individuals. In addition, the conditional go/no-go task includes trials that represent relatively minimal maintenance demands and other trials that require maintaining information across time in order to respond correctly. If the maintenance/retrieval hypothesis is correct, WMC group differences should emerge predominantly on the latter type of trial within the conditional go/no-go task.
Method Participants. Forty-three participants were recruited, selected, and compensated in the same manner as in Experiment 1. None of the individuals participated in Experiment 1. One highWMC participant was removed from all analyses for failing to follow instructions on this and all other tasks completed in the study session. Demographic information about the remaining sample is presented in Table 1. Tasks and procedure. The task and procedure for the standard go/no-go task was very similar to that of the second block in Experiment 1. Participants were instructed to use the spacebar to make button responses to all non-X letters (go trials) and to withhold responding to the letter X (no-go trials). The practice and experimental block was identical to the second block in Experiment 1, with the exception that participants here performed 30
Figure 2.
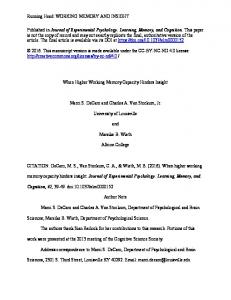
practice trials (24 go and 6 no-go trials) and 300 experimental trials (240 go and 60 no-go trials). Again participants had to meet a 75% accuracy criterion during the practice block in order to move to the experimental block. All participants were able to meet this criterion after one or two blocks of practice (except for one participant who required three practice blocks), and the number of blocks to reach criterion did not differ between the WMC groups. The experimental block lasted approximately 5 min. The conditional go/no-go task was based on and similar to the task developed by Garavan, Ross, and Stein (1999; see also Langenecker & Nielson, 2003; Nielson, Langenecker, & Garavan, 2002). The conditional go/no-go task also presented individual white letters against a black background and required a spacebar response with the dominant hand to the instructed go stimuli. Letters were presented for 300 ms, followed by a blank screen for 700 ms. Participants had a total of 1,000 ms to respond to each letter. However, the rules for responding and the frequency of events differed in this task. Specifically, participants were instructed to make a response only to the letters M and W and to not respond to any non-M or non-W letters (distractor trials; 50% of all trials). However, participants were told to respond to the M or W letter only if its identity had alternated since the last presentation (target trials; 40% of all trials). If the M or W had not alternated and was the same identity as the last target that had been presented, participants were instructed to not respond (lure trials; 10% of all trials). Figure 2 provides an illustration of the various trial types in the conditional go/no-go task. Participants completed a practice block of 40 trials (20 distractor, 16 target, and 4 lure trials). During practice only, participants were given auditory feedback in the form of a brief beep after any errors that were made. In order to ensure that the participants understood the task instructions, we set a criterion of 75% accuracy before participants were allowed to continue to the experimental trials. Contrary to the previous results, the low-WMC
Example of trial types and stimuli used in conditional go/no-go task.
WORKING MEMORY CAPACITY AND GO/NO-GO
315
group required more practice blocks than did the high-WMC group to reach this criterion, F(1, 40) ⫽ 10.57, 2p ⫽ .209. Each of the three experimental blocks contained 200 trials (100 distractor, 80 target, and 20 lure trials). Each block took approximately 4 min to complete. After completing this task, the participants completed other tasks that are not the focus of the current report. All participants completed the standard task before the conditional task. Design and analysis. A 2 (WMC) ⫻ 2 (trial type) design was used in the standard go/no-go task, with WMC (high, low) as a between-subjects variable and trial type (go, no-go) as a withinsubject variable. In the conditional go/no-go task, a 2 (WMC) ⫻ 3 (trial type) design was used, with WMC (high, low) as a betweensubjects variable and trial type (target, distractor, lure) as a withinsubject variable. Signal detection analyses (d⬘ and C) were calculated for the standard go/no-go task on the basis of go hit rates and no-go false alarm rates and for the conditional go/no-go task on the basis of target hit rates and lure false alarm rates. In both tasks, hit and false alarm rates equal to 0 or 1 were adjusted by .01. An alpha of p ⬍ .05 was used for all statistical tests; Bonferroni-corrected alpha levels for follow-up tests are reported where necessary.
Table 3 Go/Target Response Time (RT) and Signal Detection Theory Data in Experiment 2 for High and Low Working Memory Capacity (WMC) Groups
Results
Note.
Standard go/no-go results Accuracy. Figure 3 presents the accuracy data for the standard go/no-go task for the high- and low-WMC groups. As can be seen, as a whole, participants were less accurate on no-go trials than on go trials. Again, the WMC groups did not appear to differ in their error performance on the go/no-go task. These observations were confirmed with a 2 (WMC) ⫻ 2 (trial type) ANOVA. Although the main effect of trial type, F(1, 40) ⫽ 174.70, p ⬍ .01, 2p ⫽ .814, was significant, neither the WMC main effect nor the WMC ⫻ Trial Type interaction approached significance (both Fs ⬍ 1). Response times. Mean and ISD RTs for correct go trials are presented in Table 3. Again, no WMC group differences were present on the mean or ISD RTs on the standard go/no-go task. One-way ANOVAs revealed that the WMC groups did not differ on correct RTs to go trials, neither for mean performance (F ⬍ 1) nor for ISD, F(1, 40) ⫽ 2.20, p ⫽ .15. In addition, all participants made at least one no-go error, so a one-way ANOVA with WMC
Proportion Correct
1.00
High
0.95
Low
0.90 0.85 0.80 0.75 0.70
go
nogo Trial Type
Figure 3. Mean proportion correct as a function of working memory capacity group and trial type in standard go/no-go task in Experiment 2. Error bars represent ⫾ 1 standard error.
WMC group
Standard go/no-go
Conditional go/no-go
M (SD)
M (SD)
High Low
Mean go RT (ms) 324 (49.4) 328 (28.8)
423 (51.8) 449 (70.6)
High Low
ISDs for go RT (ms) 64 (23.1) 72 (16.1)
88 (21.8) 104 (29.8)
High Low
d⬘ (sensitivity) 3.1 (0.36) 3.3 (0.44)
3.3 (0.56) 2.7 (1.02)
High Low
C (bias) ⫺0.81 (0.21) ⫺0.79 (0.23)
⫺0.56 (0.27) ⫺0.63 (0.26)
ISDs ⫽ individual standard deviations.
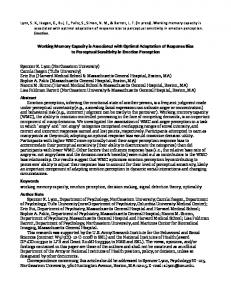
as the between-subjects variable was used to examine the RT data on incorrect no-go trials. The main effect of WMC group was not significant (F ⬍ 1). Finally, a 2 (WMC) ⫻ 2 (trial type) ANOVA indicated that the main effect of trial type was significant, F(1, 40) ⫽ 109.08, p ⬍ .01, 2p ⫽ .732, with incorrect no-go responses faster than correct go responses. However, both the main effect of WMC and the WMC ⫻ Trial Type interaction did not approach significance (both Fs ⬍ 1). Signal detection indices. As can be seen in Table 3, sensitivity (d⬘) and the bias (C) to respond did not appear to differ as a function of WMC group. A one-way ANOVA was used to separately examine d⬘ and C. The main effect of WMC group was not significant for d⬘, F(1, 40) ⫽ 1.12, p ⫽ .30, or for C (F ⬍ 1). Conditional go/no-go results Accuracy. The accuracy data for the conditional go/no-go task are displayed in Figure 4. As can be seen, accuracy was high for both WMC groups on target and distractor trials. However, lower accuracy was obtained on lure trials, and the low-WMC group performed especially worse on the lure trials. A 2 (WMC) ⫻ 3 (trial type) ANOVA confirmed these observations. Significant main effects of trial type, F(2, 80) ⫽ 87.07, p ⬍ .01, 2p ⫽ .685, and WMC, F(1, 40) ⫽ 7.99, p ⬍ .01, 2p ⫽ .167, were obtained. However, these effects were qualified by a significant WMC ⫻ Trial Type interaction, F(2, 80) ⫽ 5.97, p ⬍ .01, 2p ⫽ .130. Follow-up t tests (␣ ⫽ .0167) indicated that the high-WMC group was more accurate on target trials, t(40) ⫽ 2.56, p ⫽ .01, and lure trials, t(40) ⫽ 2.61, p ⫽ .01, but the WMC groups were not statistically different on distractor trials, t(40) ⫽ 1.72, p ⫽ .09. Response times. Table 3 displays the mean and variability for target RTs in the conditional go/no-go task. As can be seen, the mean difference between WMC groups appeared somewhat larger than that found on the standard go/no-go task, but performance for the two groups was similar. In addition, RT variability, as ex-
REDICK, CALVO, GAY, AND ENGLE
316
Proportion Correct
1.00 0.95
High
Low
0.90 0.85 0.80 0.75 0.70 0.65 0.60
target
nontarget
lure
Trial Type Figure 4. Mean proportion correct as a function of working memory capacity group and trial type in conditional go/no-go task in Experiment 2. Error bars represent ⫾ 1 standard error.
pressed by ISD on correct target trials, appeared to be greater for the low-WMC group. These observations were confirmed by two separate one-way ANOVAs. The main effect of WMC group was not significant on mean target trials, F(1, 40) ⫽ 1.73, p ⫽ .20. However, the low-WMC participants exhibited greater RT variability, as seen by the significant main effect of WMC group on target ISD, F(1, 40) ⫽ 4.13, p ⫽ .05, 2 ⫽ .094. Signal detection indices. Table 3 lists the results for sensitivity (d⬘) and bias (C). The high-WMC group appears to have a larger d⬘ value, but C does not seem to differ as a function of WMC group. Two separate one-way ANOVAs on d⬘ and C confirmed these interpretations. Specifically, in the analysis of d⬘, the main effect of WMC group was significant, F(1, 40) ⫽ 6.54, p ⫽ .01, 2p ⫽ .140, whereas in the analysis of C, the main effect of WMC group was not significant (F ⬍ 1). Lure accuracy as a function of lag since previous target. Lure accuracy was further examined by analyzing lure trials as a function of the number of items intervening between the last target and the current lure. For example, the lure trial in Figure 2 is separated from the most recent target letter by two distractor letters and thus is classified as a lag2 lure trial. All of the 60 lure trials were randomly distributed among lags ranging from zero to three.1 Lure accuracy as a function of lag since the last target is presented for both WMC groups in Figure 5. As can be seen, the
Proportion Correct
1.00 0.90 0.80 0.70 0.60 0.50
High Low
two WMC groups performed equivalently on lag0 lure trials, but the high-WMC group was more accurate for all nonzero lags. In addition, lure accuracy decreased, with increasing lag for the low-WMC group, whereas the performance of the high-WMC group did not appear to differ as a function of lag. These observations were confirmed with a 2 (WMC) ⫻ 4 (lag) ANOVA. Significant main effects of lag, F(3, 120) ⫽ 8.37, p ⬍ .01, 2p ⫽ .173, and WMC, F(1, 40) ⫽ 9.97, p ⬍ .01, 2p ⫽ .199, were both qualified by a significant WMC by lag interaction, F(3, 120) ⫽ 5.12, p ⬍ .01, 2p ⫽ .113. To decompose this interaction, we examined the simple main effect of WMC group at each level of lag. Follow-up t tests (␣⫽ .0125) indicated that the WMC groups did not statistically differ on lag0 lures, t(40) ⫽ 0.79, p ⫽ .43. However, the high-WMC group was statistically more accurate than the low-WMC group on lag1 lures, t(40) ⫽ 2.56, p ⫽ .01; lag2 lures, t(40) ⫽ 2.87, p ⬍ .01, and lag3 lures, t(40) ⫽ 3.22, p ⬍ .01.2 Next, we performed a repeated measures ANOVA separately for the high- and low-WMC groups. For the high-WMC group, the effect of lag was not significant (F ⬍ 1). In contrast, the lag effect was significant for the low-WMC group, F(3, 60) ⫽ 11.00, p ⬍ .01, 2p ⫽ .355, and the linear trend indicated that the accuracy on lure trials decreased as lag increased, F(1, 20) ⫽ 22.46, p ⬍ .01, 2p ⫽ .529. As a final examination of the effect of lag upon lure accuracy, all nonzero lags (1, 2, 3, 4) were combined to form a lagnon0 category to compare directly against lag0 trials. This was done to roughly equate the number of observations contributing to each lag category (28 trials for lag0, 32 trials for lagnon0), to ensure that the significant effects observed at, for example, lag3 were not a consequence of using fewer observations. A 2 (WMC) ⫻ 2 (lag) ANOVA again indicated significant main effects of WMC group, F(1, 40) ⫽ 6.44, p ⫽ .02, 2p ⫽ .139, and lag, F(1, 40) ⫽ 16.99,
0.40
0
1
2
3
# of intervening items between last target and current lure
Figure 5. Mean proportion correct as a function of working memory capacity group and number of intervening items between previous target and current lure trial in conditional go/no-go task in Experiment 2. Error bars represent ⫾ 1 standard error.
1 One of the lags was actually four, but because there was only one observation for each participant at this lag length, we did not plot this lag in Figure 5. Including the lag4 trial did not change the results. The lag4 trial is included in the variable lagnon0 lure accuracy described in the text. 2 Because the Bonferroni-corrected critical alpha used for the follow-up t tests was p ⫽ .0125, the WMC group comparison of lag1 lure accuracy only approached significance ( p ⫽ .0142).
WORKING MEMORY CAPACITY AND GO/NO-GO
p ⬍ .01, 2p ⫽ .298, which were qualified by a significant WMC ⫻ Lag interaction, F(1, 40) ⫽ 9.08, p ⬍ .01, 2p ⫽ .185. A follow-up t test (␣⫽ .025) indicated that the high-WMC group was more accurate on lagnon0 trials, t(40) ⫽ 3.12, p ⬍ .01. Finally, pairedsamples t tests (␣⫽ .025) indicated that the lag0 and lagnon0 lure accuracy did not differ for the high-WMC group, t(20) ⫽ 0.99, p ⫽ .34, but lag0 lure accuracy was higher than lagnon0 lure accuracy for the low-WMC group, t(20) ⫽ 4.31, p ⬍ .01. Comparison between tasks. As further validation that WMC effects were only present on the conditional go/no-go task, and not on the standard go/no-go task, we conducted two additional 2 (WMC) ⫻ 2 (version) ANOVAs using d⬘ and C, respectively, as the dependent variables. For sensitivity, neither the main effect of version, F(1, 40) ⫽ 1.67, p ⫽ .20, nor that of WMC, F(1, 40) ⫽ 2.99, p ⫽ .09, was significant. However, the WMC ⫻ Version interaction was significant, F(1, 40) ⫽ 8.65, p ⬍ .01, 2p ⫽ .178, corroborating the earlier results that the high-WMC group showed greater sensitivity on the conditional go/no-go task only. For bias, although the main effect of version was significant, F(1, 40) ⫽ 18.24, p ⬍ .01, 2p ⫽ .313, indicating a greater bias to make a response in the standard go/no-go task, the main effect of WMC and the WMC ⫻ Version interaction did not approach significance (both Fs ⬍ 1).
Discussion The results of Experiment 2 conform with the predictions of the maintenance/retrieval hypothesis (Unsworth & Engle, 2007b). The standard go/no-go results replicated the lack of WMC effects across the various accuracy, RT, and signal detection indices of performance that were observed in Experiment 1. As the explanation for the lack of significant standard go/no-go effects and the implications for the three WMC theories was thoroughly discussed earlier, we focus our discussion here on the conditional go/no-go results. First, the high-WMC group was more accurate on both target and lure trials, and both groups performed at ceiling on distractor trials. Second, lure accuracy varied as a function of the amount of time and the number of intervening items since the most recent target. Whereas high-WMC individuals showed no effect of lag on lure accuracy, the low-WMC group showed a deficit when only one item intervened between the current lure and the previous target. Finally, although the two WMC groups did not differ on mean RT to targets, the low-WMC group was more variable when these participants did correctly respond. Notably, the signal detection analyses showed that these results were not simply due to a bias for the low-WMC individuals to respond to any M or W, as might be expected if they had misunderstood the task instructions. Instead, they responded less often than did the high-WMC group when they were supposed to respond to targets, and they responded more often than the high-WMC group when they were supposed to withhold a response to lures. In contrast to the standard go/no-go task, performance on the conditional version depended on updating and maintaining the contents of working memory in order to respond correctly the next time an M or W was encountered. According to the maintenance/retrieval hypothesis, there are multiple ways in which individual differences in WMC would be important for successful performance on the conditional go/no-go task. Upon seeing the letter M and responding to it as a target, a participant may update the current goal (e.g., if W, response). This
317
would allow the individual to quickly and accurately respond to the letter W whenever it occurs, but keeping this information active in memory would also help prevent incorrect responses to the prepotent but incorrect M, should it occur as a lure. Thus, highWMC individuals can use primary memory to update and then maintain the current target information to guide behavior. In contrast, low-WMC individuals have more difficulty appropriately updating primary memory (Unsworth & Engle, 2008) and thus are more likely to have lost the current target letter information by the time it is needed. However, even if the information is lost from primary memory, either through decay due to the passage of time or interference due to the displacement by subsequent stimuli, a controlled search of secondary memory could still allow one to correctly respond when an M or W occurs. That is, because high-WMC individuals are also better at using retrieval cues to correctly identify the most recent occurrence of M or W as a target, they are more likely to respond correctly even if the current target letter is not held within primary memory. Note that the ability to use retrieval cues to delimit the search set to the most recent M or W is also important for accurately responding on target trials when the information is not updated and held within primary memory. This accounts for the slight accuracy advantage for the high-WMC group on target trials and also provides a mechanism to explain the differences in target RT variability. If we think of the controlled search of secondary memory as a process whereby items are sampled from a search set (Raaijmakers & Shiffrin, 1981), then the time to select the appropriate item varies as a function of the number of samples necessary to retrieve the appropriate representation. Thus, if low-WMC individuals are more likely to engage in the controlled search process, then even when they retrieve the correct recent instance of M or W, the search process takes a variable amount of time. These two factors combine to produce more variability in RTs to targets in the conditional go/no-go task for the low-WMC group. The conditional go/no-go results are also largely consistent with the executive attention view. Failures in goal maintenance and/or response conflict resolution would lead to impaired performance on both target and lure trials, as seen by the low-WMC group’s performance. In addition, the WMC ⫻ Lag interaction seen in lure accuracy (see Figure 5) is consistent with a goal maintenance failure by the low-WMC group only. The inhibition view has more difficulty accounting for the pattern of WMC results on the conditional go/no-go task. From this view, the low-WMC group would be expected to have difficulty inhibiting responses to lure trials, which was observed. However, the low-WMC group also produced fewer correct responses to target trials— here, the low-WMC group inhibited responding more than did the high-WMC group (albeit incorrectly). It is possible that the WMC ⫻ Lag interaction can be explained by the inhibition view, if inhibition is strongest immediately after responding to the previous target and then decays more quickly for low-WMC individuals than for high-WMC individuals (e.g., Campbell & Arbuthnott, 1996). However, the initial equal inhibition strength, followed by a decay in inhibition only by low-WMC individuals, should be evident on target trials too. Thus, one might expect the WMC groups to perform equally on targets immediately following a target (lag0 target) when inhibition from responding to the previous target is strongest. However, the high-WMC group made more correct responses to lag0 targets than did the low-
REDICK, CALVO, GAY, AND ENGLE
WMC group, t(40) ⫽ 2.25, p ⫽ .03. Again, the interpretation is that the low-WMC group inhibited responses on lag0 targets more than did the high-WMC group. In our view, the conditional go/ no-go results fit better with either the maintenance/retrieval or executive attention accounts.
Experiment 3 Experiment 2 indicated sizable effects due to WMC on performance of the conditional go/no-go task. One goal of Experiment 3 was to examine this relationship across a much larger, full-range sample of young adults, as opposed to the extremegroups approach that has sometimes been criticized (Preacher, Rucker, MacCallum, & Nicewander, 2005). This allowed us to assess more directly the magnitude of the relationship between WMC and conditional go/no-go task performance, along with replicating the effects observed in Experiment 2. In addition, because the order of standard and conditional go/no-go tasks was not counterbalanced in Experiment 2, it is possible that the significant WMC effects observed on the conditional go/no-go task resulted from participants having previously completed the standard go/no-go task. In the current study, the participants completed only the conditional go/no-go task. The results of Experiment 1 (standard go/no-go task only) and Experiment 3 (conditional go/no-go task only) can be compared with the within-subject results observed in Experiment 2 (both standard and conditional go/no-go tasks). Finally, in Experiment 3 we used hierarchical regression analyses to examine the degree to which the updating, maintenance, and inhibitory processes we have argued are critical for successful performance on the conditional go/no-go task are shared processes with WMC as measured by span tasks.
Method Participants. A total of 171 participants completed Experiment 3. Participants were recruited and compensated in the same manner as Experiment 1 and 2. None of the individuals had participated in Experiment 1 or 2. All variables were assessed for outliers by visual inspection of histograms and scatterplots, along with formal measures of leverage, influence, and distance (e.g., Cook’s D). Twelve participants were identified as outliers, leaving 159 participants in the final sample (see Table 1 for demographic information). Tasks and procedure. All participants completed all tasks in the same order, within the same 90-min session. All participants first completed a brief task as practice using the computer mouse to click on different locations on the screen. Participants completed three WMC tasks (operation span, symmetry span, running letter span) and five other unrelated tasks (for approximately 30 min) before completing the conditional go/no-go task. Operation and symmetry span were identical to the versions used in Experiment 1 and 2. Running letter span. This task was based on one first used by Pollack, Johnson, and Knaff (1959). Participants were presented with a series of letters and were instructed in advance of each trial to recall the last 3, 4, 5, 6, or 7 letters in serial order. For each of the possible recall series n, participants were presented with n, n ⫹ 1, and n ⫹ 2 letters. The maximum possible score was 75 letters recalled in the correct serial position across trials.
Conditional go/no-go task. The procedure for the conditional go/no-go task was identical to the version used in Experiment 2, with the following two exceptions. First, instead of using M and W as the target letters, X and Y were used. This was done to have monosyllabic letters for both possible targets in case participants were rehearsing the letters subvocally. In addition, Garavan et al. (1999) used X and Y as the target stimuli in their study. Second, whereas the experimenter was present throughout the task during Experiment 2, here the participant completed the three blocks of real trials after the experimenter left the room. This was done to be consistent with the other tasks administered during the test session. Design and analysis. For the purpose of the current analyses, the WMC variable was formed by standardizing each of the three representative tasks separately and then averaging them together to form z-score composites. These composites were justified given that the average correlation among the three WMC tasks was .46. In addition, recent evidence shows that running letter span, operation span, and symmetry span account for similar variance in fluid intelligence, suggesting that the three tasks have high constructand criterion-related validity (Broadway & Engle, 2010). Lag analyses of lure accuracy focused on the comparison between lag0 and lagnon0 lure trials, and the lagnon0 variable was formed in the same way as in Experiment 2.
Results Descriptive statistics. Accuracy as a function of trial type is presented in Figure 6, and descriptive statistics for the conditional go/no-go task variables are shown in Table 4. As can be seen, overall conditional go/no-go task performance was very similar to that observed in Experiment 2. A repeated measures ANOVA with trial type as the within-subject variable indicated a significant main effect of trial type, F(2, 316) ⫽ 337.51, p ⬍ .01, 2p ⫽ .681. Follow-up t tests (␣⫽ .0167) indicated that accuracy was highest on distractor trials and lowest on lure trials (all ps ⬍ .001). In addition, a repeated measures ANOVA on lag indicated a significant main effect of lag, F(1, 158) ⫽ 39.24, p ⬍ .01, with lag0 lure accuracy higher than lagnon0 lure accuracy. Correlational and regression analyses with working memory capacity. Correlations for conditional go/no-go measures with the WMC z-composite are presented in Table 4. Although Exper-
1.00 0.95
Proportion Correct
318
0.90 0.85 0.80 0.75 0.70 0.65 0.60
target
distractor
lure
Trial Type
Figure 6. Mean proportion correct as a function of trial type in conditional go/no-go task in Experiment 3. Error bars represent ⫾ 1 standard error.
WORKING MEMORY CAPACITY AND GO/NO-GO
Table 4 Descriptive Statistics and Conditional Go/No-Go Task Correlations With Working Memory Capacity for Experiment 3 Measure
M (SD)
r
Target RT mean Target RT ISD d⬘ C Lag0 lure accuracy Lagnon0 lure accuracy
405 (47) 102 (27) 2.7 (0.98) ⫺0.57 (0.25) 0.78 (0.16) 0.72 (0.19)
⫺.12 ⫺.34ⴱ .45ⴱ ⫺.01 .26ⴱ .41ⴱ
Note. RT ⫽ response time; ISD ⫽ individual standard deviation; z-WMC ⫽ working memory capacity z-composite variable. ⴱ p ⬍ .05.
iment 2 used a much smaller sample with extreme-groups based on WMC, the correlational results from the full-range sample in Experiment 3 corroborate the previous findings. Specifically, WMC was significantly related to target RT variability (ISD), despite not being significantly related to mean RT performance on target trials and even though mean and ISD RT were correlated strongly (r ⫽ .77). In addition, the positive correlation between d⬘ (sensitivity) and WMC was significant, whereas there was no relationship between C (bias) and WMC. Finally, the WMC correlations with accuracy on lag0 and lagnon0 lure trials were both significant. We further explored the significant correlations between WMC and the two lag lure accuracies using a series of hierarchical regressions. Treating WMC as the dependent variable, we entered lag0 lure accuracy and lagnon0 lure accuracy simultaneously to identify to total amount of WMC variance accounted for by lure accuracy. This analysis indicated that the two types of lag lure trials accounted for 17.3% (total R2 ⫽ .173) of the variance with WMC. When lag0 lure accuracy was entered as a predictor on Step 1 and lagnon0 lure accuracy was entered on Step 2, lagnon0 lure accuracy accounted for significant WMC variance (increase in R2 ⫽ .104) over and above lag0 lure accuracy, F(1, 156) ⫽ 19.69, p ⬍ .01. Note that the opposite hierarchical regression (Step 1: lagnon0 lure accuracy; Step 2: lag0 lure accuracy) indicated that lag0 lure accuracy did not account for WMC variance (increase in R2 ⫽ .002) over and above that predicted by lagnon0 lure accuracy (F ⬍ 1).
Discussion The results of Experiment 3 are clear and consistent with the results utilizing the extreme-groups approach in Experiment 2. Performance on both targets and lures within the conditional go/no-go task is related to WMC. We also observed that WMC was related to the variability in RT on correct target trials but not to the mean RT. Additionally, because we used a large sample of participants across the full range of WMC scores, Experiment 3 offered the opportunity to use more sophisticated regression analyses to quantify the independent and combined relationship of the lag lure accuracy variables with WMC. Although the zero-order correlation results of Experiment 3 indicated significant relationships between lag0 lure accuracy and WMC, the hierarchical regression analyses indicated that this was due to the variance shared with lagnon0 lure trials. That is, after accounting for the
319
common variance between the two types of lag lure trials, only lagnon0 lure accuracy contributed additional unique variance in predicting WMC. Note that these results were likely not due to differential reliabilities of the lure variables—Cronbach’s alpha for the lag0 and lagnon0 lure accuracies were .81 and .85, respectively. We interpret the overall and especially the lag lure results as consistent with the maintenance/retrieval hypothesis. As reasoned earlier, updating the current target letter within working memory is critical to successfully withhold responding when a lure letter is presented. This is common to performance on all lure trials, but only lagnon0 lures require access to that information after subsequent items and the passage of time have occurred. Thus, although accurate performance on both lag0 and lagnon0 lure trials rely on similar processes of updating and inhibition, lagnon0 trials additionally require actively maintaining that information or quickly retrieving the necessary information in order to make the correct decision to not respond. The maintenance/retrieval hypothesis predicts that individuals high in WMC are better at both aspects of working memory, and thus individual differences in WMC will manifest themselves when these processes are required.
Experiment 4 We have interpreted the combination of the lack of WMC effects on the standard go/no-go task in Experiments 1 and 2, and the pattern of significant WMC effects on the conditional go/no-go task in Experiments 2 and 3, as support for the maintenance/retrieval hypothesis and evidence against the inhibition hypothesis. Our argument rests on the assumption that the critical task manipulation was the introduction of the alternating-target rule in the conditional task. However, as pointed out by a reviewer, the frequency of targets and nontargets is also different between the standard and conditional go/no-go tasks. We chose the particular trial type frequencies for both the standard and conditional go/no-go tasks in the previous experiments to match those typically used in the literature. Given that we based the conditional go/no-go task on the task used in studies by Garavan and colleagues (Garavan et al., 1999; Nielson et al., 2002) and that we did not know what effect changing the target-to-lure proportion would have, we elected to be consistent with the methods of these researchers in Experiments 2 and 3. Although the go:no-go trial ratio in the standard tasks was the same as the target:lure trial ratio in the conditional tasks (4:1), the proportion of trials requiring a response was higher in the standard task (80% of all trials) compared with the conditional task (40% of all trials). In addition, distractors on the conditional go/no-go task are simply a type of no-go stimuli, and yet performance is near perfect on these trials in both Experiment 2 and 3. This is clearly different from the performance on standard no-go stimuli in Experiments 1 and 2. Previous research with the standard go/no-go task has shown that manipulations of trial type frequencies affect no-go accuracy and mean go RTs in standard go/no-go tasks (e.g., Jones, Cho, Nystrom, Cohen, & Braver, 2002; Manly, Robertson, Galloway, & Hawkins, 1999; Nieuwenhuis, Yeung, van den Wildenberg, & Ridderinkhof, 2003). We conducted Experiment 4 to elucidate whether the frequency of trial types or the conditional target rule was responsible for the relationship with WMC observed in Ex-
REDICK, CALVO, GAY, AND ENGLE
periments 2 and 3. High- and low-WMC individuals performed a version of the conditional go/no-go task in which the targets occurred on 80% of trials; distractors, on 10% of trials; and lures, on 10% of trials. Compared with the conditional go/no-go task in Experiments 2 and 3, the target frequency was increased, the distractor frequency was decreased, and the lure frequency was the same. The increase in response frequency expected for targets should make it more difficult to inhibit responses to lures and distractors. Most important, the target frequency was identical to the proportion of go trials in the standard go/no-go tasks in Experiments 1 and 2. The predictions were straightforward for Experiment 4. The inhibition view again predicted that the low-WMC individuals would perform worse than the high-WMC individuals on lures and maybe even distractor trials. However, this view does not predict that the groups would be different on target performance. In contrast, the maintenance/retrieval and executive attention hypotheses predict that the increase in target trials will require more updating of the current target stimulus. As such, the ability to rapidly update and maintain that target information will be critical, and thus the low-WMC group should be less accurate than the high-WMC group on targets and lures.
Method Participants. Thirty-one participants were recruited, selected, and compensated in the same manner as in Experiment 1 and 2. None of the individuals had participated in Experiment 1, 2, or 3. Demographic information about the sample is presented in Table 1. Tasks and procedure. The task and procedure for the conditional go/no-go task was very similar to the task used in Experiment 2. The critical difference was that targets occurred on 80% of trials; distractors, on 10% of trials; and lures, on 10% of trials. Design and analysis. A 2 (WMC) ⫻ 3 (trial type) design was used, with WMC (high, low) as a between-subjects factor and trial type (target, distractor, lure) as a within-subject variable.3 Signal detection analyses (d⬘ and C) were calculated on the basis of target hit rates and lure false alarm rates. Hit and false alarm rates equal to 0 or 1 were adjusted by .01. An alpha of p ⬍ .05 was used for all statistical tests; Bonferroni-corrected alpha levels for follow-up tests are reported where necessary.
Results Accuracy. The accuracy data for the conditional go/no-go task are displayed in Figure 7. As can be seen, accuracy on the distractor and lure trial types was lower than in the conditional go/no-go task used in Experiment 2 (refer to Figure 4 —note the difference in scale for the y-axis). Notably, the low-WMC group appeared to be less accurate than the high-WMC group across trial types. A 2 (WMC) ⫻ 3 (trial type) ANOVA confirmed these observations. The main effect of trial type was significant, F(2, 58) ⫽ 133.94, p ⬍ .01, 2p ⫽ .822, as was the main effect of WMC group, F(1, 29) ⫽ 7.15, p ⫽ .01, 2p ⫽ .198. The interaction was not significant, F(2, 58) ⫽ 1.19, p ⫽ .31. Follow-up t tests (␣ ⫽ .0167) indicated that the high-WMC group was more accurate on target trials, t(29) ⫽ 2.11, p ⫽ .04, and lure trials, t(29) ⫽ 2.34, p ⫽ .03,
1.00
Proportion Correct
320
High
0.80
Low
0.60 0.40 0.20 0.00
target
distractor
lure
Trial Type
Figure 7. Mean proportion correct as a function of working memory capacity group and trial type in conditional go/no-go task in Experiment 4. Error bars represent ⫾ 1 standard error.
but the WMC groups were not statistically different on distractor trials, t(29) ⫽ 1.87, p ⫽ .07. Response times. Table 5 displays the mean and variability for target RTs in the conditional go/no-go task. As in Experiment 2, the two WMC groups did not appear to differ in mean RTs, but the low-WMC group appeared to be more variable, as evidenced by a greater ISD RT. These observations were confirmed by two separate one-way ANOVAs. For mean RT, the main effect of WMC group was not significant (F ⬍ 1). For ISD RT, the main effect of WMC group was significant, F(1, 29) ⫽ 5.27, p ⫽ .03, 2p ⫽ .154. Signal detection indices. Table 5 lists the results for sensitivity (d⬘) and bias (C). The high-WMC group appears to have a larger d⬘ value, but C does not seem to differ as a function of WMC group. Two separate one-way ANOVAs on d⬘ and C confirmed these interpretations. For d⬘, the main effect of WMC group was significant, F(1, 29) ⫽ 12.23, p ⬍ .01, 2p ⫽ .297, whereas for C, the main effect of WMC group was not significant (F ⬍ 1).
Discussion Experiment 4 was motivated by the issue raised by a reviewer regarding the differences between the standard and conditional go/no-go tasks used in the previous three experiments. The goal was to determine whether WMC effects were present on the conditional go/no-go task after equating the frequency of target/go stimuli in the standard and conditional go/no-go tasks. Although accuracy was lower for both WMC groups in Experiment 4 relative to Experiment 2, the pattern of results was identical. The low-WMC group exhibited (a) lower accuracy than the high-WMC group on targets and lures, (b) more variability (but not slower RT) on correct responses to targets, and (c) less sensitivity in discriminating responses without being more biased to respond overall. The results of Experiment 4 strengthen our contention that the critical difference between the standard and conditional go/no-go 3 Although the number of total lures was the same as in Experiments 2 and 3, all lures were either lag0 (51 trials) or lag1 (nine trials) because of the increase in targets and the decrease in distractors in the current design. Because of this imbalance, and the minimal manipulation of lag, we did not include the lag lure results as was done for Experiments 2 and 3.
WORKING MEMORY CAPACITY AND GO/NO-GO
Table 5 Target Response Time (RT) and Signal Detection Theory Data in Experiment 4 for High and Low Working Memory Capacity (WMC) Groups WMC group
Mean RT (ms)
ISD RT (ms)
High Low
387 (50.0) 423 (51.8)
99 (21.5) 130 (49.8)
Note.
d⬘ (sensitivity) 2.2 (0.77) 1.3 (0.63)
C (bias) ⫺1.02 (0.18) ⫺1.01 (0.21)
ISD ⫽ individual standard deviation.
tasks is the requirement to update, maintain, and retrieve the target information across trials in the conditional go/no-go task.
General Discussion Individual differences in WMC reflect the ability to keep select information active in immediate memory in order to guide future behavior. This ability is especially important in interference-rich situations or during concurrent processing. In the studies reported here, a dissociation was obtained between two versions of a go/no-go task. Across two administrations of the standard task, no effects of WMC were observed. In contrast, performance on the conditional go/no-go task was related to individual differences in WMC in both an extreme-groups and a full-range design.
Implications for Theories of Working Memory Capacity As outlined in the introduction, there are currently several different theories of individual differences in WMC. One account is that inhibitory abilities are responsible for variation in WMC (Hasher et al., 2007). Certainly the current results suggest that inhibition is not the sole determinant of WMC, as we selected individuals high and low in WMC who should differ in inhibitory abilities, and yet no relationships were observed with performance on the standard go/no-go task, a task that these researchers have argued measures inhibition (Lustig et al., 2007). As mentioned earlier, we note that researchers have proposed separable forms of inhibition (e.g., Hasher et al., 1999), and so it is possible that performance on the standard go/no-go task reflects behavioral inhibition instead of cognitive inhibition. Viewed in this light, the lack of significant WMC differences on the standard go/no-go task is not as damaging to the inhibition account. However, as discussed after Experiment 2, whereas the worse performance of the low-WMC group on lure trials in the conditional go/no-go task can be explained via an inhibition account, the specific lag effects on lure trials, and the low-WMC groups’ impairment on target trials, are not easily accommodated. Overall, the current results serve to at least constrain the inhibition view such that only certain aspects of inhibitory ability may be related to individual differences in WMC. They also illustrate that WMC is not a “promiscuous variable” (p. 567, Ackerman, Beier, & Boyle, 2002)—recent findings have shown that individual differences in WMC are only related to performance on specific conditions of specific tasks (Kane et al., 2007; Unsworth & Engle, 2007b). These boundary conditions can help inform us about the content processes that
321
determine an individual’s score on WMC measures (Kane, Poole, Tuholski, & Engle, 2006). The lack of WMC effects on the standard go/no-go task also goes against the predictions of the executive attention account (Kane et al., 2007). On the basis of previous studies with the antisaccade and Stroop tasks, this account predicts that the lowWMC individuals would have difficulty maintaining the task goal and/or resolving the response conflict on no-go trials when a prepotent response option was competing. The results and interpretation of a recent study by McVay and Kane (2009) highlight where the executive attention account differs in relation to our standard go/no-go results.4 McVay and Kane administered different versions of a go/no-go task: (a) a perceptual version in which participants responded to words in all capital letters but withheld responses to words in lowercase letters; (b) a semantic version in which participants responded to animal words and not to food words; and (c) a perceptual–semantic version that combined the response rules. Other differences between the McVay and Kane study and the current research include the occurrence of go stimuli on 88.8% of trials, the much longer duration of the task (approximately 45 min; personal communication, M. J. Kane, April 30, 2008) and the random interspersing of questionnaires after 60% of no-go stimuli to assess the degree of mind wandering. In contrast to our results, McVay and Kane (2009) reported that both go trial RT variability (ISD) and d⬘ were significantly correlated with WMC (rs ⫽ –.35 and .29, respectively) and interpreted these results as consistent with the executive attention account. Specifically, they argued that maintaining the goal of not responding to lowercase or food words was critical to success on the task. The questionnaires, along with the correlations with ISD and d⬘, indicated that low-WMC individuals were less likely to maintain the task goal. However, the results in McVay and Kane collapsed across the three versions of the go/no-go task that were administered between subjects. In a reanalysis of the perceptual version only from the McVay and Kane (2009) data set as part of a follow-up study, the authors discovered that d⬘ did not correlate with WMC, r(81) ⫽ .18, p ⫽ .10, although the ISD of go RTs was significantly correlated, r(81) ⫽ –.33, p ⬍ .01 (personal communication, J. McVay, February 19, 2010). In a separate sample during McVay and Kane’s follow-up study, performance on the perceptual go/no-go task again was not significantly related to WMC: d⬘, r(80) ⫽ –.05, p ⫽ .67; go ISD RTs, r(80) ⫽ –.15, p ⫽ .19. When specifically examining their perceptual go/no-go task, which is most similar to the standard go/no-go task we used, the results of McVay and Kane (2009) are actually in agreement with the lack of WMC effects that we observed in Experiments 1 and 2. The pattern of WMC results on the conditional go/no-go task is consistent with the executive attention account. This is not too surprising, given that the maintenance/retrieval hypothesis is really an outgrowth of the executive attention account (Unsworth & Spillers, 2010). In many situations, the two accounts make similar predictions, and we argue that the standard go/no-go task provides an interesting distinction between the predictions of the two WMC theories. 4
We were unaware of the McVay and Kane (2009) study until after Experiments 1 and 2 were completed.
322
REDICK, CALVO, GAY, AND ENGLE
The current results are most consistent with the maintenance/ retrieval hypothesis (Unsworth & Engle, 2007b) for the many reasons outlined previously. This account would not necessarily predict a relationship between WMC and no-go performance in the standard task. In addition, the lag lure results and the ISD results on correct targets from the conditional go/no-go task follow directly from the predictions of the maintenance/retrieval account. High-WMC individuals are more likely to maintain the current target item within primary memory or if that item has been displaced from primary memory, they are still more likely to retrieve that information to respond correctly on target and lure trials. The WMC ⫻ Lag interaction on lure accuracy observed on the conditional go/no-go task indicates that when there are minimal maintenance demands, high- and low-WMC individuals perform similarly even on the most interference-rich trials. With the passage of time, the high-WMC group performance is unaffected, whereas the low-WMC group shows a decline in performance. This pattern is very similar to recent WMC results on a cuedsearch task (Poole & Kane, 2009). In that study, the high- and low-WMC groups performed similarly when the visual search array followed the cue offset by 350 ms; however, when the interval between the cue offset and array onset was 1,600 ms, only the low-WMC group showed decreased performance. In both tasks, the results indicate that low-WMC individuals have difficulty sustaining goal-relevant information across short intervals relative to high-WMC individuals. Thus, individual differences in primary memory might not just be about the number of items that can be held in an active state but could also be related to the amount of time that information can be actively maintained in a preparatory state.
Standard Versus Conditional Go/No-Go Tasks As mentioned earlier, there is no dimensional overlap on the standard go/no-go task, according to the stimulus–response compatibility taxonomy used by Kornblum et al. (1990). That is, the relevant dimension of the stimulus is the letter’s identity, and there is no irrelevant dimension or incompatibility with the response method. This aspect of the standard go/no-go task is similar to the visual search tasks used by Kane et al. (2006). In the visual search tasks, the task instructions lead to similar, consistently mapped response rules as the standard go/no-go task (e.g., if F is present, “yes” response; if F is not present, “no” response). Similar to the current results with the standard go/no-go task, Kane et al. (2006) showed that WMC was not significantly related to visual search performance. The perceptual version of the go/no-go task from McVay and Kane (2009), which was not related to WMC, also does not have dimensional overlap— the irrelevant dimension (the semantic meaning of the word) was not incompatible with the response mapping, and stimuli could easily be classified as go and no-go stimuli (uppercase vs. lowercase words, respectively). In contrast, the conditional go/no-go task includes certain stimuli that do not have dimensional overlap (distractors), whereas other letter stimuli are sometimes associated with a response (target trials) and other times with withholding a response (lure trials). The Stroop, flanker, and antisaccade tasks described previously also contain some form of dimensional overlap, and lowWMC individuals perform worse on the specific conditions within
these tasks where the incompatibility or irrelevant dimension is present. In addition, the semantic version of the go/no-go task in McVay and Kane (2009), which exhibits strong relationships with WMC, contained word stimuli that were not classifiable on the basis of physical features. Certainly no task is process pure, and although we have asserted that the standard go/no-go task reflects inhibitory functioning, other researchers have used similar tasks to measure sustained attention or vigilance. For example, the go/no-go tasks used by McVay and Kane (2009) took 45 min to complete. They found that WMC was significantly related to mind wandering during task performance, which certainly supports the claim that their longer go/no-go task had a vigilance component. However, McVay and Kane’s reanalysis and unpublished data indicate that WMC was not important for performance even on a long version (1,810 trials) of the standard go/no-go task. In contrast, the WMC differences were apparent on the conditional go/no-go task within the first 3 min of task performance. We reanalyzed the Block 1 data only from Experiment 2, which were the first 200 trials. All significant effects found across all three blocks were observed in the first block.5 Thus, although time on task may be important for some aspects of go/no-go task performance (such as mind wandering), it does not appear to be critical to the WMC relationship with task performance. Garavan et al. (1999) observed a right-lateralized “distributed network underlying response inhibition” (p. 8304) based on lurerelated activity during the conditional go/no-go task. This network included inferior frontal gyrus, medial frontal gyrus, insula, and inferior parietal lobule. Simmonds, Pekar, and Mostofsky (2008) conducted a recent fMRI meta-analysis comparing the activity observed in standard and conditional go/no-go tasks, which they labeled simple and complex, respectively. Both simple and complex go/no-go tasks exhibited overlapping activity in presupplementary motor area, likely attributable to common inhibitory processes. Critically, Simmonds et al. (2008) noted that “analyses of the ‘simple’ and ‘complex’ studies demonstrated distinct patterns of concurrence, with a right-lateralized prefrontal (BA 9/44)/ parietal (BA 40) network seen only in the analysis of the complex tasks” (p. 228). Thus, only the category of tasks in which updating, 5
The results for the reanalysis of Block 1 from the conditional go/no-go task in Experiment 2 were as follows. We conducted a 2 (WMC) ⫻ 3 (trial type) analysis of variance (ANOVA) on the accuracy data and observed that the significant main effects of trial type, F(2, 80) ⫽ 89.19, p ⬍ .01, 2p ⫽ .69, and WMC, F(1, 40) ⫽ 12.29, p ⬍ .01, 2p ⫽ .24, were qualified by a significant WMC ⫻ Trial Type interaction, F(2, 80) ⫽ 9.92, p ⬍ .01, 2p ⫽ .20. Follow-up independent-samples t tests indicated that the high-WMC group was statistically more accurate on target trials, t(40) ⫽ 2.22, p ⫽ .03, and on lure trials, t(40) ⫽ 3.34, p ⬍ .01, but not on distractor trials, t(40) ⫽ 1.57, p ⫽ .12. A 2 (WMC) ⫻ 2 (lag) ANOVA on the lure accuracy data revealed significant main effects of lag, F(1, 40) ⫽ 20.63, p ⬍ .01, 2p ⫽ .34, and WMC, F(1, 40) ⫽ 10.28, p ⬍ .01, 2p ⫽ .20, but both were qualified by a significant WMC ⫻ Lag interaction, F(1, 40) ⫽ 20.20, p ⬍ .01, 2p ⫽ .34. Follow-up independent-samples t tests indicated that the high-WMC group was significantly more accurate on lagnon0 lure trials, t(40) ⫽ 4.38, p ⬍ .01, but the WMC groups did not differ in lag0 lure accuracy, t(40) ⫽ 0.46, p ⫽ .65. Finally, independent-samples t tests indicated that although the WMC groups did not differ in mean RT to target trials, t(40) ⫽ 1.29, p ⫽ .21, the low-WMC group was more variable in RT to targets, indicated by a higher ISD, t(40) ⫽ 2.23, p ⫽ .03.
WORKING MEMORY CAPACITY AND GO/NO-GO
maintaining, and retrieving information in and out of working memory was critical to successful performance activated these specific prefrontal and parietal regions.
Conclusion The current research provides further clarification about various theories of individual differences in WMC. We observed that individual differences in WMC are not important in all interference-rich situations and are not involved in all tasks where response conflict is present. However, the ability to rapidly update information within working memory, maintain this information in active memory to guide future behavior, and retrieve this information from inactive memory as needed, are all critical aspects of individual differences in WMC. These results provide strong support for the maintenance/retrieval account of individual differences in WMC (Unsworth & Engle, 2007b).
References Ackerman, P. L., Beier, M. E., & Boyle, M. O. (2002). Individual differences in working memory within a nomological network of cognitive and perceptual speed abilities. Journal of Experimental Psychology: General, 131, 567–589. doi:10.1037/0096-3445.131.4.567 Baddeley, A. (2000). The episodic buffer: A new component of working memory? Trends in Cognitive Sciences, 4, 417– 423. doi:10.1016/ S1364-6613(00)01538-2 Baddeley, A. D., & Hitch, G. (1974). Working memory. In G. A. Bower (Ed.), The psychology of learning and motivation (Vol. 8, pp. 47– 89). New York, NY: Academic Press. doi:10.1016/S0079-7421(08)60452-1 Baddeley, A. D. (1996). Exploring the central executive. Quarterly Journal of Experimental Psychology, 49A, 5–28. Barrouillet, P., Bernardin, S., & Camos, V. (2004). Time constraints and resource sharing in adults’ working memory spans. Journal of Experimental Psychology: General, 133, 83–100. doi:10.1037/00963445.133.1.83 Broadway, J. M., & Engle, R. W. (2010). Validating running memory span: Measurement of working memory capacity and links with fluid intelligence. Behavior Research Methods, 42, 563–570. doi:10.3758/ BRM.42.2.563 Campbell, J. I. D., & Arbuthnott, K. D. (1996). Inhibitory processes in sequential retrieval: Evidence from variable-lag repetition priming. Brain and Cognition, 30, 59 – 80. doi:10.1006/brcg.1996.0005 Conway, A. R. A., Kane, M. J., Bunting, M. F., Hambrick, D. Z., Wilhelm, O., & Engle, R. W. (2005). Working memory span tasks: A methodological review and user’s guide. Psychonomic Bulletin & Review, 12, 769 –786. Craik, F. I. (1971). Primary memory. British Medical Bulletin, 27, 232– 236. Daneman, M., & Carpenter, P. A. (1980). Individual differences in working memory and reading. Journal of Verbal Learning and Verbal Behavior, 19, 450 – 466. doi:10.1016/S0022-5371(80)90312-6 Engle, R. W., & Kane, M. J. (2004). Executive attention, working memory capacity, and a two-factor theory of cognitive control. In B. Ross (Ed.), The psychology of learning and motivation (Vol. 44, pp. 145–199). New York, NY: Elsevier. doi:10.1016/S0079-7421(03)44005-X Friedman, N. P., & Miyake, A. (2004). The relations among inhibition and interference control function: A latent-variable analysis. Journal of Experimental Psychology: General, 133, 101–135. doi:10.1037/00963445.133.1.101 Friedman, N. P., Miyake, A., Corley, R. P., Young, S. E., DeFries, J. C., & Hewitt, J. K. (2006). Not all executive functions are related to
323
intelligence. Psychological Science, 17, 172–179. doi:10.1111/j.14679280.2006.01681.x Garavan, H., Ross, T. J., & Stein, E. A. (1999). Right hemispheric dominance of inhibitory control: An event-related functional MRI study. Proceedings of the National Academy of Sciences USA, 96, 8301– 8306. doi:10.1073/pnas.96.14.8301 Harnishfeger, K. K. (1995). The development of cognitive inhibition: Theories, definitions, and research evidence. In F. N. Dempster & C. J. Brainerd (Eds.), Interference and inhibition in cognition (pp. 175–204). San Diego, CA: Academic Press. doi:10.1016/B978-012208930-5/ 50007-6 Hasher, L., Lustig, C., & Zacks, R. T. (2007). Inhibitory mechanisms and the control of attention. In A. R. A. Conway, C. Jarrold, M. J. Kane, A. Miyake, & J. N. Towse (Eds.), Variation in working memory (pp. 227–249). New York, NY: Oxford University Press. Hasher, L., & Zacks, R. T. (1988). Working memory, comprehension, and aging: A review and a new view. In G. H. Bower (Ed.), The psychology of learning and motivation (Vol. 22, 193–225). New York, NY: Academic Press. Hasher, L., Zacks, R. T., & May, C. P. (1999). Inhibitory control, circadian arousal, and age. In D. Gopher & A. Koriat (Eds.), Attention and performance XVII: Cognitive regulation of performance—Interaction of theory and application (pp. 653– 675). Cambridge, MA: MIT Press. Heitz, R. P., & Engle, R. W. (2007). Focusing the spotlight: Individual differences in visual attention control. Journal of Experimental Psychology: General, 136, 217–240. doi:10.1037/0096-3445.136.2.217 Jones, A. D., Cho, R., Nystrom, L. E., Cohen, J. D., & Braver, T. S. (2002). A computational model of anterior cingulate function in speeded response tasks: Effects of frequency, sequence, and conflict. Cognitive, Affective, and Behavioral Neuroscience, 2, 300 –317. doi:10.3758/ CABN.2.4.300 Kane, M. J., Bleckley, M. K., Conway, A. R. A., & Engle, R. W. (2001). A controlled-attention view of working memory capacity. Journal of Experimental Psychology: General, 130, 169 –183. doi:10.1037/00963445.130.2.169 Kane, M. J., Conway, A. R. A., Hambrick, D. Z., & Engle, R. W. (2007). Variation in working memory capacity as variation in executive attention and control. In A. R. A. Conway, C. Jarrold, M. J. Kane, A. Miyake, & J. N. Towse (Eds.), Variation in working memory (pp. 21– 48). New York, NY: Oxford University Press. Kane, M. J., & Engle, R. W. (2003). Working-memory capacity and the control of attention: The contributions of goal neglect, response competition, and task set to Stroop interference. Journal of Experimental Psychology: General, 132, 47–70. doi:10.1037/0096-3445.132.1.47 Kane, M. J., Poole, B. J., Tuholski, S. W., & Engle, R. W. (2006). Working memory capacity and the top-down control of visual search: Exploring the boundaries of ‘executive attention.’ Journal of Experimental Psychology: Learning, Memory, and Cognition, 32, 749 –777. doi:10.1037/ 0278-7393.32.4.749 Kornblum, S., Hasbroucq, T., & Osman, A. (1990). Dimensional overlap: Cognitive basis for stimulus–response compatibility—A model and taxonomy. Psychological Review, 97, 253–270. doi:10.1037/0033295X.97.2.253 Langenecker, S. A., & Nielson, K. A. (2003). Frontal recruitment during response inhibition in older adults replicated with fMRI. NeuroImage, 20, 1384 –1392. doi:10.1016/S1053-8119(03)00372-0 Long, D. L., & Prat, C. S. (2002). Working memory and Stroop interference: An individual differences investigation. Memory & Cognition, 30, 294 –301. Lustig, C., Hasher, L., & May, C. P. (2001). Working memory span and the role of proactive interference. Journal of Experimental Psychology: General, 130, 199 –207. doi:10.1037/0096-3445.130.2.199 Lustig, C., Hasher, L., & Zacks, R. T. (2007). Inhibitory deficit theory: Recent developments in a “new view.” In D. S. Gorfein & C. M.
324
REDICK, CALVO, GAY, AND ENGLE
MacLeod (Eds.), Inhibition in cognition (pp. 145–162). Washington, DC: American Psychological Association. doi:10.1037/11587-008 Manly, T., Robertson, I. H., Galloway, M., & Hawkins, K. (1999). The absent mind: Further investigations of sustained attention to response. Neuropsychologia, 37, 661– 670. doi:10.1016/S0028-3932(98)00127-4 May, C. P., Hasher, L., & Kane, M. J. (1999). The role of interference in memory span. Memory & Cognition, 27, 759 –767. McVay, J. C., & Kane, M. J. (2009). Conducting the train of thought: Working memory capacity, goal neglect, and mind wandering in an executive-control task. Journal of Experimental Psychology: Learning, Memory, and Cognition, 35, 196 –204. doi:10.1037/a0014104 Miyake, A., Friedman, N. P., Emerson, M. J., Witzki, A. H., Howerter, A., & Wager, T. D. (2000). The unity and diversity of executive functions and their contributions to complex “frontal lobe” tasks: A latent variable analysis. Cognitive Psychology, 41, 49 –100. doi:10.1006/ cogp.1999.0734 Nielson, K. A., Langenecker, S. A., & Garavan, H. (2002). Differences in the functional neuroanatomy of inhibitory control across the adult life span. Psychology and Aging, 17, 56 –71. doi:10.1037/0882-7974.17.1.56 Nieuwenhuis, S., Yeung, N., van den Wildenberg, W., & Ridderinkhof, K. R. (2003). Electrophysiological correlates of anterior cingulated function in a go/no-go task: Effects of response conflict and trial type frequency. Cognitive, Affective, & Behavioral Neuroscience, 3, 17–26. doi:10.3758/CABN.3.1.17 Nigg, J. T. (2000). On inhibition/disinhibition in developmental psychopathology: Views from cognitive and personality psychology and a working inhibition taxonomy. Psychological Bulletin, 126, 220 –246. doi:10.1037/0033-2909.126.2.220 Nigg, J. T. (2001). Is ADHD a disinhibitory disorder? Psychological Bulletin, 127, 571–598. doi:10.1037/0033-2909.127.5.571 Pollack, I., Johnson, L. B., & Knaff, P. R. (1959). Running memory span. Journal of Experimental Psychology, 57, 137–146. doi:10.1037/ h0046137 Poole, B. J., & Kane, M. J. (2009). Working-memory capacity predicts the executive control of visual search among distractors: The influences of sustained and selective attention. Quarterly Journal of Experimental Psychology, 62, 1430 –1454. doi:10.1080/17470210802479329 Preacher, K. J., Rucker, D. D., MacCallum, R. C., & Nicewander, W. A. (2005). Use of the extreme-groups approach: A critical reexamination and new recommendations. Psychological Methods, 10, 178 –192. doi: 10.1037/1082-989X.10.2.178 Raaijmakers, J. G., & Shiffrin, R. M. (1981). Search of associative memory. Psychological Review, 88, 93–134. doi:10.1037/0033-295X.88.2.93 Redick, T. S., & Engle, R. W. (2006). Working memory capacity and Attention Network Test performance. Applied Cognitive Psychology, 20, 713–721. Redick, T. S., Heitz, R. P., & Engle, R. W. (2007). Working memory capacity and inhibition: Cognitive and social consequences. In D. S. Gorfein & C. M. MacLeod (Eds.), Inhibition in cognition (pp. 125–142). Washington, DC: American Psychological Association. doi:10.1037/ 11587-007 Rush, B. K., Barch, D. M., & Braver, T. S. (2006). Accounting for cognitive aging: Context processing, inhibition or processing speed? Aging, Neuropsychology, and Cognition, 13, 588 – 610. Schneider, W., & Shiffrin, R. M. (1977). Controlled and automatic human
information processing: I. Detection, search, and attention. Psychological Review, 84, 1– 66. doi:10.1037/0033-295X.84.1.1 Simmonds, D. J., Pekar, J. J., & Mostofsky, S. H. (2008). Meta-analysis of go/no-go tasks demonstrating that fMRI activation associated with response inhibition is task-dependent. Neuropsychologia, 46, 224 –232. doi:10.1016/j.neuropsychologia.2007.07.015 Thorell, L. B., Lindqvist, S., Nutley, S. B., Bohlin, G., & Klingberg, T. (2009). Training and transfer effects of executive functions in preschool children. Developmental Science, 12, 106 –113. doi:10.1111/j.14677687.2008.00745.x Towse, J. N., Hitch, G. J., & Hutton, U. (2000). On the interpretation of working memory span in adults. Memory & Cognition, 28, 341–348. Unsworth, N. (2007). Individual differences in working memory capacity and episodic retrieval: Examining the dynamics of delayed and continuous distractor free recall. Journal of Experimental Psychology: Learning, Memory, and Cognition, 33, 1020 –1034. doi:10.1037/02787393.33.6.1020 Unsworth, N., & Engle, R. W. (2007a). On the division of short-term and working memory: An examination of simple and complex spans and their relation to higher order abilities. Psychological Bulletin, 133, 1038 –1066. doi:10.1037/0033-2909.133.6.1038 Unsworth, N., & Engle, R. W. (2007b). The nature of individual differences in working memory capacity: Active maintenance in primary memory and controlled search from secondary memory. Psychological Review, 114, 104 –132. doi:10.1037/0033-295X.114.1.104 Unsworth, N., & Engle, R. W. (2008). Speed and accuracy of accessing information in working memory: An individual differences investigation of focus switching. Journal of Experimental Psychology: Learning, Memory, and Cognition, 34, 616 – 630. doi:10.1037/0278-7393.34.3.616 Unsworth, N., Heitz, R. P., Schrock, J. C., & Engle, R. W. (2005). An automated version of the operation span task. Behavior Research Methods, Instruments, & Computers, 37, 498 –505. Unsworth, N., Redick, T. S., Heitz, R. P., Broadway, J. M., & Engle, R. W. (2009). Complex working memory span tasks and higher-order cognition: A latent-variable analysis of the relationship between processing and storage. Memory, 17, 635– 654. doi:10.1080/09658210902998047 Unsworth, N., Schrock, J. C., & Engle, R. W. (2004). Working memory capacity and the antisaccade task: Individual differences in voluntary saccade control. Journal of Experimental Psychology: Learning, Memory, and Cognition, 30, 1302–1321. doi:10.1037/0278-7393.30.6.1302 Unsworth, N., & Spillers, G. J. (2010). Variation in working memory capacity and episodic recall: The contributions of strategic encoding and contextual-retrieval. Psychonomic Bulletin & Review, 17, 200 –205. doi:10.3758/PBR.17.2.200 Wager, T. D., Sylvester, C. Y., Lacey, S. C., Nee, D. E., Franklin, M., & Jonides, J. (2005). Common and unique components of response inhibition revealed by fMRI. NeuroImage, 27, 323–340. doi:10.1016/ j.neuroimage.2005.01.054 Waugh, N. C., & Norman, D. (1965). Primary memory. Psychological Review, 72, 89 –104. doi:10.1037/h0021797
Received May 29, 2009 Revision received September 3, 2010 Accepted October 11, 2010 䡲