Avatars in a simulated tabletop workspace (mockup). ...... where single-user applications were converted to allow input from multiple ...... by looking at the WWW page http://www.cpsc.ucalgary.ca/~gutwin/research/results.html after May 31,.
Workspace Awareness in Real-Time Distributed Groupware by Carl Gutwin
A DISSERTATION SUBMITTED TO THE FACULTY OF GRADUATE STUDIES IN PARTIAL FULFILLMENT OF THE REQUIREMENTS FOR THE DEGREE OF DOCTOR OF PHILOSOPHY
DEPARTMENT OF COMPUTER SCIENCE
CALGARY, ALBERTA DECEMBER, 1997 ©Carl Gutwin 1997
THE UNIVERSITY OF CALGARY FACULTY OF GRADUATE STUDIES The undersigned certify that they have read, and recommend to the Faculty of Graduate Studies for acceptance, a dissertation entitled "Workspace Awareness in Real-Time Distributed Groupware" submitted by Carl Gutwin in partial fulfillment of the requirements for the degree of Doctor of Philosophy.
__________________________________________ Supervisor, Saul Greenberg Department of Computer Science
__________________________________________ Jeff Caird Department of Psychology
__________________________________________ Brian Gaines Department of Computer Science
__________________________________________ Theresa Kline Department of Psychology
__________________________________________ External Examiner, Sarah Douglas University of Oregon _____________________ Date
ii
Abstract Real-time distributed groupware systems are computer applications that allow people to work together at the same time, but from different places. These systems provide shared computational workspaces, akin to tabletops and whiteboards, where collaborators can manipulate work artifacts. Unfortunately, when compared with working face-to-face, collaboration through groupware seems clumsy, stilted, and artificial. One of the problems with current groupware systems is that they make it difficult for people to stay aware of one another. Awareness is taken for granted in everyday face-to-face environments, but when the setting changes to distributed groupware, many of the normal cues and information sources that people use to maintain awareness are gone. Helping people maintain awareness of one another can improve the usability of groupware. In this research, I explore one kind of awareness called workspace awareness, and investigate techniques for supporting it in groupware interfaces. Workspace awareness is the up-to-the-moment understanding of another person’s interaction with a shared workspace; it involves knowledge about such things as who is in the workspace, where they are working, and what they are doing. I investigate the use of workspace awareness in improving groupware usability by following a three-part process: operationalize the concept, apply it to the design of groupware interfaces, and evaluate the usability of resulting systems. I operationalize workspace awareness using a conceptual framework and an analysis of the problems posed by current groupware systems. First, I construct a conceptual framework of workspace awareness that sets out the elements of knowledge that people track, the process by which they maintain awareness, and collaborative activities in which workspace awareness is useful. Second, I identify issues encountered in supporting workspace awareness in real-time distributed groupware, and describe the tasks that a
iii
designer must undertake—collecting, distributing, and displaying information—in order to support workspace awareness in a groupware system. I apply this knowledge about workspace awareness to the design and construction of several example awareness displays. I concentrate on techniques that answer who, what, and where questions, and on approaches that provide awareness information in the context of the workspace. I also consider displays that show unseen parts of the workspace, and look specifically at one of these displays called the radar view. I evaluate the effects of supporting workspace awareness in groupware in two studies: an exploratory usability study, and a controlled experiment. The usability study showed that awareness information is valuable in a realistic groupware system, and provided design feedback for improving the awareness displays. The primary results of the experiment are that information about others’ locations and activities can significantly improve completion times and verbal efficiency for some types of tasks. Both studies also showed that participants greatly preferred systems where additional workspace awareness information was available. These results imply that supporting workspace awareness can improve groupware usability, and that groupware developers should change the way that they design multi-user systems. This research provides them with tools to effect that change.
iv
Publications from this dissertation Material, ideas, and figures from this dissertation have appeared previously in the following peer-reviewed publications. The following list shows long papers, short papers, and videotapes. After each reference, I note the chapters from which material is used.
Long papers: Gutwin, C. and Greenberg, S. (1998) Effects of Awareness Support on Groupware Usability. To appear in Proceedings of the Conference on Human Factors in Computing Systems (CHI’98). April 1998, Los Angeles, ACM Press, to appear. (Chapter 9) Gutwin, C., Roseman, M. and Greenberg, S. (1996) A Usability Study of Awareness Widgets in a Shared Workspace Groupware System. Proceedings of the Conference on Computer Supported Cooperative Work (CSCW'96). October 1996, Boston, ACM Press, 258-267. (Chapter 8) Gutwin, C., Greenberg, S. and Roseman, M. (1996). Workspace Awareness in Real-Time Distributed Groupware: Framework, Widgets, and Evaluation. People and Computers XI (Proceedings of BCSHCI'96), Eds. A. Sasse and R. Cunningham. August 1996, London, Springer-Verlag, 281-298. (Chapters 3, 5, & 8) Greenberg, S., Gutwin, C. and Cockburn, A. (1996) Using Distortion-Oriented Displays to Support Workspace Awareness. People and Computers XI (Proceedings of BCSHCI'96), Eds. A. Sasse, R.J. Cunningham, and R. Winder. August 1996, London, Springer-Verlag, 299-314. (Chapter 5) Greenberg, S., Gutwin, C., and Roseman, M. (1996). Semantic Telepointers for Groupware. Proceedings of the Sixth Australian Conference on Computer-Human Interaction (OzCHI’96). October 1996, Hamilton NZ, IEEE Press, 54-61. (Chapter 5) Greenberg, S. and Gutwin, C. (1996). Sharing Fisheye Views in Relaxed-WYSIWIS Groupware Applications. Proceedings of the Conference on Graphics Interface (GI’96). June 1996, Toronto, 28-38. (Chapter 5) Gutwin, C., Stark, G. and Greenberg, S. (1995). Support for Workspace Awareness in Educational Groupware. Proceedings of the Conference on Computer Supported Collaborative Learning (CSCL’95). October 1995, Bloomington Indiana, 147156. (Chapters 3 & 5)
v
Short papers: Gutwin, C., and Greenberg, S. (1996) Workspace Awareness for Groupware (Short paper). Conference Companion of the Conference on Human Factors in Computing Systems (CHI’96). March 1996, Vancouver, ACM Press, 208-209. (Chapters 3 & 4).
Short papers (cont’d): Gutwin, C., Greenberg, S., and Roseman, M. (1996). Workspace Awareness Support With Radar Views (Short paper). Conference Companion of the Conference on Human Factors in Computing Systems (CHI’96). March 1996, Vancouver, ACM Press, 210-211. (Chapter 6) Gutwin, C., and Roseman, M. (1996) A Usability Study of Workspace Awareness Widgets (Short paper). Conference Companion of the Conference on Human Factors in Computing Systems (CHI’96). March 1996, Vancouver, ACM Press, 214-215. (Chapter 8)
Videotapes: Gutwin, C., Greenberg, S., and Roseman, M. (1996). Supporting Workspace Awareness in Groupware (Videotape). Video Proceedings of the ACM Conference on Computer Supported Cooperative Work (CSCW'96). October 1996, Boston, ACM Press. (Chapters 5 & 6) Greenberg, S., Gutwin, C., and Cockburn, A. (1996). Applying Distortion-Oriented Displays to Groupware (Videotape). Video Proceedings of the ACM Conference on Computer Supported Cooperative Work (CSCW'96). October 1996, Boston, ACM Press. (Chapter 5)
vi
Technical acknowledgments Some of the awareness displays shown in Chapter 5 were developed in collaboration with other researchers, or were based on devices built by colleagues. It is often impossible to state the exact amount of each person’s contribution or the exact evolution of the design. However, the following notes provide some indication of involvement for each display that was not designed and built solely by me. 1. Early versions of the radar view (Chapter 6) were built in collaboration with Mark Roseman. Design features such as object movement, view rectangles, and telepointers were thought of jointly, although these features were all first introduced earlier in (Smith et al 1989). The design and development of later versions of the radar (versions 3 and 4) are solely my own work. 2. The transparent radar view was my idea, but much of the work was done by Donald Cox and Jase Chugh. 3. The overloaded telepointers were designed by Saul Greenberg for (Greenberg and Gutwin 1996); I implemented the ‘portrait cursor’ in GroupKit. 4. The DragMag overview is a refinement of Andy Cockburn’s “offset lens” system described in (Greenberg, Gutwin, and Cockburn 1995). 5. The analysis of verbal efficiency in Chapter 9 was carried out with the assistance of Jase Chugh and Krista McIntosh.
vii
Table of Contents Approval Page ..................................................................................................................... ii Abstract ..............................................................................................................................iii Publications from this dissertation ...................................................................................... v Technical acknowledgements............................................................................................ vii Table of Contents .............................................................................................................viii List of Tables.................................................................................................................... xvi List of Figures ................................................................................................................. xvii Chapter 1
Introduction.................................................................................................... 1
1.1 Setting the scene..................................................................................................... 2 1.2 Problem statement and research hypothesis........................................................... 5 1.3 Contributions of the research ................................................................................. 7 1.4 Overview of the dissertation .................................................................................. 8 Chapter 2
Foundations ................................................................................................. 11
2.1 Awareness ............................................................................................................ 11 2.2 Situation awareness.............................................................................................. 13 2.2.1 Maintaining awareness: product and process............................................. 15 2.2.2 Cognitive aspects of situation awareness................................................... 16 Attention ...................................................................................................... 16 Memory........................................................................................................ 18 2.2.3 Awareness and automaticity ...................................................................... 18 2.2.4 Summary of situation awareness................................................................ 19 2.3 Awareness of others in collaboration................................................................... 20 2.3.1 Informal awareness .................................................................................... 21 2.3.2 Conversational awareness.......................................................................... 22 2.3.3 Structural awareness .................................................................................. 24 2.4 Shared workspaces ............................................................................................... 25 viii
2.4.1 What is a shared workspace? ..................................................................... 25 2.4.2 Properties of shared workspaces ................................................................ 27 2.4.3 Tasks in shared workspaces ....................................................................... 28 2.5 Summary .............................................................................................................. 31 Chapter 3
Workspace Awareness................................................................................. 33
3.1 Workspace awareness as situation awareness...................................................... 34 3.2 Observational studies ........................................................................................... 38 3.3 Framework part 1: Elements of knowledge ......................................................... 40 3.4 Framework part 2: Process of maintaining WA................................................... 42 3.4.1 Gather perceptual information from the environment ............................... 43 Bodies and consequential communication................................................... 43 Artifacts and feedthrough ............................................................................ 44 Conversation, gesture, and intentional communication............................... 45 3.4.2 Make sense of perceptual information....................................................... 46 3.4.3 Determine what to look for next ................................................................ 48 3.5 Framework part 3: Uses of workspace awareness ............................................... 50 3.5.1 Simplification of communication .............................................................. 50 3.5.2 Coordination .............................................................................................. 54 3.5.3 Anticipation ............................................................................................... 55 3.5.4 Assistance .................................................................................................. 56 3.5.5 Management of coupling ........................................................................... 57 3.6 Summary of the conceptual framework ............................................................... 58 Chapter 4
Supporting WA in groupware...................................................................... 61
4.1 The groupware problem ....................................................................................... 62 4.1.1 Groupware reduces perception of the workspace ...................................... 63 4.1.2 Groupware limits the expressivity of bodies ............................................. 66 4.1.3 Groupware limits the expressivity of artifacts ........................................... 68 4.2 An example of awareness management in groupware ......................................... 69 4.2.1 GroupKit architecture ................................................................................ 69 4.2.2 Management of awareness information ..................................................... 70 ix
4.3 A general approach: the synthetic information landscape.................................... 72 4.4 Collection ............................................................................................................. 72 4.4.1 Sources for general workspace awareness information ............................. 73 4.4.2 Sources of task-specific awareness information ........................................ 74 4.4.3 Effects of different collection methods...................................................... 75 4.5 Distribution .......................................................................................................... 76 4.6 Display ................................................................................................................. 77 4.6.1 Dimensions of display space...................................................................... 78 4.6.2 Supporting the perception-action cycle in display..................................... 80 Gathering perceptual information from the interface .................................. 80 Interpreting perceptual information ............................................................. 81 Further exploration of the interface ............................................................. 83 4.7 Summary .............................................................................................................. 83 Chapter 5
Workspace awareness displays .................................................................... 85
5.1 Situated techniques .............................................................................................. 88 5.1.1 Embodiment............................................................................................... 88 Telepointers ................................................................................................. 89 Viewports and view rectangles .................................................................... 91 Avatars......................................................................................................... 93 Video embodiment ...................................................................................... 95 Summary—embodiment.............................................................................. 96 5.1.2 Making actions perceivable ....................................................................... 98 Action feedthrough ...................................................................................... 98 Process feedthrough..................................................................................... 99 Action indicators and animations .............................................................. 100 Summary—making actions perceivable .................................................... 102 5.1.3 Making artifacts more expressive ............................................................ 103 Expressing information about in-use artifacts ........................................... 104 Expressing information about authorship.................................................. 105 Expressing information about the past ...................................................... 106 x
Expressing information through sound cues.............................................. 107 Summary—expressive artifacts ................................................................. 110 5.2 Techniques for workspace visibility .................................................................. 111 5.2.1 Overviews ................................................................................................ 112 5.2.2 Detail views ............................................................................................. 116 5.2.3 Focus+context views................................................................................ 118 5.2.4 Summary of visibility techniques ............................................................ 122 5.3 Separate and symbolic techniques...................................................................... 123 5.3.1 Basic WA information ............................................................................. 123 5.3.2 Arbitrary relationships ............................................................................. 125 5.4 Chapter summary ............................................................................................... 127 Chapter 6
The evolution of the radar view................................................................. 128
6.1 Inspirations and roots ......................................................................................... 128 6.2 Radar view version 1.......................................................................................... 133 6.3 Radar view version 2.......................................................................................... 135 6.4 Radar view version 3.......................................................................................... 137 6.5 Radar view version 4.......................................................................................... 140 6.6 Summary ............................................................................................................ 143 Chapter 7
Evaluation methodology............................................................................ 145
7.1 Evaluation goals ................................................................................................. 145 7.2 Methodological approach................................................................................... 146 7.2.1 Background .............................................................................................. 146 7.2.2 Methods for research on workspace awareness ....................................... 149 7.3 Improving groupware usability .......................................................................... 150 7.4 Measuring groupware usability.......................................................................... 152 7.5 Study overviews ................................................................................................. 154 Chapter 8
A Usability Study....................................................................................... 156
8.1 Goals of the study............................................................................................... 156 8.2 Methodology ...................................................................................................... 157 8.2.1 Participants............................................................................................... 158 xi
8.2.2 Physical setup........................................................................................... 159 8.2.3 Groupware system.................................................................................... 159 8.2.4 Awareness displays .................................................................................. 160 8.2.5 Task.......................................................................................................... 162 8.2.6 Procedure ................................................................................................. 163 8.2.7 System configurations.............................................................................. 163 8.2.8 Data collection ......................................................................................... 164 8.3 Results and interpretation................................................................................... 164 8.3.1 General observations................................................................................ 165 8.3.2 Amount and type of use ........................................................................... 166 8.3.3 Information presented .............................................................................. 166 8.3.4 Ease of interpretation ............................................................................... 167 8.3.5 Effects on individual work, collaboration, and product........................... 168 8.3.6 Perceived value ........................................................................................ 169 8.4 Discussion .......................................................................................................... 170 8.4.1 Underlying issues..................................................................................... 170 8.4.2 Comparison to previous work.................................................................. 171 8.4.3 Critical reflection ..................................................................................... 172 8.5 Summary ............................................................................................................ 173 Chapter 9
A laboratory experiment ............................................................................ 175
9.1 Method ............................................................................................................... 176 9.1.1 Groupware system and experimental conditions ..................................... 177 9.1.2 Tasks ........................................................................................................ 179 9.1.3 Study design............................................................................................. 183 9.1.4 Measures of groupware usability ............................................................. 184 9.1.5 Participants............................................................................................... 186 9.1.6 Procedure ................................................................................................. 187 9.1.7 Data Collection ........................................................................................ 188 9.1.8 Physical setup........................................................................................... 189 9.2 Results................................................................................................................ 190 xii
9.2.1 Data usage and corrections ...................................................................... 190 9.2.2 Completion time ...................................................................................... 191 9.2.3 Communication efficiency....................................................................... 192 9.2.4 Perceived effort........................................................................................ 194 9.2.5 Preferences............................................................................................... 196 9.2.6 Strategy use .............................................................................................. 196 9.2.7 Within-participants exploratory results.................................................... 200 Completion time differential ..................................................................... 200 Perceived effort differential ....................................................................... 201 9.2.8 Summary of results .................................................................................. 202 9.3 Discussion .......................................................................................................... 203 9.3.1 Visual vs. verbal communication............................................................. 203 Visual information and strategy in the Follow task................................... 203 Visual information and strategy in the Direct task .................................... 206 9.3.2 Continuous feedback and feedthrough..................................................... 208 9.3.3 Perceived effort........................................................................................ 210 9.3.4 Explaining the copy task .......................................................................... 210 9.4 Validity and reliability issues............................................................................. 211 9.4.1 Reliability and validity of measurements................................................. 211 9.4.2 Validity of inferences............................................................................... 213 Internal validity.......................................................................................... 213 External validity......................................................................................... 214 9.5 Assessment of methods...................................................................................... 216 9.5.1 Performance measures ............................................................................. 216 9.5.2 Process measures ..................................................................................... 216 9.6 Lessons for groupware designers ....................................................................... 218 9.7 Summary ............................................................................................................ 219 Chapter 10
Connections............................................................................................. 220
10.1 The role of workspace awareness in groupware usability................................ 220 10.2 Redundancy and robustness ............................................................................. 222 xiii
10.3 Workspace awareness and rich interaction ...................................................... 224 10.4 Design for individuals, design for groups ........................................................ 227 10.5 Summary .......................................................................................................... 229 Chapter 11
Conclusion............................................................................................... 231
11.1 Research objectives and summary ................................................................... 231 11.2 Progress on objectives...................................................................................... 234 11.3 Main contributions ........................................................................................... 236 11.4 Minor contributions.......................................................................................... 237 11.5 Extending the findings ..................................................................................... 238 11.5.1 The experimental results ........................................................................ 238 11.5.2 The research process .............................................................................. 239 11.5.3 Lessons for practitioners ........................................................................ 240 11.6 Future work ...................................................................................................... 240 11.6.1 Further exploration of workspace awareness......................................... 241 11.6.2 Groupware usability............................................................................... 242 11.6.3 Toolkit-level facilities for supporting awareness................................... 243 11.6.4 Awareness and privacy .......................................................................... 245 11.7 Conclusion ....................................................................................................... 246 References ....................................................................................................................... 248 Appendix A: Usability study materials ........................................................................... 258 A.1 Consent form..................................................................................................... 258 A.2 Questionnaire (radar version)............................................................................ 258 Appendix B: Experiment materials ................................................................................. 261 B.1 Consent form ..................................................................................................... 261 B.2 Instructions and protocol ................................................................................... 263 B.3 Questionnaire (radar version) ............................................................................ 267 B.4 Additional task diagrams................................................................................... 269 B.4 Summary of completion time data .................................................................... 270 B.5 Summary of questionnaire data ......................................................................... 271 xiv
B.4 Summary of verbal count data........................................................................... 272
xv
List of Tables Table 1. Elements of WA relating to the present .............................................................. 41 Table 2. Elements of WA relating to the past ................................................................... 41 Table 3. Sources of awareness information in physical and groupware workspaces........ 73 Table 4. WA information provided by four kinds of embodiment. .................................. 97 Table 5. Workspace awareness information shown in expressive-action techniques ..... 103 Table 6. Workspace awareness information shown by expressive artifacts.................... 111 Table 7. Summary of visibility techniques...................................................................... 123 Table 8. Representation and WA changes for versions 1-4 of the radar......................... 144 Table 9. System configurations used by each group ....................................................... 163 Table 10. Total use of each system configuration........................................................... 164 Table 11. Configuration preferred by each group ........................................................... 170 Table 12. Experimental design for formal experiment.................................................... 183 Table 13. Experimental design for exploratory data collection (P = Pair)...................... 184 Table 14. Summary of measures used............................................................................. 186 Table 15. Sex pairings of experimental groups............................................................... 186 Table 16. Task sequence for radar and overview conditions .......................................... 188 Table 17. Perceived-effort questionnaire ........................................................................ 189 Table 18. Summary of completion times (in minutes) for tasks 1-3............................... 191 Table 19. Comparisons of completion times for tasks 1-3.............................................. 192 Table 20. Summary of verbal efficiency (in number of words) for tasks 1-3 ................. 193 Table 21. Comparisons of verbal efficiency for tasks 1-3............................................... 194 Table 22. Summary of questionnaire responses, tasks 1-3.............................................. 195 Table 23. Comparisons of perceived-effort questions..................................................... 196 Table 24. Number of participants preferring each interface............................................ 196 Table 25. χ2 analysis of preference questions ................................................................. 196 Table 26. Strategies used for directing and indicating .................................................... 197 Table 27. Strategy use in the three test tasks................................................................... 199 Table 28. Summary of completion times differentials (in minutes)................................ 200 Table 29. Mean questionnaire differentials..................................................................... 202 xvi
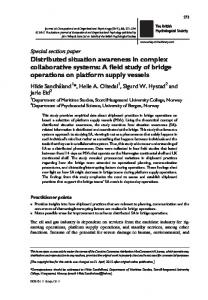
List of Figures Figure 1. A groupware system where the workspace fits on one screen............................. 3 Figure 2. A system where the workspace is larger than the screen ..................................... 3 Figure 3. Research context. ................................................................................................. 5 Figure 4. The research process. ........................................................................................... 7 Figure 5. The perception-action cycle (from Neisser 1976).............................................. 16 Figure 6. Consciousness and awareness (from Smith and Hancock 1995)....................... 19 Figure 7. Situation awareness and subtypes ...................................................................... 21 Figure 8. The group task circumplex (from McGrath 1984)............................................. 29 Figure 9. Domain and collaboration tasks......................................................................... 35 Figure 10. Processes of maintaining workspace awareness .............................................. 42 Figure 11. Summary of the conceptual framework. .......................................................... 60 Figure 12. Strict what-you-see-is-what-I-see (WYSIWIS) view sharing.......................... 64 Figure 13. Relaxed-WYSIWIS view sharing .................................................................... 65 Figure 14. Representational differences in views.............................................................. 66 Figure 15. Physical bodies vs. telepointer embodiment .................................................... 66 Figure 16. Lines of communication in GroupKit applications.......................................... 70 Figure 17. Presentation and placement of awareness display techniques. ........................ 78 Figure 18. Dimensions of design space............................................................................. 85 Figure 19. A preview of the techniques that will be discussed. ........................................ 86 Figure 20. Four identification methods: colour, nametag, portrait, icon (recreation). ...... 90 Figure 21. Groupsketch, showing mode-specific telepointers (Greenberg et al 1991). .... 91 Figure 22. Viewport rectangles in the GroupDesign system (Beaudoin-Lafon and Karsenty 1992). ......................................................................................................... 92 Figure 23. Avatars in a simulated tabletop workspace (mockup). .................................... 94 Figure 24. Shadow (left) and local user (right) in VideoWhiteBoard (Tang and Minneman 1991). ...................................................................................................... 94 Figure 25. Video hands in VideoDraw (Tang and Minneman 1990)................................ 95 Figure 26. ClearBoard, showing video image of remote user (Ishii et al 1992)................ 96 Figure 27. A remotely visible popup menu (recreation). ................................................ 100 xvii
Figure 28. Symbolic delete indicator, during and after delete (recreation). .................... 101 Figure 29. “Supernova” animation of a delete action (recreation). ................................. 102 Figure 30. In-use indication in the Calliope text editor (Mitchell 1996). ....................... 104 Figure 31. Newspaper application with objects marked for later use (prototype)........... 105 Figure 32. Text colour indicates author (Mitchell 1996). ............................................... 106 Figure 33. Spreadsheet cells showing edit wear and read wear (after Hill et al 1991). .. 107 Figure 34. Dragging a file to the trash in the SonicFinder (Gaver 1988)........................ 110 Figure 35. A workspace overview (left) beside a main view. ......................................... 113 Figure 36. View extents and view size for overview and normal view .......................... 113 Figure 37. Radar views showing viewports and telepointers .......................................... 114 Figure 38. The same workspace as a high-fidelity and low-fidelity overview................ 114 Figure 39. Outline radar view.......................................................................................... 115 Figure 40. Multi-user scrollbar in a text editor. .............................................................. 116 Figure 41. View extents and size for detail views, compared to normal view................ 117 Figure 42. Over-the-shoulder view (left) and entire workspace (reduced, right)............ 117 Figure 43. Cursor’s-eye view (left), and remote user’s main view (reduced, right). ...... 118 Figure 44. View extents and size of fisheye view compared to normal view ................. 119 Figure 45. A fisheye representation of a concept-map workspace.................................. 120 Figure 46. View extents and size for the DragMag view. ............................................... 121 Figure 47. A DragMag view of a concept map. .............................................................. 121 Figure 48. Summary of extents and display size............................................................. 122 Figure 49. Participant lists (Roseman and Greenberg 1996)........................................... 124 Figure 50. Coarse and fine coordinate systems. .............................................................. 124 Figure 51. Location indicator for a structured text document (prototype) ...................... 125 Figure 52. Idle-time indicator (Roseman and Greenberg 1996)...................................... 126 Figure 53. Social activity indicators (Ackerman & Starr 1995)...................................... 127 Figure 54. Two examples of overviews in newspaper maps (Calgary Herald 1997)...... 129 Figure 55. The arcade game Defender, with ‘scanner’ view at top (Williams 1980). .... 131 Figure 56. Drawing program with miniature (left) and main view (right) (Aldus 1990).131 Figure 57. Radar view from SharedARK (Smith et al 1989).......................................... 132 Figure 58. Gestalt view from the SASSE text editor (Baecker et al 1993) ..................... 132 xviii
Figure 59. The radar view version 1................................................................................ 133 Figure 60. Version 1 used in a page-layout application. ................................................. 134 Figure 61. The radar view version 2................................................................................ 135 Figure 62. The radar view in a groupware newspaper-layout application ...................... 136 Figure 63. The radar view version 3................................................................................ 138 Figure 64. The radar view in a concept map editor......................................................... 140 Figure 65. Transparent radar using a rendering mask ..................................................... 141 Figure 66. The normal size of the radar view (left) and the full-screen radar (right)...... 142 Figure 67. Research strategies (adapted from McGrath 1994)........................................ 149 Figure 68. Collaboration activities and usability criteria ................................................ 152 Figure 69. Collaborative page layout in the real world (from Hubbel 1993).................. 158 Figure 70. Experimental setup ........................................................................................ 159 Figure 71. Awareness displays and main view. .............................................................. 161 Figure 72. Initial state of the workspace (left) and a completed layout (right). .............. 162 Figure 73. The pipeline application (radar view version) ............................................... 178 Figure 74. Radar view (left) and Overview (right).......................................................... 179 Figure 75. Practice task initial state (left) and schematic of goal (right)......................... 181 Figure 76. Workspace map for the first Follow task ....................................................... 181 Figure 77. Initial workspace state (left) and first goal (right) for the first Copy task...... 182 Figure 78. Workspace map for the first Direct task ........................................................ 182 Figure 79. Familiarity of participants with their study partners ...................................... 187 Figure 80. Experiment room setup.................................................................................. 190 Figure 81. Mean completion times (in minutes) for tasks 1-3 ........................................ 191 Figure 82. Mean verbal efficiency (in number of words) for tasks 1-3........................... 193 Figure 83. Mean questionnaire responses for tasks 1-3 .................................................. 195 Figure 84. Mean changes in completion time from first to second attempts at a task. ... 201 Figure 85. Perceived effort differentials between first and second attempts at a task. ... 202 Figure 86. Need for a means of maintaining WA ........................................................... 221 Figure 87. More individual control implies less group focus.......................................... 228 Figure 88. Steps in designing awareness support............................................................ 230 Figure 89. Initial state and map for Follow 2 task........................................................... 269 xix
Figure 90. Goal diagram for Copy 2 task ........................................................................ 269 Figure 91. Initial state and six additions for Direct 2 task .............................................. 270
xx
Chapter 1
Introduction
Real-time distributed groupware systems are computer applications that allow people to work together at the same time, but from different places. These systems are becoming more common as network connectivity increases and organizations move towards mobile computing, telecommuting, and distributed work teams. Unfortunately, groupware has usability problems: when compared with working face-to-face, collaboration through groupware seems clumsy, stilted, and artificial. When people use a groupware system, they often cannot interact in the ways that they do in front of a whiteboard or over a table. Even simple things like pointing to an object or watching another person work are often difficult or impossible in groupware. One of the problems with current groupware systems is that they make it hard for people to stay aware of one another. It is a simple fact that awareness is an important part of collaboration. One has only to watch a group activity to see people checking up, taking notice, and keeping track of others, whether over a jigsaw puzzle, in front of a chalkboard, or on a basketball court. Awareness is taken for granted in everyday face-toface environments, but when the setting changes to distributed groupware, many of the normal cues and information sources that people use to maintain awareness are gone. Groupware systems provide only a fraction of the information about other people that is available in a face-to-face situation, and as a result, interactions and behaviours that were once effortless can become stilted and formal. I believe that helping people maintain awareness of one another can improve the usability of groupware. In this research, I explore one kind of awareness called workspace awareness, and investigate techniques for supporting it in groupware interfaces. My perspectives are those of the computer scientist and the system designer: I am interested in the problem of groupware usability, and awareness is a potential design requirement that can improve multi-user systems. My goals are to show that the concept of workspace 1
awareness can be framed in a sufficiently operational form to be useful to groupware designers, and to show that support techniques drawn from that framework can improve groupware usability in a variety of ways. The remainder of this chapter will provide some background on the computer science context into which the research fits, introduce the idea of workspace awareness, state the problem and goals of the research in more detail, and outline what is to come in the rest of the dissertation.
1.1 Setting the scene This research falls within the field of computer-supported cooperative work (CSCW), an area in the study of human-computer interaction that attempts to understand and provide technological support for group activity (e.g. Baecker 1993; Greenberg 1991). CSCW is a wide-ranging field, containing research into the behavioural foundations of group activity (e.g. McGrath 1984; Galegher, Kraut, and Egido 1990), group interaction in natural settings (e.g. Tang 1991; Heath and Luff 1992), asynchronous communication and electronic mail (e.g. Malone et al. 1987; Borenstein and Thyberg 1988), synchronous communication through audio and video (e.g. Harrison and Minneman 1990; Abel 1990), support for electronic meetings (e.g. Pinsonneault and Kraemer 1990), and multi-user interfaces (e.g. Stefik et al. 1987a). One area of CSCW research concentrates on real-time distributed groupware: multi-user computer systems that allow people to work together at the same time but from different places (e.g. Sarin and Greif 1985; Dewan and Choudhary 1991; Roseman and Greenberg 1996). This kind of groupware includes applications like shared editors (e.g. Leland et al 1988), drawing programs (e.g. Greenberg et al 1992), multiplayer games (e.g. Rohall et al 1992), and distributed control systems (e.g. Hughes et al 1994). Many real-time groupware systems provide an environment for collaboration called a shared workspace, a bounded space where people can see and manipulate artifacts related to their activities. In the physical world, shared workspaces include chalkboards, tabletops, and control 2
panels; the artifacts in them might be objects in a design drawing, paragraphs in a document, or gauges and dials on a control panel1. Groupware systems create virtual shared workspaces that are often patterned on these physical spaces. For example, Figure 1 and Figure 2 show simple drawing applications used by two people. The shared workspace here is akin to a large sheet of paper. As each person draws, their actions are communicated to the other machine, so both participants’ workspaces contain the same objects. When the whole sheet of paper can fit on one screen, both participants see exactly the same thing at the same time (Figure 1). However,
Figure 1. A groupware system where the workspace fits on one screen
Figure 2. A system where the workspace is larger than the screen I assume throughout this research that shared-workspace systems are used in conjunction with audio and perhaps video links that provide basic communication facilities. 1
3
when the workspace is bigger than the computer screen (Figure 2), the groupware system can only show a part of the paper at once, and the participants have to scroll around to see and work on other areas. If both people scroll to different parts of the workspace, as in Figure 2, they cannot tell where the other person is working or what they are doing. The question of whether real-time distributed groupware systems are usable or not is itself a recent one. Although shared workspace were first demonstrated in 1968 (Englebart 1968), they received little attention until about 1985. In the early years, researchers had to be concerned about basic technical issues like system architectures (e.g. Lauwers and Lantz 1990), message-passing mechanisms (e.g. Sarin and Greif 1985), and ways of tracking participants as they entered and left groupware conferences (e.g. Roseman and Greenberg 1992). Recently, though, tools such as GroupKit (Roseman and Greenberg 1995) have appeared that simplify the construction of real-time groupware by handling the low-level details of putting together a distributed system. Although technical issues still exist (e.g. Greenberg and Marwood 1994; O’Grady 1996), the tools let researchers focus more closely on the human factors of system design, which includes groupware usability. In this research, I examine a kind of awareness that is specific to shared workspaces, and show how the maintenance of awareness can be supported in groupware. Workspace awareness (WA) is the up-to-the-moment understanding of another person’s interaction with a shared workspace (Gutwin and Greenberg 1996a). Workspace awareness involves knowledge about where someone is working, what they are doing, and what they are going to do next. This information is useful for many of the activities of collaboration— for coordinating action, managing coupling, talking about the task, anticipating others’ actions, and finding opportunities to assist one another. When people are able to maintain awareness of one another, these activities are more natural, spontaneous, and unforced. If these attributes can be brought to groupware, the quality and productivity of distributed collaboration can be greatly improved.
4
In order to keep this research effort manageable, and to narrow the focus of the investigation, I will constrain three aspects of the situation under study. First, I will restrict my conception of a workspace to medium-sized flat surfaces like chalkboards and tabletops. Second, since these kinds of spaces are used primarily by small groups, I will presume groups of between two and five people. Third, I will for the most part assume that groups engage in mixed-focus collaboration, where people move back and forth between individual and shared activities during a work session. These restrictions rule out certain kinds of activity, such as large formal meetings and team sports, but still leave a rich variety of small-group collaboration. Typical examples could include two people organizing slides on a light table, a research group generating ideas on a whiteboard, or the managers of a project planning a timeline of project tasks. Figure 3 shows the context and focus of the research. Human-Computer Interaction Computer-Supported Cooperative Work Real-time distributed groupware Shared visual workspaces Small groups Mixed-focus collaboration
Figure 3. Research context.
1.2 Problem statement and research hypothesis The problem addressed by this research is that current real-time distributed groupware systems are awkward and cumbersome in comparison with face-to-face shared workspaces. These usability problems are caused in part by the difficulty people have in 5
maintaining workspace awareness. Workspace awareness is an important part of collaborative activity, whether the setting is a physical or a virtual workspace, and if workspace awareness is difficult to maintain, collaboration becomes more difficult. Furthermore, difficulties in maintaining workspace awareness can be traced to the paucity of information that groupware systems provide about other people. Workspace awareness is maintained through a rich variety of sensory cues, but current groupware systems provide only a fraction of this information; they lack many of the natural affordances that exist in face-to-face settings, and artificial support is limited in current systems. As Liam Bannon has said, “we find that most of the available facilities do not provide a very rich information space—especially if the focus is on ‘real time’ facilities” (in Robinson 1991, p. 41). From this situation, I derive my research hypothesis: that support for the maintenance of workspace awareness improves the usability of real-time distributed groupware systems. I will investigate and test this hypothesis through three research activities: I will operationalize the concept of workspace awareness, apply the concept to the design of groupware interfaces, and evaluate the usability of the resulting systems. Although the evaluation will be the eventual test of the hypothesis, the first two stages are required to connect the experimental results back to the concept of workspace awareness in a logical and traceable way. These three activities form the research process shown in Figure 4, and also define the three research objectives described below. Objective 1. I will frame the concept of workspace awareness in operational terms that are useful in groupware design. This objective will be met in three ways: by constructing a conceptual framework that synthesizes knowledge about workspace awareness, by identifying areas where groupware systems require awareness support, and by detailing the steps that designers must undertake to provide that support. My operationalization of the concept will be successful if it can organize the design space of awareness support and can explain evaluation results in terms of workspace awareness.
6
Objective 2. I will show that the concept of workspace awareness can be applied in the design of groupware interfaces. This objective will be met by designing and building several displays that provide workspace awareness information, and by collecting additional techniques from existing research. The objective will be complete when I can demonstrate techniques in each area where groupware requires awareness support, and when I can organize the displays in terms of the conceptual framework. Objective 3. I will show that adding awareness information to a groupware system can significantly improve aspects of groupware usability. This objective will be met by carrying out an experimental comparison of people’s collaboration in two groupware systems that provide different levels of support for workspace awareness. I will consider the objective to have been successfully met if the experiment is reliable, valid, generalizable, and shows statistically significant results.
Operationalize the concept of workspace awareness Evaluate the effects of WA support
Apply WA to the design of groupware interfaces
Figure 4. The research process.
1.3 Contributions of the research This research contributes original ideas, knowledge, and practices to CSCW and HCI. There are three major contributions. 7
1. I identify and define workspace awareness as a design requirement for real-time distributed groupware. CSCW research has previously recognized that awareness is important, but the nature and mechanics of workspace awareness have not been articulated before. 2. I construct operational descriptions of workspace awareness that can be used in designing and building groupware systems. I construct a conceptual framework that identifies elements of workspace awareness, mechanisms by which it is maintained, and its uses in collaboration. I also identify primary areas where groupware systems need to provide awareness support, and set out the steps that designers must take to provide it. These operational descriptions will help designers to organize the problem of awareness support, assess work situations, and compare designs and interface techniques. 3. I show that groupware systems can be made significantly more usable by support for workspace awareness. This experimental evidence puts intuitions about the importance of workspace awareness on an empirical footing, and increases knowledge about when and where awareness support will be effective. There are several other minor contributions. First, I design and build a set of novel techniques for presenting workspace awareness information, several of which have not been seen before in groupware systems. Second, I increase understanding of the definition and measurement of groupware usability. Third, I gather experimental evidence that replicates and reinforces earlier observations about the role of shared workspace in collaborative interaction. Fourth, I investigate the tension between designing for individuals and designing for groups. These major and minor contributions will be discussed further in later chapters.
1.4 Overview of the dissertation The remainder of the dissertation is organized into parts which follow the research process of Figure 4. To set the scene, Chapter 2 provides background on the two 8
fundamental elements of this research—awareness, and shared workspaces. I consider basic questions of what awareness is and how it works, describe other kinds of awareness studied in previous research, and explore the affordances and constraints of medium-sized workspaces that affect the creation and maintenance of awareness. Once this foundation is laid, the first part of the research process is operationalization. Chapter 3 focuses on the concept of workspace awareness, and introduces the conceptual framework that will be used in the rest of the dissertation. The conceptual framework explores three high-level questions that designers need to address in supporting awareness in groupware: what information do people need about each other in a shared space, how do people gather and maintain this information, and what do people use the information for? The framework answers these questions by describing three aspects of workspace awareness in operational terms: •
the elements of knowledge that make up workspace awareness,
•
the process of maintaining WA and the mechanisms that people use to maintain it, and
•
the uses of workspace awareness in mixed-focus, small-group collaboration.
Chapter 4 then explores specific issues of supporting workspace awareness in groupware. I first identify areas where current groupware systems hinder the maintenance of workspace awareness: they reduce perception of the workspace, they reduce the expressiveness of bodies in the workspace, and they reduce the amount of information that actions and artifacts can convey. I then detail the steps that a designer must take to provide awareness support. I consider issues in collecting workspace awareness information in a groupware setting, distributing it to others, and displaying it in the groupware interface. The second part of the research process is application. Chapter 5 presents a number of display techniques for presenting workspace awareness information in the groupware interface. I demonstrate original and existing displays that address each of the areas in which groupware limits the maintenance of awareness. I describe techniques for 9
workspace embodiment, methods for making actions and artifacts more expressive, and techniques for improving visibility of the workspace. I organize the design space in terms of what awareness information is presented, where in the interface it is presented, and how it is presented. Chapter 6 then looks more closely at one class of awareness displays called the radar view, a display used in both the evaluations of later chapters. I detail the origin and evolution of the display through three design cycles. The third part of the research process is evaluation. Chapters 7, 8, and 9 evaluate the hypothesis that support for workspace awareness improves the usability of groupware systems. Chapter 7 introduces the methodology that will be used in later chapters, and discusses issues in evaluating and measuring groupware usability. Chapter 8 reports on an exploratory usability study of a shared-workspace groupware system, built to examine the effects of several kinds of awareness displays. Chapter 9 then discusses a laboratory experiment that looked more closely at how certain types of awareness information added to a groupware interface affect product, process, and participant satisfaction. Finally, chapters 10 and 11 look back at the research and draw conclusions. Chapter 10 considers connections between the findings of the research and larger issues in the design of highly usable groupware. These include the role of workspace awareness in groupware usability, the importance of redundancy, the relationship between workspace awareness and rich workspace interaction, and the tension between design for individuals and design for groups. Chapter 11 then summarizes the main findings and contributions of the research, assesses progress on each of the three objectives stated above, and suggests a number of directions for further study.
10
Chapter 2
Foundations
This chapter lays the foundations for my investigation of workspace awareness. I explore the two fundamental parts of workspace awareness—awareness and shared workspaces— and set out definitions and boundaries that will clarify and frame later discussions. My intentions are to show the richness that underlies awareness in shared workspaces, and to present a theoretical basis for the operationalization of workspace awareness. The knowledge that I present here will allow me in the next chapters to consider what workspace awareness is, how it differs from other kinds of awareness, how it is maintained, and what it is used for in collaboration. I look at awareness in the first part of the chapter, and begin by determining the basic characteristics of awareness as I will use it in this research. I then provide an overview of situation awareness, an area of human factors research that provides definitions, structures, and processes that can be applied to workspace awareness research. I then look at subtypes of situation awareness that involve awareness of other people, to provide a context into which workspace awareness fits. The second part of the chapter discusses shared workspaces. I consider what a shared workspace is and how workspaces act as external representations of collaborative activity. I then set out some of the properties and constraints of shared workspaces that will affect workspace awareness. Finally, I describe several kinds of prototypical tasks that can occur in shared workspaces, to give an idea of the kinds of activities that I consider in the dissertation.
2.1 Awareness Awareness is such a natural phenomenon that people rarely need to think about it. From a research perspective, however, the first step in understanding workspace awareness is 11
determining what awareness is and how it works. The answers to these questions are necessary if I am to operationalize workspace awareness for groupware design. Although we often take it for granted, the nature of awareness is not inherently obvious. Awareness is generally defined in terms of two concepts: knowledge and consciousness. Awareness as knowledge implies that some piece of information resides in a person’s memory, however deeply, but awareness as consciousness implies that the person is conscious of that piece of information. My research concentrates on the former sense, of awareness as knowledge, and does not delve further into philosophical debates about the nature of experience or about what it means to be conscious or self-aware (e.g. Jackendoff 1989, Underwood 1982). In particular, I follow the lead of human factors researchers who look at awareness as it relates to the interaction between an agent and its environment (e.g. Smith and Hancock 1995, Flach 1995, Adams et al 1995). In this sense, awareness can be simply defined as “knowing what is going on” (Endsley 1995a, p. 36). As the next sections will discuss, this conception of awareness involves states of knowledge but also dynamic processes of perception and action. To begin with, however, I have identified four basic characteristics that run through several conceptions of awareness (e.g. Adams et al 1995; Norman 1993; Endsley 1995a). These characteristics set awareness apart from other kinds of knowing, and bound the concept for the purposes of this research. 1. Awareness is knowledge about the state of some environment, a setting bounded in time and space. For example, the environment might be the airspace that an air traffic controller is responsible for, and their knowledge might include aircraft headings, altitudes, and separation, and whether these factors imply a safe or unsafe situation. 2. Environments change over time, so awareness is knowledge that must be maintained and kept up-to-date. Environments may change at different rates, but in all cases a person must continually gather new information and update what they already know. 3. People interact with the environment, and the maintenance of awareness is accomplished through this interaction. People gather information from the 12
environment through sensory perception, and actively explore their surroundings based on the information that they pick up. 4. Awareness is almost always part of some other activity. That is, maintaining awareness is rarely the primary goal of the activity: the goal is to complete some task in the environment. For example, the air traffic controller’s task is to move aircraft through a region efficiently and safely, and although awareness may affect success, it is not the primary intent.
2.2 Situation awareness Awareness as just described has recently been studied by human factors researchers under the rubric of situation awareness (SA) (e.g. Gilson 1995). Situation awareness has long been a recognized phenomenon in military aviation, where returning pilots would talk of having been ‘one step ahead of the aircraft’ or of having had ‘the right stuff’ (presumably, those who were one step behind the aircraft weren’t talking, or perhaps didn’t return at all). In general terms, however, SA is “the up-to-the minute cognizance required to operate or maintain a system” (Adams et al 1995, p.85). Although aviation has been the major focus, research in SA has also considered other command and control domains such as air traffic control (Smith and Hancock 1995) and anesthesiology (Gaba and Howard 1995). These domains all share certain characteristics: the environment changes quickly, a large amount of information must be gathered in a short time, the demands of the primary task are considerable, and failure can lead to catastrophe. As Gaba and Howard (1995) put it, they all share “dynamism, complexity, high information load, variable workload, and risk” (p. 20). The setting for the study of SA is typified by the situation of landing a commercial aircraft: In the course of managing the navigation, guidance, and control of the aircraft, pilots may be simultaneously responsible for the information presented by up to 400 separate gauges and instruments. They are, moreover, responsible for the interpretation of that information and, as necessary, the inferences involved in identifying the root cause of 13
abnormalities and choosing from among some set of compensatory or remedial actions. For example, in an approach to landing at 2500 feet toward a rainstorm, the pilot may have to perform the following: • monitor descent (e.g. compare actual to desired flight path, airspeed, etc.) • perform the prelanding checklists • set the flaps/slats • receive radio messages from air traffic control (ATC) to reduce speed and watch for traffic • enter the new altitude restriction into the Mode Control Panel • look out the window for traffic • respond to ATC about traffic • worry about the presence of windshear by looking for virga, lightning, or dust rings • watch airspeed, especially for evidence of a windshear encounter • ignore radio traffic to other aircraft except when it contains warnings of nearby hazards • monitor copilot’s performance An interruption, an oversight, a hasty inference, or a decision based on incomplete knowledge or information could mean disaster—and any crew is vulnerable to each, especially under conditions of heavy workload or tight temporal pressure. (Adams et al 1995, p. 85-86) In these complex environments, awareness depends on several cognitive activities. Endsley (1995a) puts forward three levels of SA that are tied to the activities of perception, comprehension, and prediction. First, a person’s perception of the relevant elements of the environment provides them with the raw data that they need to stay aware. For example, a pilot would perceive the gauges and lights in the cockpit, as well as the terrain and airspace outside the aircraft; the driver of a car would perceive the positions and speeds of other cars on the road. Second, a person must interpret the perceptual information in order to comprehend its meaning for the task at hand. For example, the driver of a car might realize that another vehicle is on the wrong side of the street and is coming straight at her. Endsley’s third level involves understanding what the elements of the environment are likely to do in the near future. This prediction might be based on prior experience from a similar situation, or on calculations made from the current information. For example, the driver might predict that the oncoming car is about 14
to return to the right side of the road, or that a collision is imminent and that evasive action will be needed.
2.2.1 Maintaining awareness: product and process I introduced awareness above as a kind of knowing, but there is more to staying aware than just a state of knowledge. Endsley’s three levels of perception, comprehension, and prediction clearly involve different kinds of knowledge at each level, but also suggest different processes as well. Several researchers have explored situation awareness as a process of perceptual and cognitive activities as well as a knowledge product: for example, one definition describes SA as “a generative process of knowledge creation and informed action taking” (Smith and Hancock 1995, p. 142). Adams et al (1995) suggest a model that brings process and product together, and also shows how awareness is maintained. The model is Neisser’s (1976) perception-action cycle, a “cognitive framework for the interdependence of memory, perception, and action” (Adams et al 1995, p. 88). Neisser’s model, shown in Figure 5, captures some of the interaction between the agent and the environment, and incorporates relationships between knowledge and information-gathering activity. It differs from linear models of information processing by recognizing that perception is influenced and directed by existing knowledge that “effectively directs exploratory movements and increases receptivity to particular aspects and interpretations of the available information” (p. 88). Awareness of an environment is created and sustained through the perception-action cycle. When a person enters an environment to do a particular task, they bring with them a general understanding of the situation and a basic idea of what to look for. The information that they then pick up from the environment can be interpreted in light of existing knowledge to help the person determine the current state of the environment— that is, what is happening—and also help them to predict what will happen next. These expectations lead to a further refinement in perceptual sensitivity, as when the expectation of seeing another aircraft sensitizes a pilot to subtle variations in the visual field (Adams 15
et al 1995, p. 89). The perception-action cycle combines both product and process aspects of awareness. Product is captured by the active knowledge created by previous cycles, and process is captured by the movement around the cycle. In my view, the three relationships in Neisser’s cycle (sampling the environment, modifying knowledge, directing exploration) also correspond to Endsley’s activities of perception, comprehension, and prediction.
2.2.2 Cognitive aspects of situation awareness Maintaining awareness through the perceptual cycle depends upon a number of cognitive activities that must be continuously managed during a person’s interaction with the environment. Two of these that play major roles in awareness are attention and memory.
Attention In order to pick up information from the environment, a person must attend to features and stimuli. Although humans can handle many kinds of attentional demands, our resources are limited. Wickens (1992) suggests the concepts of breadth and selection to explain how attention works in dynamic environments. In the following discussions, the Environment
Modifies
Knowledge
Samples
Directs
Exploration
Figure 5. The perception-action cycle (from Neisser 1976) 16
features of the environment are considered as separate information sources or channels on which events occur periodically. Breadth of attention is the number of information sources in the environment that are attended to: either one, or several. Focused attention implies concentration on a single information source—for example, a batter concentrating all their attention on an incoming pitch. Divided attention, on the other hand, implies concentration on multiple information sources using a time-sharing scheme. For example, a pilot landing an aircraft must attend to many different information displays in the cockpit. When attention is divided among several channels, information is gathered by periodically sampling the channels (Wickens 1992, p. 76). Selection of attention is the determination of which information sources are attended to. Selection is influenced both by a person’s goals and by the salience of features in the environment. When driven by goals and intentions, a person decides what channels to attend to, what order to sample them in, and at what rate to sample them. When driven by the environment, attention can be unavoidably drawn to a particularly salient information source. As Wickens says, “there is little doubt that visual attention will be drawn to items in a display that are large, bright, and changing” (p. 81). Awareness is intimately related to attention, and the awareness that a person can maintain is dependent on both the breadth and selection of attention. Awareness can be compromised when there are too many important information sources for a person’s divided attention, when the person selects the wrong sources to attend to or samples them inappropriately, or when perceptually salient features distract the person from more important information. Environmental selection, however, is not always detrimental to the maintenance of awareness, and can alert an operator to important information such as an approaching vehicle. In addition, Neisser’s cycle suggests that salience can be relative. That is, sensitivity to certain environmental events can be heightened, so that events that are not perceptually obvious may still draw a person’s attention.
17
Memory Perceptual information gathered from the environment must be stored and integrated with other knowledge. Endsley (1995a) sees working memory as a bottleneck for awareness, since prediction of future states must often be accomplished through simulation in working memory. People who are experienced in a domain are able to work around this problem through the use of long-term memory structures such as schemata (e.g. Neisser 1976), which are retrieved when they match certain critical features of the situation. Once retrieved, a schema can constrain the possible future states of the situation or provide default values for unknown quantities. As Adams et al (1995) state, “the perceiver’s active schemata mentally structure the flow of events; they effectively direct exploratory movements and increase receptivity to particular aspects and interpretations of the available information” (p. 88). If successive states of the environment are regular, then the use of long-term memory (e.g. what happened last time) can greatly reduce the mental work done to maintain awareness.
2.2.3 Awareness and automaticity One problematic aspect of situation awareness research, that returns us for a moment to considerations of consciousness, is the issue of skilled performance and automatic processing. Automatic processing is “fast, effortless, and unavailable to conscious awareness in that it can occur without attention” (Endsley 1995a, p. 45). The problem is: do people who carry out tasks automatically maintain awareness? In a workspace context, people may well respond to information and others’ actions without conscious thought: does this mean that awareness doesn’t really exist or disappears once people become skilled?
18
There are a couple of different ways to look at this problem. For situation awareness, researchers have proposed that automaticity implies not lack of awareness, but an inability to recall the cues that initiated the behaviour or an inability to articulate the process of reacting to those cues. This view suggests that a low level of attention is allocated
to
the
environment
during
skilled
performance of tasks, enough to identify critical environmental features and react to them, but not
environment Situation Awareness
enough to allow the behaviour to be retrieved from memory and distinguished from similar experiences consciousness
(Endsley 1995a, p. 46). A second view (Smith and Hancock
1995)
suggests
that
awareness
and
consciousness are not exactly the same thing, and that awareness of cues in the environment can be possible without consciousness (see Figure 6). It is clear, however, that even when processing is
Introspection agent
Figure 6. Consciousness and awareness (from Smith and Hancock 1995).
automatic, the activities in the perceptual cycle still occur. For example, perception of cues in the environment is still required, and the retrieval of an appropriate response from memory is also necessary if the person is to react to the stimulus. From the perspective of the groupware designer, then, nothing much changes regardless of whether the processing of information is conscious or unconscious.
2.2.4 Summary of situation awareness Situation awareness typifies many of the characteristics of awareness as I use the term. Situation awareness is a phenomenon of expert interaction with complex environments. SA has both product and process aspects, and these can be tied together using the model of the perception-action cycle. Since human capabilities are limited, awareness in dynamic settings like power plants and aircraft is often difficult. Research in SA, therefore, is concerned with understanding cognitive processes, with understanding how
19
humans behave in these environments, and with designing systems that aid the maintenance of awareness. Specializations of situation awareness can be defined in particular domains. For example, spatial awareness is a pilot’s understanding of her location in an airspace (e.g. Fracker 1989), and mode awareness is “the ability of a supervisor to track and to anticipate the behaviour of [mode-based] automated systems” (Sarter and Woods 1995, p. 7). Workspace awareness can also be seen as a specialization of situation awareness, one in which the situation always involves awareness of another person. There are, however, several kinds of awareness of other people that have been considered in CSCW research, and I look at these now to set a context for workspace awareness.
2.3 Awareness of others in collaboration Situation awareness research generally involves environments that are complex mechanistic systems like aircraft and power plants. However, awareness can also be maintained about another person. Since workspace awareness falls in this category, I turn now to awareness of others in collaboration. CSCW research has considered several kinds of awareness where people keep track of information about individuals or groups. All of them can be seen as subtypes of situation awareness (see Figure 7), and even though their domains are different, they all share the characteristics and processes described above. Below, I describe three kinds of awareness that CSCW research has looked at: informal awareness, conversational awareness, and structural awareness. I introduce these to set them apart from workspace awareness and to provide background in some of the issues that have already been considered in CSCW.
20
Situation Awareness
Spatial Awareness
Mode Awareness
Informal Awareness
Awareness of Others in Collaboration
Conversational Awareness
...
Structural Awareness
Workspace Awareness
Figure 7. Situation awareness and subtypes
2.3.1 Informal awareness Informal awareness of a work community is the general sense of who's around, what they are up to, and whether they are available—the kinds of things that people know when they work together in the same building (e.g. Dourish and Bly 1992, Kraut et al 1990). Often, informal awareness is maintained as a side effect of other activities: for example, a trip down the hall to the water cooler can also provide information about who is in and what they are doing, and having lunch with someone often involves a measure of informal talk about their work. Informal awareness helps people recognize and capitalize on opportunities for collaboration. The benefits of informal awareness can range from a better success rate in reaching people on the telephone to finding an important connection between another person’s work and your own. Traditionally, physical proximity has been necessary for the maintenance of informal awareness. Kraut, Egido, and Gallegher (1990) showed that casual interactions that were commonplace on a single floor of a building dropped off dramatically as the distance between potential collaborators increased, and that collaboration was adversely affected as a result. CSCW researchers have attempted to restore informal awareness and a sense of “being there” to distributed groups. One approach uses media spaces, systems that provide long-term audio and video links between work or social sites (e.g. Bly et al 1992, Abel 1990). Media spaces differ from traditional videoconferencing systems in several 21
ways: they are always on, allowing conversations to start up with little effort; they are often located in areas such as the coffee room that allow passive observation of the other place; and they impose none of the overt structures of a formal meeting. For example, Cruiser is a media space that shows people’s offices through digitally switched video (Root 1988). Cruiser lets people take a walk down a virtual hallway at a remote location, glancing into offices along the way, and gathering much the same information as they would if they were really there. Other systems take a more minimalist approach to informal awareness. Portholes (Dourish and Bly 1992) provides periodic video snapshots of several offices at once, so that a person can see at a glance who’s around and approximately what they are doing. Peepholes (Greenberg 1996) goes even further, showing only whether a selected community of people are logged into their computers, and how long it has been since they were active at their keyboards. The information provided by even these minimalist systems helps people track who is available, and helps them recognize opportunities for collaboration; in addition, these systems often provide means for establishing a more direct communication channel when the occasion arises.
2.3.2 Conversational awareness People continually adjust their verbal behaviour in conversation, based on cues picked up from their conversational partners (e.g. Sacks and Schegloff 1974; Clark and Brennan 1991). Some of these cues are visual, like facial expressions, eye contact, or gestures; others are verbal, like intonation, or the use of particular words. These cues provide a sense of awareness of what is happening in the conversation, awareness that helps us make adjustments and adaptations to keep things going smoothly. Conversational awareness answers both mechanical questions (did they hear me, did they understand me, who’s going to talk next) and also affective questions (do they believe me, how are they reacting). The mechanisms of conversational awareness have been studied extensively by linguistics researchers. Sacks and Schegloff (1974) examined the subtle signals that govern conversational turn-taking. For example, a speaker may indicate their willingness to give up the floor through rising or falling intonation, 22
drawling their final syllable, or cessation of hand gestures (McLaughlin 1984). Clark and Brennan (1991) discuss the kinds of evidence that people give of having understood an utterance, such as back-channel responses like uh huh, yeah, or mm, and gestures such as head nods. These indicate that the hearer is “passing up the opportunity to initiate a repair on the turn so far and, by implication, thinks that they have understood” (p. 132). Conversational awareness also helps to determine whether the listener is paying attention: as Clark and Brennan state, “in conversation people monitor what their partners are doing moment by moment—in particular, what they are attending to” (p. 133). Eye contact is especially important in determining attention: people will start an utterance, wait until the listener begins to make eye contact, and then start the utterance over again (Goodwin, 1981). CSCW research in this area has focused on how technological vehicles affect conversation over distance, and how to provide enough richness in synthetic audio and video channels that conversational awareness can be maintained. A variety of problems still exist, however. Traditional teleconferencing systems do not provide the same information that is available in a face-to-face conversation, and certain kinds of conversational interaction are more complicated as a result. For example, when an audio teleconference involves four or more people, speaker identification and turn-taking become difficult (Egido 1990). Video links provide few of the visual cues used to maintain conversational awareness, often because of the position and angle of the camera is inappropriate for the interaction or because the size and quality of the video image is inadequate. In many cases, “standard social rules and protocols [are] rendered inoperable…because of this loss of information” and people must find new protocols that fit the video environment (Abel 1990, p. 499). For example, Heath and Luff (1991) found that gestural communication was relatively ineffective across a video channel. People also find it difficult to engage in conflict or negotiation over distributed media, as video can “introduce irrelevant distractors that can interfere with the accuracy of interpersonal evaluations” (Egido 1991, p. 363). Another problem with desktop videoconferencing has been the difficulty of true eye contact, since the camera and the display cannot be in the 23
same place. Video tunnels (e.g. Smith et al 1989) use half-silvered mirrors to provide true eye contact, but at the expense of a more complicated setup and reduced image quality.
2.3.3 Structural awareness Structural awareness involves knowledge of a group’s organization and of the working relationships within it. Awareness of roles, of rules for interacting, and of power and status relationships can help a group to operate smoothly and reduce the amount of coordination needed (e.g. Leland et al 1988). Formal meetings, for example, often incorporate explicit structures (such as Robert’s rules of order) to coordinate the activities of a large number of people at once. In small groups, however, group structures are subtle and dynamic, involving moment to moment negotiations of status and responsibility (e.g. Linde 1988); in these cases, staying aware of roles and structures becomes more difficult. Various groupware systems have incorporated support for the maintenance of structural awareness. Models of meeting processes have been used in electronic meeting rooms (e.g. Valacich et al 1991) and decision support systems (e.g. Pinsonneault and Kraemer 1989). Formalizations of interaction such as floor control, where only one person is allowed to use the system at a time, have appeared in a number of systems (e.g. Greenberg 1990). Finally, some kinds of groupware indicate the explicit roles that people have been assigned or have taken. For example, in the Quilt group editor (Leland et al 1988), people may act as writers, readers, reviewers, or editors in the production of a shared document. Role assignments are displayed in the shared editor, information that can help people interpret actions and avoid access conflicts. These systems make certain kinds of structural information explicit, but have been criticized for being too overt and too inflexible to adequately reflect the dynamic nature of group structures in small-group collaboration (e.g. Grudin 1990). In summary, informal, conversational, and structural awareness are three types of awareness that can play a part in a collaborative activity. Workspace awareness is a fourth type, and will be discussed in detail in Chapter 3. All four are related, and there are 24
elements of each type that overlap with the other three. In later chapters, I will discuss ways that workspace awareness is related to these three types, and to conversational awareness in particular. First, though, I turn to the other half of workspace awareness, the shared workspace.
2.4 Shared workspaces If workspace awareness is governed on the one hand by the capabilities and limitations of human awareness, then it is governed on the other by the constraints and affordances of the environment—the workspace where the activity occurs. In this section, I examine shared workspaces, how they are used in collaborative tasks, and what kinds of activities people can accomplish in them.
2.4.1 What is a shared workspace? In the real world, a shared workspace is a physical space where people can undertake some joint activity. For example, a countertop is a workspace where customers and clerks carry out transactions in a drugstore, and a gymnasium floor is a workspace for teams playing basketball. Workspaces can vary widely in their makeup: they can be small or large, two- or three-dimensional, connected or discontinuous. To narrow things down a bit for the purposes of this research, I concentrate on a limited, but still rich, variety of workspace: flat, medium-sized surfaces upon which objects can be placed and manipulated, and around which a small group of people can collaborate. This kind of workspace can be seen in control panels, whiteboards, desks, navigation charts for oceangoing ships, and the most common of all, the general-purpose tabletop. One of the reasons that people use workspaces is that they are a convenient container for task artifacts—the visible and manipulable objects that are the focus of the activity. In the case of medium-sized workspaces, artifacts include things like the pieces on a chessboard, articles and pictures for a newspaper page, slides on a light table, notes and equations on a chalkboard, or the meters and controls on a control panel. Artifacts exist at 25
both a literal and a representational level. They are physical objects, and so can be manipulated in accordance with their physical structure. They are also markers for relevant concepts in a task, and so manipulations and relationships can often be interpreted in terms of the task. This combination of space and artifacts makes a shared workspace an external representation of the joint activity (Clark 1996; Norman 1993; Hutchins 1990). Clark lists three uses of external representations in collaboration. 1. External representations serve as a reminder of what’s going on: “the current state of the activity is represented in quite a concrete form” (Clark 1996, p. 45). The orientation of the artifacts can thus remind participants where they stand in the interaction. For example, seeing three playing cards face up on the table might remind me that it’s my turn to put down the fourth. 2. External representations are useful for imagining possible moves or actions, with a consistent reference point to return to. Norman (1993) describes a scene where one person describes an automobile accident through objects on a tabletop: Several people can share the tabletop and the story at the same time, perhaps suggesting alternative courses of action. “Look,” Marie might say, picking up one of the pencils, “when you saw the dog, you should have gone like this.” “Ah, but I couldn’t,” Henri might respond, “because there was another car there,” and he puts yet another pencil on the tabletop. …Note what is now happening: people are using the artifacts themselves to reason about alternative courses of action. (p. 48) 3. External representations are a medium for task actions, providing a vehicle on which the joint activity can be moved forward. That is, communication and interaction can be carried out by actions in the external representation. For example, moving a piece in a chess game does more than change the state of the board; it also says “your move” to the other person. Similarly, pushing groceries toward a checkout clerk can be taken as a request that the clerk ring up the items. This last point shows that shared artifacts and external representations can be used as mediums for communication, and I will return to this idea several times in this dissertation. Other kinds of non-verbal communication are also supported by the shared 26
workspace. With the workspace as a backdrop, people can use gestures to demonstrate, can point to objects to identify them, and can confirm requests simply by carrying them out. These kinds of actions supplement verbal communication and make it more efficient, as discussed in Chapter 3. In sum, shared workspaces play a major role in the richness of interaction that we can see in collaborative situations. Although we take shared workspaces for granted in the everyday world, “it is hard to exaggerate the value of these representations…many joint activities would seem impossible without [them]” (Clark, p. 47).
2.4.2 Properties of shared workspaces Shared workspaces as described above have natural constraints and affordances that shape the awareness that people maintain about one another. The most important property has already been described—that workspaces provide an environment for interaction, thus giving people something to be aware of. Three additional properties that affect awareness have been recognized in prior research: perceptual availability, spatial organization, and bounded interpretation. Perceptual availability. Tabletop-sized workspaces are small enough that anything going on can be seen and heard, putting the entire space within what Hutchins (1990) calls “the horizon of observation.” People can observe others as they move about the space and work on artifacts, they can see and recognize particular actions, they can see what tools others are using, and they can see where others are looking. In addition, conversations and environmental sounds are available as part of the acoustic environment. Spatial organization. Physical workspaces are inherently spatial, and people in joint activities use location and spatial relationships in meaningful ways. Specific locations in the workspace often have particular importance, such as the squares on a chessboard, and artifacts are “interpreted in part by their spatial location with respect to other markers” (Clark 1996, p. 46). Furthermore, people often make use of spatial metaphors for organization; for example, a group may organize a flowchart so that time moves from left 27
to right in the workspace. Since physical workspaces allow people to move around in the space, their own spatial location becomes part of what other participants notice and track. Bounded interpretation. Workspaces provide a bounded environment that constrains interpretation, and allows people to map perceptual information such as movement or sound onto meaningful events in the activity (Norman 1993). Maintaining awareness of others in the workspace through watching and listening is thus simplified. For example, if a person reaches across a table towards a pair of scissors, standard knowledge about workspaces suggests that they are about to pick them up.
2.4.3 Tasks in shared workspaces There are many activities that people can undertake as a group. For example, Figure 8 shows eight general kinds of group tasks, ranging from conflict to cooperation, and involving both conceptual and behavioural activities (McGrath 1984). However, the properties described above (and my assumption of cooperation) constrain what can be reasonably accomplished in a shared workspace. To introduce the kinds of activities that I will be investigating, I have compiled a set of basic archetypal tasks that a small group can do in a shared space. In terms of the circumplex in Figure 8, shared-workspace tasks are primarily generation and execution activities. Within these categories, most of the tasks that I am interested in involve performance or creativity: the execution of a physical project, or the generation of ideas and new artifacts.
28
Planning: generating plans
Performance: executing performance tasks
Creativity: generating ideas
Intellectual: problems with correct answers
Generate
Execute
Choose
Negotiate
Contests: conflicts of power
Mixed motives: conflicts of interest Deciding: issues with no right answer
Cognitive conflict: conflicts of viewpoint
Figure 8. The group task circumplex (from McGrath 1984). The task types described below are not intended to exhaustively cover the entire range of possible workspace activity, but to provide representative samples of what is commonly undertaken. The tasks are abstracted from a rough classification of tasks seen both in previous literature and in my own experience. The types are not orthogonal: any real work situation that uses a shared workspace will likely not fit entirely within one particular type, and may combine characteristics of multiple types. Part of the reason for this categorization of tasks is that, as McGrath mentions, “[performance] tasks are very heavily represented in the workaday world [but] are quite underrepresented in research on groups” (p. 65). Construction. In construction, the goal is to build, assemble, or compile a whole out of pieces, parts, or components. Real-world examples include putting together a sewing machine (Miyake 1984) or assembling a trash toter (Chapanis 1972); construction projects in groupware might include building a flow network (Doerry 1995) or laying out a newspaper (Gutwin et al 1996). The shared workspace for these tasks is a place to put the structure and the pieces. The workspace artifacts are the pieces and parts, and are used literally in that they do not stand for abstract concepts. There may also be tools in the 29
workspace, used to put the artifacts together. Construction is an inherently spatial task: the locations of artifacts in the workspace, and the spatial relationships between artifacts, are essential factors in completion of the task. Organization. A second class of tasks has as its goal the achievement of some state of organization in the artifacts. Types of organization include sorting, ordering, arranging, categorizing, and scheduling. Examples that could be seen in groupware workspaces include ordering a set of slides for a presentation, arranging and linking concepts in a concept map (Gaines and Shaw 1995), or planning the schedule of activities in a software project. The artifacts being organized are usually representational rather than literal, and the relationships between artifacts represent conceptual relations rather than physical constraints. Precise spatial locations in the workspace are not as important as the relationships between objects, although people often use spatial metaphors for organization. Dynamic control. The goal of dynamic control tasks is to keep a system in a certain state or control a system through some procedure. Groupware examples include air traffic control and distributed process control. This kind of task is characterized by the autonomy of the artifacts in the workspace—that is, the artifacts change or move over time without the operator’s action. Artifacts respond to physical forces, dependencies of production, or the commands of other controllers. The workspace in a dynamic control task provides a space for observing the states of system artifacts, and means for effecting controls on those artifacts. The artifacts are representations of system variables, controls, or objects moving through the system. Creation and design. The purpose of design and creation is to produce new entities that satisfy certain criteria. Writing, drawing, and brainstorming tasks all involve the creation of new things. In these tasks, the artifacts are the things created, and the workspace is a backdrop on which to put them. Artifacts can either be representations (e.g. ideas in a brainstorming session) or literal objects (e.g. lines in a drawing). Examples of design and creation tasks that could be undertaken in groupware include the generation of ideas for a 30
new product (Tang 1991), the generation of an outline for a paper (Ellis et al 1991), or the initial design of an automated post office (Olson et al 1992). Exploration. The goal of exploration is to find artifacts in an environment that satisfy certain criteria. General examples of exploration include searching, hunting, gathering, and selecting. The artifacts are determined by the problem domain, but the size of the collection is often the reason for the task being undertaken by a group. Example tasks include finding a set of sites on the world-wide web, or finding certain pieces of information in a loosely-structured information space. These tasks all share certain characteristics due to the fact that they all take place in a shared workspace. However, the type of task that a group undertakes also determines to a certain extent the kind of interactions that group members will engage in, and therefore the kinds of workspace awareness information they will use. I look at the issue of workspace awareness requirements more closely in Chapter 4.
2.5 Summary This chapter has explored the two main ideas underpinning the research: awareness and shared workspaces. The purpose of the chapter was to show the complexity and richness inherent in people’s interaction with shared workspaces, and to set out a theoretical basis for the operationalization of workspace awareness in the next chapter. Awareness is “knowing what is going on” in a bounded and dynamic environment. Awareness involves perception, comprehension, and prediction, bound together in a perception-action cycle. Situation awareness research has investigated complex domains like piloting and power plant operation, but awareness of other people in collaboration— informal, conversational, structural, and workspace awareness—can also be considered. Shared workspaces are bounded settings for joint action and containers for work artifacts. I concentrate on medium-sized workspaces like whiteboards and tabletops. Shared workspaces and the artifacts in them form an external representation of the joint activity; workspaces are also perceptually available, spatial, and provide bounds on interpretation. 31
Tasks in shared workspaces include primarily execution and generation tasks such as construction, organization, control, design, coverage, and exploration. With these ideas about awareness and workspaces in hand, the way is now clear for a closer look at workspace awareness in the next chapter.
32
Chapter 3
Workspace Awareness
Having laid out some of the underlying principles Operationalization
of awareness and shared workspaces, this chapter focuses on awareness in shared workspaces. I
Evaluation
have defined workspace awareness as the up-tothe-moment understanding of another person’s interaction with a shared workspace. This
Application
definition, however, is too abstract to provide groupware designers with much direction. Consequently, the goal of this chapter is to explicate workspace awareness in terms that can be used for design. To that end, I have constructed a conceptual framework that operationalizes different aspects of workspace awareness. The framework has three parts: the elements of knowledge that make up WA, the process and mechanisms by which it is maintained, and the uses of WA in collaboration. These parts correspond to the designer’s tasks of determining what information to present in the interface, how to present the information, and in what situations the information will be useful. Although the framework cannot encompass all the ways in which workspace awareness affects human collaboration, each part of the framework presents core knowledge that designers need in order to support workspace awareness in groupware. The framework is intended as a high-level guide rather than a complete set of design rules, since much of the detail needed for specific implementations is determined by the realities of a particular work situation. The framework provides a basic structure for thinking about workspace awareness and a vocabulary for analyzing collaboration and comparing groupware support. The knowledge in the framework comes both from existing research and from my own observations of group work.
33
I begin by considering workspace awareness as a specialization of situation awareness, and by outlining the characteristics that determine it as a subtype. I then introduce the observational studies used to gather information about workspace awareness. After these two sections, the remainder of the chapter addresses each part of the conceptual framework in turn.
3.1 Workspace awareness as situation awareness Workspace awareness can be viewed as a specialization of situation awareness. Therefore, the characteristics of awareness introduced in Section 2.1 also apply to workspace awareness: it is knowledge of a dynamic environment, it is maintained through perceptual information gathered from the environment, and it is peripheral (although not inconsequential) to the primary group activity. Specialization from the more general concept of situation awareness arises because the situation of interest is constrained to involve a shared workspace and another person’s interaction with that workspace. There are two ways in which the characteristics of workspace awareness set it apart from other types of situation awareness that have been studied previously: workspace awareness is tied to the specific setting of a shared workspace, and it involves awareness of the other people in the space. First, workspace awareness is tied to a specific setting—medium-sized shared workspaces—whereas situation awareness can apply to any dynamic environment. This workspace setting constrains the situation, and knowing the characteristics and bounds of the situation allows me to focus on the specific nature of the awareness needs within that environment. The characteristics of shared workspaces set out in Section 2.4.2—spatial representation, bounded interpretation, and perceptual availability—shape the interactions that people can have with them. For example, the spatial nature of workspaces implies that artifacts and events can be interpreted in part by their location in the workspace; also, when other people enter the space, information about their locations also becomes part of workspace awareness. 34
Second, workspace awareness emphasizes knowledge of another person. This includes knowledge of how others interact with the workspace and its artifacts, and how these interactions relate to the group’s collaboration. Collaboration is one aspect of situations that has received only secondary consideration in prior SA. The involvement of other people in the workspace implies a difference in what the awareness is for. In other studies of situation awareness, awareness knowledge is used for the task of controlling a system. In workspace awareness, awareness knowledge is used to support collaboration over the workspace. Figure 9 illustrates this difference. When someone works alone in a workspace, their activities and their SA involve only the workspace and the domain task. In a collaborative situation, however, people must undertake another task, that of collaboration, and therefore their situation awareness must involve both the domain and the collaboration. The SA that involves collaborating in a shared workspace is what I call workspace awareness. As discussed below, however, the collaboration task can certainly affect the domain or control task—so workspace awareness can also affect outcomes and products.
Collaboration task
Domain tasks
Domain tasks
Domain tasks
Figure 9. Domain and collaboration tasks A consequence of these two specializations (person and workspace) is that workspace awareness also involves the combination of the two—interaction of the person with the workspace. That is, it is not enough to know just the person’s action, or just the 35
workspace context: it is the action in the context that is important. When a single operator flies a plane, for example, their awareness concerns the aircraft alone. When a piloting team is in charge, however, they have to know about the workspace (the cockpit), about the actions of the other pilots, and how those actions relate to the workspace, in order to understand what the others are doing. These specializations also imply that there will be other differences between my research on workspace awareness and previous research into situation awareness. The most important of these concerns the kinds of task settings that I consider and the role that awareness plays in the completion of the task. To begin with, situation awareness research has concentrated on extreme task settings—those that involve “dynamism, complexity, high information load, variable workload, and risk” (Gaba and Howard 1995, p. 20). Although situation awareness plays a role in all tasks, prior research has focused on those settings where maintaining awareness is difficult, or where skilled performance is difficult because of informational and attentional demands. This research often considers ways to help people cope with the amount and rate of incoming information. In contrast, I am interested in supporting the maintenance of workspace awareness in a wide variety of situations, including the mundane and the ordinary—situations where awareness is not generally difficult to maintain in a face-to-face environment. As I will discuss further in Chapter 4, the main problem in this research is not one of human limitations, but of technology limitations: when people collaborate over distance, technology hides the cues that were obvious in a face-to-face situation. This difference can be refined by considering the relationship between awareness and various levels of task performance. In many of the settings studied by SA research, there is a strict minimum performance standard that demands certain awareness. For example, to keep an aircraft in the air for any length of time, a pilot must stay aware of her altitude and airspeed. In many of the ordinary, workaday tasks that I consider in this research, however, the standard for minimum performance is considerably lower, so lack of workspace awareness will not lead to disaster. For example, if two people who are editing 36
a document fail to stay aware of one another’s activities, they may work at cross purposes, duplicate one another’s work, or become frustrated, but they can likely still get the job done without dire consequences. This is partly because workspace awareness affects the domain task indirectly, through the collaboration task. That is, the degree to which workspace awareness affects the domain task depends on how important successful collaboration is to the domain task. In some tasks, collaboration is not critical to the task, and so failure to maintain workspace awareness may simply contribute to a devolution into parallel individual work. This is not to say, however, that collaboration and workspace awareness are never critical. To illustrate this, Sarter and Woods (1995) discuss an airline crash where lack of workspace awareness—specifically, about what control actions the other pilot had taken on the cockpit control panels—led to the autopilot being in the wrong mode for landing: The pilot-flying had disengaged his flight director [a cockpit display] at some point during the approach and was assuming that the pilot-not-flying would do the same thing. This would have resulted in…the SPEED mode, which is the recommended procedure for the approach phase. However, the pilot-not-flying never turned off his flight director. Therefore, the OPEN DESCENT mode became active when a lower altitude was selected. (p. 8) The problem in this case is that each pilot received an indication of the status of his own flight director only. In other words, when the pilot-flying turned off his flight director, the FD1 message on his primary flight display disappeared. However, he never had an indication of the status of FD2 (the other pilot’s flight director) and therefore could not verify via his display whether FD2 was turned off as well. (p. 9) In sum, workspace awareness is a specialization of situation awareness where the situation is constrained to consider other people interacting with shared workspaces. I am considering task settings where the consequences of failure are less extreme, and where awareness has traditionally (that is, in face-to-face environment) been relatively simple to maintain. The problems in maintaining workspace awareness over distance arise from technological limitations rather than human limitations.
37
3.2 Observational studies I observed several groups performing simple tasks in physical shared workspaces, in order to gather basic information about the uses and mechanisms of workspace awareness, and to gain first-hand experience with phenomena described in research literature. Findings from these studies contribute to the structure and content of the conceptual framework. I use episodes from the observations to illustrate the framework in the following sections, but I do not otherwise summarize the findings. The studies were informal and varied widely in task, group structure, setting, and realism; in some cases, I even participated as part of the group. I did not employ any formal methodology, but in all cases I observed the collaboration and took notes. In some sessions, the collaboration was videotaped for later review. Below, I introduce each session to give an idea of the settings and the tasks that were observed. The first five tasks were completed in a laboratory setting, and the final two were visits to real work environments. In the laboratory tasks, people were allowed to organize their collaboration however they saw fit. All of the laboratory tasks were madeup activities, while the two real work visits involved people’s normal work activities. Blocks and puzzles. I began my observations by asking people to complete simple tabletop tasks with me as a partner. Two different people completed three different tasks with me. The first task was a jigsaw puzzle, the second was a puzzle with pentominoes pieces, and in the third, we built a house out of toy blocks. All three tasks were carried out at an ordinary table. These tasks took approximately 10 minutes each to complete. String. Two pairs were asked to measure the distance between several pairs of points on a whiteboard, using a long piece of string as a measuring tool. The points were far enough apart that each person had to hold an end of the string. The participants did the task in two settings: first, in front of a normal whiteboard, and second, with a divider that prevented them from seeing one another’s work areas. The tasks took about 20 minutes in total. 38
Cathedral. Two pairs completed a more complicated construction task, that of building a two-dimensional plan of a cathedral using a variety of cardboard pieces. The task included constraints (such as keeping the colours symmetrical) to encourage more interaction between the two participants. The task took place on a large table, and participants were allowed to move where they wished around the workspace. The cathedral task took about 40 minutes to complete. Concept map. Three pairs were asked to complete a half-finished concept map using a written paragraph as their guide to the entities and relationships in the map. Again, the materials were paper and pencils, and the workspace was a large table. Pairs had to organize a set of existing objects and relations, and then add to the diagram until the paragraph was fully represented by the map. The concept map tasks took people about 50 minutes to finish. Newspaper layout. Four pairs completed a newspaper layout task. Groups were asked to put together a two-page spread of a fictional newspaper, using paper articles, pictures, and headlines supplied to them. Groups were allowed to lay out the pages as they wished, as long as the paper had a roughly consistent style. These tasks required about 40 minutes. Newsroom. A visit to the student newspaper offices on production day was one of two observations of real work situations. I spent approximately six hours in the production room of the Gauntlet, the University of Calgary student newspaper, watching activities that ranged from story composition to page layout. In the part of the office I observed, five writers and two editors worked on the paper. Air traffic control. The second real work situation that I visited was the air traffic control centre at the Calgary airport. I spent one afternoon (about four hours) observing three collaborating controllers who supervise the airspace in a 35-mile radius around Calgary. A controller is in charge of one of three stations: commercial arrivals, commercial departures, or small private aircraft that operate under visual flight rules. Controllers sit in front of large radar screens that show all flight activity within an adjustable radius from the airport. Therefore, controllers see one another’s aircraft on their screens. The 39
controllers interact with each other, with the tower operators who supervise takeoffs and landings, and with regional controllers who supervise the airspace beyond the 35-mile radius. A typical (through greatly simplified) task for the arrivals controller would be to accept an aircraft from the regional controllers, guide it into its final approach, and hand it off to the tower controllers.
3.3 Framework part 1: Elements of knowledge The first part of the framework divides workspace awareness into the types of information that people track in a shared workspace. This part of the framework is intended to provide designers with a starting point in considering what information to provide in a groupware interface. Although there are a huge number of possible pieces of knowledge that can make up a person’s awareness, certain elements are basic to a wide variety of situations. These are the elements that answer “who, what, where, when, and how” questions, and these are the elements that should be considered first by designers. Within these basic categories, I have identified several specific elements of knowledge that make up workspace awareness. Table 1 shows elements contained in the categories of who, what, and where, all of which relate to awareness of the present; I also list the specific questions that each element answers. Table 2 shows the categories and elements that relate to the past, including how and when, as well as the history of who, what, and where. Category
Element
Specific questions
Who
Presence
Is anyone in the workspace?
Identity
Who is participating? Who is that?
What
Where
Authorship
Who is doing that?
Action
What are they doing?
Intention
What goal is that action part of?
Artifact
What object are they working on?
Location
Where are they working? 40
Gaze
Where are they looking?
View
Where can they see?
Reach
Where can they reach?
Table 1. Elements of WA relating to the present The elements are all commonsense things that deal with interactions between a person and the environment. Awareness of presence and identity is simply the knowledge that there are others in the workspace and who they are, and authorship involves the mapping between an action and the person carrying it out. Awareness of actions and intentions is the understanding of what another person is doing, both at a low level (e.g. erasing something) and at higher levels (e.g. fixing the title). Awareness of artifact means knowledge about what object a person is working on. Location, gaze, and view relate to where the person is working, where they are looking, and what they can see. Awareness of reach involves understanding the area of the workspace where a person can change things, since sometimes a person’s reach can exceed their view. Category
Element
Specific questions
How
Action history
How did that operation happen?
Artifact history
How did this artifact come to be in this state?
When
Event history
When did that event happen?
Who (past)
Presence history
Who was here, and when?
Where (past) Location history
Where has a person been?
What (past)
What has a person been doing?
Action history
Table 2. Elements of WA relating to the past Awareness of the past involves several additional elements. Action and artifact history concern the details of events that have already occurred, and event history concerns the timing of when things happened. The remaining three elements deal with the historical side of presence, location, and action. A person’s workspace awareness knowledge in a particular situation will be made up of these elements in some combination. Although there will also be additional information 41
specific to the task or the work setting, these elements provide a high-level organization for awareness information. The elements are a starting point for thinking about the awareness requirements of particular task situations, and provide a vocabulary for describing and comparing awareness support in groupware applications.
3.4 Framework part 2: Process of maintaining WA The groupware designer’s second task is to present awareness information in ways that make the maintenance of workspace awareness simple and straightforward. The perception-action cycle discussed in the previous chapter provides a guide to this task. The cycle serves as a model for the maintenance of workspace awareness in groupware. The three phases of the cycle reflect three basic requirements of staying aware in a shared workspace, as shown in Figure 10. First, a person has to determine what to look for in the workspace environment. Second, they must gather perceptual information about others. Third, they have to make sense of the perceptual information in light of what they already know. Figure 10 adds these requirements to the basic perception-action cycle. The three stages of the cycle as they apply to workspace awareness are described in more detail below. I consider each stage as it operates in physical workspaces, since the way things work in the real world will be used in later chapters as a guide for designing groupware Environment Interpret perceptual information
Gather perceptual information Samples
Modifies
Knowledge
Directs
Exploration
Determine what to look for next
Figure 10. Processes of maintaining workspace awareness 42
support.
3.4.1 Gather perceptual information from the environment The first stage of the perception-action cycle is the collection of perceptual information from the environment. There is a great deal of raw perceptual data available in any environment. In a real-world shared workspace, however, there are three main sources of awareness information, and three corresponding mechanisms for gathering it. This section synthesizes sources and mechanisms have been described in previous literature (e.g. Segal 1994; Norman 1993; Dix et al 1993; Hutchins 1990). People gather information from people’s bodies, from workspace artifacts, and from conversations and gestures. The mechanisms that they use to gather it are called consequential communication, feedthrough, and intentional communication.
Bodies and consequential communication The first information source is the other person’s body in the workspace (e.g. Segal 1994; Norman 1993). Since most things that people do in a workspace are done through some bodily action, the position, posture, and movement of heads, arms, eyes, and hands provide a wealth of information about what’s going on. Therefore, watching other people work is a primary mechanism for gathering awareness information: “whenever activity is visible, it becomes an essential part of the flow of information fundamental for creating and sustaining teamwork” (Segal 1994, p. 24). Although people do contribute to the auditory environment, much of the perception of a body in a workspace is visual. In all of the tabletop tasks discussed in Section 3.2, for example, participants would regularly turn their heads to watch their partners work. The mechanism of seeing and hearing other people active in the workspace is called consequential communication: information transfer that emerges as a consequence of a person’s activity within an environment (Segal 1994). This kind of bodily communication, however, is not intentional in the way that explicit gestures are (see 43
below): the producer of the information does not intentionally undertake actions to inform the other person, and the perceiver merely picks up what is available. Nevertheless, consequential communication provides a great deal of information. In a study of piloting teams, Segal reports that “[Pilots] spent most of their time—over 60%—looking across at their [partner’s] display while it was being manipulated. This suggests that beyond the information provided by the display itself, these pilots were specifically looking for information provided by the dynamic interaction between their crewmembers and that display” (p. 24). This study also suggests that movement is particularly important in consequential communication, since our attention is naturally drawn to motion. An example is given by Norman (1993), who relates the value of “obvious actions” in aircraft cockpits: When the captain reaches across the cockpit over to the first officer’s side and lowers the landing-gear lever, the motion is obvious: the first officer can see it even without paying conscious attention. The motion not only controls the landing gear, but just as important, it acts as a natural communication between the two pilots, letting both know the action has been done. (p. 142)
Artifacts and feedthrough The artifacts in the workspace are a second source of awareness information (e.g. Dix et al 1993; Gaver 1991). Artifacts provide several sorts of visual information: they are physical objects, they form spatial relationships to other objects, they contain visual symbols like words, pictures, and numbers, and their states are often shown in their physical representation. Artifacts also contribute to the acoustic environment, making characteristic sounds when they are created, destroyed, moved, stacked, divided, or manipulated in other ways (Gaver 1991). Tools in particular have signature sounds, such as the snip of scissors or the scratch of a pencil. By seeing or hearing the ways that an artifact changes, it is often possible to determine what is being done to it. This mechanism is feedthrough (Dix et al 1993): when artifacts are manipulated, they give off information, and what would normally be feedback to the person performing the 44
action can also inform others who are watching. When both the artifact and the actor can be seen, feedthrough is coupled with consequential communication; at other times, there may be a spatial or temporal separation between the artifact and the actor, leaving feedthrough as the only vehicle for information. In the Calgary air traffic control centre, for example, the departures controller cannot monitor all of the arrival controller’s actions, but can see the status of arriving aircraft on their display change from “approaching” to “landed.” When they see this change in the artifact, they can also infer the activities of the arrivals controller.
Conversation, gesture, and intentional communication A third source of information that is ubiquitous in collaboration is conversation and gesture, and their mechanism is intentional communication (e.g. Clark 1996; Heath and Luff 1995). Verbal conversations are the prevalent form of communication in most groups, and there are three ways in which awareness information can be picked up from verbal exchanges. First, people may explicitly talk about awareness elements with their partners, and simply state where they are working and what they are doing. My own observations of shared-workspace tasks (Section 3.2) suggest that these direct discussions happen primarily when someone asks a specific question such as “what are you doing?” or when the group is planning or replanning the division of labour. Second, people can gather awareness information by overhearing others’ conversations. Although a conversation between two people may not explicitly include a third person, it is understood that the exchange is public information that others can pick up. For example, navigation teams on navy ships talk on an open circuit, which means that everyone can hear each others’ conversations. Hutchins (1990) details how members of the team listen in on these conversations, either to monitor the actions of a junior member, or to learn from more experienced members. Third, people can pick up others’ verbal shadowing, the running commentary that people commonly produce alongside their actions, spoken to no one in particular. This 45
behaviour, which I observed in all tasks where people worked over the same objects, provides others with awareness information without requiring people to enter into a conversation. Heath and Luff (1995) also observed this behaviour, which they call “outlouds.” They note that although these “outlouds…might be thought relatively incursive, potentially interrupting activities being undertaken by [others] in the room, [they are] perhaps less obtrusive than actually informing particular persons” (p. 157). The style of verbal shadowing can be explicit or highly indirect. In the newspaper-layout task, participants regularly stated exactly what they were doing, saying things like “I’m going to cut this article,” or “I’ll move this over here.” In other work situations like the London Underground (Heath and Luff 1992), controllers talk more to themselves and use oblique references like curses or song phrases, but are nevertheless able to convey information to others in the control room. Gestures and other visual actions can also be used to carry out intentional communication. These differ from consequential communication in that they are intended, and are often used alongside verbal productions. Short, Williams, and Christie (1976) note two forms of visual communication used to convey task information (rather than information about conversational awareness, as discussed in Chapter 2). First is illustration, where speech is illustrated, acted out, or emphasized. For example, people often illustrate distances by showing a gap between fingers or hands. The second form is the emblem, where words are replaced by actions: for example, a nod or shake of the head indicates ‘yes’ or ‘no’ (p. 45).
3.4.2 Make sense of perceptual information In the second stage of the perception-action cycle, people must make sense of perceptual information gathered from the workspace, and integrate it with what they already know (see Figure 10). Perceptual information is often unenlightening in its original form, and must be interpreted before it can inform the elements of workspace awareness. For example, seeing someone’s arm move back and forth does not tell me what they are 46
doing, but in a real situation I might easily infer useful knowledge from that information. The motion might mean that my partner is erasing something, that he is erasing the title of the talk, and that he is working on the beginning of the document. People are naturally skilled at making these kinds of inferences, using what they already know about the situation to reduce the ambiguity of the perceptual information. In a shared workspace, four kinds of knowledge are particularly relevant: knowledge about workspaces in general, about the specific workspace context, about the task, and about the person. These are based on my own observations and experiences, and on general previous research into the use of context in comprehension (e.g. Wickens 1992; Neisser 1976). General knowledge about workspaces. Shared workspaces have been a part of people’s work and play their whole lives, and people know what to expect from them. In particular, they know how physical objects behave when they are manipulated and what kinds of sounds they make. They know what common tools are for, and the sounds that they make when used. They know what kinds of spatial relationships are possible in a medium-sized space. They also understand the basic constraints on a person in the workspace, such as how far they can reach and how they get from one place in the workspace to another. Knowledge of the workspace context. When we observe an action, the immediate surroundings provide a context in which to interpret it. The area of the workspace and other nearby artifacts both help to determine the action’s meaning. For example, seeing someone loosening a nut may not mean much until it becomes clear from the surrounding context that they are loosening the main nut on the propeller. In addition, knowing the workspace location may limit interpretation of what a person is doing: for example, if someone is working underneath the rear wheels of a car, they’re unlikely to be working on the steering. Knowledge of the task. The constraints and materials of the task provide another context in which to interpret awareness information. These constraints may exist within the workspace, such as rules of operation, procedures and practices, or the way artifacts work. 47
They may also be part of the larger work situation, such as deadlines or quality requirements. For example, if I see another person drawing a line between two objects in the concept map task, I can infer that they are denoting a relationship between two concepts. Knowledge of the participants. Familiarity with the other people in the group also assists interpretation of their interaction with the workspace. Knowledge of a person’s character and working style, of their experience with the task, and of their particular approach to certain situations can all be used to limit the way that their actions are interpreted. For example, Krauss and Fussell (1990) consider how a person’s membership in a category, such as teenagers or taxi drivers, helps to predict what they know and how they will behave. In addition to knowledge of individuals, constraints imposed by the group’s structure and the relationships in the collaboration can also be used. With each of these kinds of knowledge, expertise increases the specificity of the inference. As people become experts at a task, or become very familiar with their collaborators, they are better able to determine what a particular piece of perceptual information means. For example, in the string task (see Section 3.2), participants initially took considerable care to verbally check the other person’s activities and determine when the other person had anchored their end of the string. As the task progressed, however, the amount of verbal interaction quickly dropped off. People were becoming more sensitive to other kinds of information, especially the movement and tension of the string itself, and were able to gather workspace awareness information about the other person’s activities using much less verbal information.
3.4.3 Determine what to look for next The third stage in the perception-action cycle involves further exploration of the environment (see Figure 10). A person’s existing awareness and knowledge influence the way that they explore the environment and look for additional or new awareness information (e.g. Adams et al 1995). One principle underlying this process is selective 48
attention. William James (1981) described how attention could be selective depending upon the goals and knowledge of the perceiver. A faint tap per se is not an interesting sound; it may well escape being discriminated from the general rumor of the world. But when it is a signal, as that of a lover on the window-pane, it will hardly go unperceived (p. 418). My observations of group activity suggest that in maintaining workspace awareness, people use knowledge to direct perception in three ways. First, people know, or learn, what kinds of perceptual information are useful for informing workspace awareness, and they can pay less attention to other kinds. For example, although we can see all of the motions that a person’s body makes, we may not register many of them because they aren’t important to the interaction. That is, some of the information that is part of consequential communication is not useful for maintaining workspace awareness. Second, people form expectations about what others are going to do in the future, and direct more attention to assessing whether actions fit the predictions. For example, if someone’s current activities may lead them into a situation where they could destroy my work, I will likely be more alert to their actions than if they were involved in an innocuous activity. The third way in which knowledge directs perceptual exploration is considerably different from the first two. If people need information about another person, they can always simply ask them for it. Collaborators regularly ask each other questions like “what are you doing?” or “where are you now?.” Verbal communication thus forms a generalpurpose catch-all for obtaining workspace awareness information when other mechanisms are unavailable. It should be noted, however, that explicit verbal communication is often more effort than other mechanisms, and that people will use perceptual means when they can.
49
3.5 Framework part 3: Uses of workspace awareness A groupware designer needs to know the situations and activities where workspace awareness will be used, to better analyze collaborative tasks and to better determine when groupware support is called for. Workspace awareness is used for many things in collaboration. As discussed earlier, workspace awareness may not always be required for the task’s completion, but it is useful for a wide variety of joint projects. Awareness can reduce effort, increase efficiency, and reduce errors for the activities of collaboration. This section describes five types of activity, reported in literature and seen in my observational studies, that are aided by workspace awareness (e.g. Tatar et al 1991; Clark 1996; Tang 1991; Salvatore et al 1996). These provide a basic set of collaborative activities that designers can look for as they analyse work situations. The five activities are: simplification of verbal communication, anticipation, assistance, management of coupling, and coordination.
3.5.1 Simplification of communication Workspace awareness lets people use the workspace and the artifacts in it to simplify their verbal communication and make it more efficient. As discussed in Section 2.3.1, the workspace is an external representation of the collaborative activity. When the discussion involves objects in the workspace, this representation can be used as the basis for nonverbal communicative actions: the artifacts act as conversational props (Brinck and Gomez 1992) that let people mix verbal and visual communication. Workspace awareness is important because interpreting the visual signals depends on knowledge of where in the workspace they occur, what objects they relate to, and what the sender is doing. The nonverbal actions simplify dialogue by reducing the length and complexity of utterances. Four kinds of these communicative actions have been previously observed in studies of face-to-face collaboration: deictic reference, demonstration, manifesting actions, and visual evidence.
50
Deictic references. Referential communication involves composing a message that will allow another person to choose a thing from a set of objects (Krauss and Fussell 1990). When transcripts of a collaborative activity are reviewed, however, many of these messages are almost unintelligible without knowledge of what was going on in the workspace at the time. For example, consider a fragment from the pentominoes puzzle task: A: How about this thing……the tail? The only thing that can be is… B: No, not that. B: This thing? It could be that thing … A: Yeah, could be that thing… A: Could be that thing… The verbal communication does not convey what people are pointing at or indicating when they say “this,” “that,” “here,” or “there.” The practice of pointing or gesturing to indicate a noun used in conversation is called deictic reference, and is ubiquitous in shared workspaces (e.g. Segal 1994; Tatar et al 1991; Tang 1991). For example, in a flight simulation experiment with two pilots, Segal (1994) found that many of the transcribed utterances could not be interpreted without reference to a videotape of the cockpit displays. Deictic reference is a crucial part of the way we communicate in a shared space. As John Seely Brown and colleagues (1989) state: Perhaps the best way to discover the importance and efficiency of indexical terms and their embedding context is to imagine discourse without them. Authors of a collaborative work will recognize the problem if they have ever discussed the paper over the phone. “What you say here” is not a very useful remark. Here in this setting needs an elaborate description (such as “page 3, second full paragraph, fifth sentence, beginning…”) and can often lead to conversations at cross purposes. The problem gets harder in conferences calls when you becomes as ambiguous as here is unclear. The contents of a shared environment make a central contribution to conversation. (p. 36)
51
Demonstrations. In addition to gestures used to illustrate conversation (e.g. Clark 1996), people use gestures in workspaces to demonstrate actions or the behaviour of artifacts. As Tang (1989) states, “ideas are often enacted gesturally in order to express them effectively to others, especially if they involve a dynamic sequence of actions” (p. 76). Common demonstrations include tracing a path in the workspace with a finger or illustrating how an artifact operates. For example, Tang (1989) observed a participant in a design session turning her hand over to demonstrate how a card would flip back and forth (p. 76). Manifesting actions. Actions in the workspace can also replace verbal communication entirely. When people replace an explicit verbal utterance with an action in the shared workspace, they are performing a manifesting action (Clark, 1996). Placing my groceries on the counter tells the clerk “I wish to purchase these items” without me having to say so. However, manifesting actions must be carried out carefully to prevent them being mistaken as ordinary actions: the action must be stylized, exaggerated, or conspicuous enough that the “listener” will not mistake it (Clark, p. 169). Therefore, I must place my groceries on the counter in such a way that the clerk realizes I am making a purchase request and not just resting my arms. Visual evidence. When people converse, they require evidence that their utterances have been understood. In verbal communication, a common form of this evidence is backchannel feedback. In shared workspaces, however, visual actions can also provide evidence of understanding or misunderstanding. Clark (1996) provides an example from an everyday setting, where Ben is getting Charlotte to center a candlestick in a display: Ben: Okay, now, push it farther—farther—a little more—right there. Good. (Clark, p. 326) Charlotte moves the candlestick after each of Ben’s utterances, providing visual evidence that she has understood his instructions and has carried them out to the best of her interpretation. This kind of evidence can be used whenever people carry out joint projects involving the artifacts in a shared workspace. 52
The success of these four kinds of nonverbal communication depends on two aspects of workspace awareness. First, and most obvious, the communicative action must be perceived before it can be understood; if the action is invisible, it is impossible to interpret. For example, if I cannot see that you are pointing, or what you are pointing at, I cannot ground your deictic reference. Second, the receiver needs to have an idea of the workspace context in which the visible actions occur, since the meaning of the action may be ambiguous without certain information. For example, if there are several green blocks in the workspace, seeing only that you are pointing to a green block may not be enough information to correctly ground the reference. Or, if you hand me an object in a way that appears to be a request, I may need knowledge of your current activities before I can determine your expectations. The important thing here is that the sender has to understand what the receiver can see in order to construct useful non-verbal communications. This means that workspace awareness (or perhaps meta-awareness) is part of conversational common ground in a shared workspace. Common ground is the mutual knowledge that people take advantage of to increase their communicative efficiency (Clark 1996). The principle of least collaborative effort (Clark and Brennan 1991) suggests that people expend only the minimum effort in composing an utterance that they believe is necessary for their message to get across to the hearer. If they can exploit common ground, they can reduce the work that goes into communication. Without common ground, people must do more work to compose exact, complete, and literal utterances. Workspace awareness as common ground means that people can further simplify their communication even without visual productions. They do this by assuming that the other person’s awareness will help them correctly interpret highly underspecified utterances. For example, if I believe that you know where I am and what I’m working on, I can say something like “do you think that it will fit?” instead of “do you think that the smaller of the two arches will fit at the top of the tower that’s at the right side of the picture?,” a much more complicated and exact utterance.
53
3.5.2 Coordination Coordinating actions in a collaborative activity means making them happen in the right order, at the right time, and generally, making them meet the constraints of the task. Coordination is necessary at several levels of granularity, from small hand movements to large-scale divisions of labour. In addition, certain kinds of joint activities require the concerted action of two people. For example, the string task requires that one person anchor their end of the string, and then that the other mark the distance, in that order. Coordination can be accomplished in two ways in a shared workspace: “one is by explicit communication about how the work is to be performed…another is less explicit, mediated by the shared material used in the work process” (Robinson 1991, p. 42). This second, less explicit way uses workspace awareness. Awareness aids both fine and coarse-grained coordination, since it informs participants about the temporal and spatial boundaries of others’ actions, and since it helps them fit the next action into the stream. Workspace awareness is particularly evident in continuous action where people are working with the same objects. One example is the way that people manage to avoid bumping into each others’ hands in a confined space. Tang (1989) saw this kind of coordination in design activity: the physical closeness among the participants…allows a peripheral awareness of the other participants and their actions, as evidenced in the many ‘coordinated dances’ observed among the hands of the collaborators in the workspace. There were many episodes of intricate coordinated hand motions, such as getting out of the way of an approaching hand or avoiding collisions with other hands. These coordinated actions indicate a keen peripheral awareness of the other participants… (p. 95) Workspace awareness is also useful in the coordination and division of labour and in the planning and replanning of the activity. As the task progresses, groups regularly reorganize what each person will do next. These decisions depend in part on elements of workspace awareness—what the other participants have done, what they are still going to do, and what is left to do in the task. Based on another person’s activities, I may decide to begin a complementary task, to assist them with their job, or to move to a different area of 54
the workspace to avoid a conflict. It may be more efficient to have the members of the group do work that is near in proximity or in nature to what they are currently doing or have done in the past. Knowing activities and locations, therefore, can help in determining who should do what task next. The cathedral task provides a concrete example: the structure was symmetric, and people would regularly choose to do the symmetrical complement to their partner’s action immediately after they had completed it.
3.5.3 Anticipation Another common behaviour in collaboration is anticipation, where people take action based on their expectations or predictions of what others will do in the future. People anticipate others in several ways. They can prepare for their next action in a concerted activity, they can avoid conflicts, or they can provide materials, resources, or tools before they are needed. Anticipation is based on prediction, and people can predict workspace actions at both small and large time scales. First, people can predict some types of events by extrapolating forward from the immediate past. For example, if I see someone reaching towards a pair of scissors, I might predict that they are going to grab them. This prediction allows me to anticipate the event: I might pick up the scissors and pass them to the reacher, I might replan my own movements to avoid a collision, or I might reach for them myself to grab them before the other person gets them. This kind of anticipation is integral to the fine-grained coordination discussed above in Section 3.5.2. Although ordinary, anticipation is difficult without workspace awareness—in the example, without up-to-the-moment knowledge of where the other person’s hand is moving, and of their location in relation to the scissors. In addition to this information, my prediction could have also taken into account other workspace awareness knowledge, such as their current activities and whether they were doing something that required scissors.
55
When prediction happens at a larger time scale, people learn which elements of situations and tasks are repeated and invariant. People are experts at recognizing patterns in events, and quickly begin to predict what will come next in situations that they have been in before. Workspace awareness is again important, but this time provides people with the information they need to determine whether others’ behaviour or current workspace events match the patterns that they have learned. For example, in air traffic control, regional controllers hand flights off to the Calgary controllers when they come within 35 miles of the city. The transfer is done entirely through the shared workspace. The regional controller tags the aircraft’s icon, and the Calgary controller must acknowledge the handoff by pressing a command key while their trackball cursor is overtop the aircraft. This handoff procedure is done for each flight, so the controllers are extremely familiar with it. Accordingly, the Calgary controllers anticipate the handoff, based on the information available in the workspace and their experience of what the regional controllers do in this situation. When a Calgary controller sees an incoming aircraft appear on the edge of the radar screen, they will often move their cursor over the aircraft, waiting for the handoff indicator from the regional controller to appear.
3.5.4 Assistance Assisting others with their local tasks is an integral part of collaboration, and one that also benefits from workspace awareness. Assistance was extremely common in the observed tasks, but not usually explicit. Often, one participant would make some indirect statement indicating that they wanted assistance, and their partner would look over and leave their tasks for a few moments to help out, and then return to what they were doing. For example, one participant was unable to find a piece that she needed for the cathedral task, and so indirectly asked her partner for assistance: A: Do you have another one of these guys here? B: They’re, uh, red? A: Yeah. B: Yep, there’s one… 56
People were also able to provide assistance without a prior request. In the same task, one participant simply reached over and placed a piece for the other: A: Oh, and I found another triangle thing for you…here. Awareness in these situations is useful because it helps people determine what assistance is required and what is appropriate. In order to assist someone with their tasks, you need to know what they are doing, what their goals are, what stage they are at in their tasks, and the state of their work area. In the second example above, the helper knew what their partner had already completed; in particular, that she had not yet placed the “triangle thing.”
3.5.5 Management of coupling Several researchers have recognized that when people collaborate, they shift back and forth between individual and shared work, and that awareness of others is important for managing these transitions. For example, Dourish and Bellotti (1992) observed that people involved in a shared editing task “continually moved between concurrent, but more or less independent, work… to very tightly focused group consideration of single items. These movements were opportunistic and unpredictable, relying on awareness of the state of the rest of the group” (p. 111). Gaver (1991) adds that “people shift from working alone to working together, even when joined on a shared task. Building systems that support these transitions is important, if difficult” (p. 295). Salvatore et al (1996) call the degree to which people are working together coupling. In general terms, coupling is the amount of work that one person can do before they require discussion, instruction, action, information, or consultation with another person. Some of the reasons that people may move from loose to tight coupling are that they see an opportunity to collaborate, that they need to come together to discuss or decide something, that they need to plan their next activity, or that they have reached a stage of their task that requires another person’s involvement. A sense of awareness about what
57
another person is doing makes each of these situations more feasible, by allowing people to recognize when tighter coupling could be appropriate. For example, in a financial dealing office, dealers manage coupling by carefully monitoring their colleagues’ activities (Heath and Luff 1995). …though dealers may be engaged in an individual task, they remain sensitive to the conduct of colleagues and the possibility of collaboration… ‘Peripheral’ monitoring or participation is an essential feature of both individual and collaborative work within these environments. ( p. 156) So, for example, it is not unusual in the dealing room for individuals to time, with precision, an utterance which engenders collaboration, so that it coincides with a colleague finishing writing out a ticket or swallowing a mouthful of lunch. By monitoring the course of action in this way and by prospectively identifying its upcoming boundaries, individuals can successfully initiate collaboration so that it does not interrupt an activity in which a colleague is engaged. (p. 152)
3.6 Summary of the conceptual framework This chapter has laid out some of the dimensions of workspace awareness in terms that are useful to designers, both for analyzing collaborative situations and for designing and comparing groupware tools. First, awareness was characterized as a subtype of situation awareness, but one that differs in several ways from traditional SA. It concerns people’s interaction with the workspace rather than the state of a mechanistic system, it is generally not as critical to the completion of the task, and it is generally not as difficult to maintain. The conceptual framework described three aspects of workspace awareness: its component elements, the process of maintaining it, and its uses in collaboration. These parts correspond to three tasks that the groupware designer must undertake in supporting workspace awareness: understand what information to provide, determine how the knowledge will be gathered and interpreted, and determine when and where to provide awareness information. Figure 11 represents the conceptual framework as an overlay on 58
the perception-action cycle. In the figure, I add the idea of action as a complement to exploration, since workspace awareness is used to inform action in the workspace as well as for further perceptual exploration. Several elements of workspace awareness answer who, where, and what questions. They deal with issues like who is present and who is responsible for actions, where people are working and where they can see, and what actions they are performing and what their intentions are. Other elements of workspace awareness considers awareness of history and past events. Workspace awareness is maintained through a perception-action cycle in which people gather perceptual information from the environment, integrate it with what they already know, and use it to look for more information in the workspace. Information is gathered primarily through three mechanisms: consequential communication, feedthrough, and intentional (verbal and non-verbal) communication. People use their knowledge of workspaces, the task, and their collaborators to interpret and make sense of the perceptual information. People direct their perceptual information-gathering based on their knowledge and their predictions, but also have the fallback of making verbal requests for information. Workspace awareness is useful for making collaborative interaction more efficient, less effortful, and less error-prone. There are several types of activities where the benefits of workspace awareness are evident: in reducing the effort needed for verbal communication, in simplifying coordination, in providing context for assistance and anticipation, and in helping people to recognize opportunities for closer coupling.
59
Environment Interpret perceptual information Interpretation is aided by: • knowledge of the workspaces • knowledge of the task • knowledge of the participants • other WA knowledge
Gather perceptual information • consequential communication • feedthrough • verbal & non-verbal communication
Knowledge WA Knowledge Who
Exploration
Where What
Determine what to look for next • selective attention
When How
• expectations of future activity • explicit requests for WA information Action
Uses of WA in collaboration • simplification of communication • coordination of actions and activities • anticipation of events • provision of assistance • management of coupling
Figure 11. Summary of the conceptual framework. The conceptual framework sets out basic knowledge that designers need to consider when building workspace awareness support into groupware systems. In the next chapter, I look more closely at putting this knowledge into practice, and develop specific approaches and principles for supporting awareness in groupware interfaces. The major problem to be addressed is that groupware environments are not like face-to-face ones, and have few natural information sources or perceptual affordances. Therefore, the designer must collect, distribute, and display any workspace awareness information that is to be part of the system. The approach that I propose for this task is based on the idea that people should be able to maintain workspace awareness using the skills they already have from collaborating in face-to-face situations.
60
Chapter 4
Supporting WA in groupware
Previous chapters have introduced the perceptionOperationalization
action cycle and the conceptual framework as ways to organize the concept of workspace
Evaluation
awareness. This chapter takes these ideas one step further, and considers issues directly related to providing support for workspace awareness in a
Application
groupware system. The conceptual framework sets out some of the principles on which workspace awareness operates in the real world, and sets up an implicit goal that people should be able to use these principles for maintaining awareness in a groupware workspace. However, awareness in face-to-face settings works under the assumption that the necessary perceptual information is automatically available in the environment, an assumption that is broken when the setting shifts to groupware. This change gives rise to the issues discussed in this chapter. A groupware workspace is a fundamentally different environment than a physical workspace. Since the workspace is a virtual one, contained within the system, interaction with it is constrained by the input and output technology in use. Furthermore, virtual workspaces are also synthetic—nothing exists in the environment automatically, and nothing happens unless explicitly determined by the designer. In face-to-face collaboration, the contents and behaviour of the environment are automatic, and information just is; but in groupware, the information landscape is barren. With no natural information sources, the groupware designer is faced with a problem: for any information that is to be in the system, they must collect, distribute, and display that information explicitly. That is, they have to take on the role that is taken for granted in the real world, that of propagating information across space and between the members of the group. 61
This chapter looks at the three tasks of collecting, distributing, and displaying workspace awareness information. The ideas and requirements of the conceptual framework—what information to provide, how to provide it, and when to provide it—must be put into practice through the specifics of collection, distribution, and display. Design decisions made at each step will affect the way that people maintain workspace awareness through the groupware interface. I consider each step separately below. First, however, I give a more detailed analysis of the workspace awareness problems caused by the shift to a groupware setting, and give an example of how workspace awareness information is managed in a typical groupware application.
4.1 The groupware problem Current computational workspaces do not naturally provide the rich information landscape available in a face-to-face setting. As a result, many of the perceptual cues that people use to maintain workspace awareness are missing in a groupware system. This problem exists for two reasons. First, the technical and physical environment of groupware—that is, the input and output devices that people use to interact with the workspace—often imposes severe constraints on how people interact with artifacts, how the workspace is perceived, and what can be seen of others. Second, the ways that designers themselves think about groupware have also limited the awareness information available in a shared workspace. This situation goes back to early groupware systems where single-user applications were converted to allow input from multiple users (e.g. Greenberg 1990). In these systems, designers thought of workspaces simply as containers for the system’s work artifacts; shared workspaces were seen as equivalent to single-user workspaces, but with additional issues of concurrency control and synchronization. They focused on the shared data, rather than the shared space. This outlook is still evident in many current groupware systems, including recent large-scale efforts like Microsoft NetMeeting (Microsoft 1997) and Netscape Communicator (Netscape 1997). However, as described in Chapter 2, researchers have repeatedly shown that a shared workspace is more than just a container. It is a stage for rich and complex interactions between people. 62
By ignoring this reality, designers often create workspaces where there is a paucity of workspace awareness information, and where human interaction becomes difficult and awkward. Once the importance of interaction is understood, then the problem becomes one of overcoming the barriers imposed by the technical setting. Therefore, I look at three ways in which the structure and organization of groupware hinders the maintenance of workspace awareness. First, groupware reduces people’s ability to perceive the workspace environment. Second, it limits the expressivity of bodies and artifacts, two of the primary information sources for WA. Third, it complicates verbal communication by making non-verbal productions more difficult. I orient the following discussions around the problems caused by standard workstation-based groupware systems with standard input and display devices. I do not look at novel devices partly because of time constraints, and partly because the basic issues can be adequately explored by considering current technology.
4.1.1 Groupware reduces perception of the workspace Groupware systems weaken both visual and auditory perception of a workspace. The auditory environment is compromised because computational artifacts do not have natural sounds, and many groupware workspaces are silent as a result. If any sounds are to be heard, designers must create synthetic ones and explicitly add them to the application (e.g. Gaver 1991). Currently, it is difficult to reproduce the subtlety and range of natural workspace sound. In addition, because workspaces are two-dimensional and because audio output devices are limited, much of the directional and proximal components of sounds are lost or rendered meaningless in a groupware environment (although soundlocalization toolkits are now becoming available). Changes to the visual environment are even more prominent. Display devices are much smaller and offer much lower resolution than the normal human field of view: whereas a pair of eyes can take in 170 degrees, more than enough for a medium sized workspace on 63
a tabletop or a wall, a large computer monitor provides a field of only about 30 degrees when viewed from one metre. The reduction in size means that only a small part of the workspace is visible at a time, forcing people to look and work through a small viewport. Reduction in resolution means that artifacts are harder to see and differentiate from one another, and that visual events are more difficult to perceive. Additional problems for workspace awareness have been caused by techniques designed to offset visibility problems. One in particular concerns view sharing techniques. Early groupware systems imposed “what you see is what I see” (WYSIWIS) view sharing (e.g. Stefik et al 1987a), where all participants’ viewports looked at exactly the same part of the workspace (see Figure 12). This approach ensures that people can stay aware of one another’s activities, but is often too restrictive for many kinds of collaboration where people regularly move back and forth between individual and shared work (Salvatore et al 1996, Dourish & Bellotti 1992, Gaver 1991).
Figure 12. Strict what-you-see-is-what-I-see (WYSIWIS) view sharing
64
More recent systems allow people to move and change their viewports independently, allowing them to view the objects that interest them (see Figure 13). This is called relaxed-WYSIWIS view sharing (Stefik et al. 1987b). Unfortunately, when people can look at different areas of the workspace, they are effectively blinded to the actions and events that go on outside their viewport. Consequential communication, feedthrough, deixis, and gestural communication are all impossible outside each person’s narrow view of the workspace. A second relaxation to WYSIWIS view-sharing allows people to change the representation of the workspace artifacts, further complicating visual communication. Differences in representation can be minor, such as the use of different formatting or font sizes (e.g. Greenberg and Roseman 1996), or may completely change the way an artifact is presented. For example, one person could view a hierarchical set of artifacts as an indented list, while another views it as a graphical tree (Figure 14). When representations differ, many low-level actions and motions cannot be properly interpreted outside the original context. For example, although moving a leaf node in the graphical diagram can be represented in the outline once the move is complete, the path along which it is dragged during the move has no meaningful analogue. Information can sometimes be translated so that it is meaningful in other views (e.g. Greenberg, Gutwin, and Roseman 1996), but in many cases the differences in representation are too great.
Figure 13. Relaxed-WYSIWIS view sharing 65
Figure 14. Representational differences in views
4.1.2 Groupware limits the expressivity of bodies A person’s body interacting with a physical workspace is a complex information source with many degrees of freedom. Chapter 3 discussed the uses of consequential communication and gesture in maintaining awareness. In many groupware workspaces, however, representations of bodies are completely absent, and this rich source of information is lost. Even when designers do provide workspace representations of people, the restricted input devices of most systems mean that embodiment is limited to a mouse cursor (see Figure 15).
Figure 15. Physical bodies vs. telepointer embodiment
66
These remote cursors (called telepointers) are a huge improvement over nothing at all, because with them, people can gesture and point in the workspace. Even so, cursors are spartan replacements for bodies: they cannot show many gestures, they cannot indicate where someone is looking, and they are too small to express the large motions that attract our attention in a physical workspace. In addition, telepointers allow little room for differentiation. In a physical workspace, identity is trivial to establish, but it is much more difficult to tell the difference between two similar-looking telepointers, especially if people are not talking as they work. Although outside the standard workstation-based setting, it is worth noting that several CSCW projects have used video to recreate real bodies in groupware workspaces. These setups mix a video signal into the display of the computational workspace, providing a composite image that shows both the computational artifacts and the person. For example, VideoDraw (Tang and Minneman 1990) used a camera mounted above a horizontal display to provide images of people’s arms and hands as they drew on the display with light pens. ClearBoard (Ishii et al 1992) went one step further, and combined video of the whole upper body with a large computational workspace. The effect is one of working with another person through a sheet of glass: the remote participant appears to be behind the display drawing on the back of the glass, while the local user draws on the front. The most important contribution of ClearBoard is that it shows people where the other person is looking (gaze awareness), a valuable cue in determining what they are working on. Although these techniques provide effective workspace embodiment, they have not been widely used since they require specialized hardware and complicated setups, and are not easily scaled for relaxed-WYSIWIS workspaces or groups larger than two. These techniques are discussed further in Section 5.1.1. Groupware not only restricts the form of a person’s presence, but also what can be seen of their actions. Physical workspaces are the ultimate direct-manipulation environments, and part of consequential communication is the characteristic and perceivable motions that people make when they interact with artifacts. Interaction with a groupware workspace, 67
however, is not subject to physical constraints, and the appearance of actions in these environments depends entirely on the design of the system. Symbolic or indirect manipulation of artifacts reduces what information other people can gather about the activity. For example, artifacts may be manipulated through menu selections or command keys instead of literal actions. Even in direct manipulation applications, limits on input devices force a certain amount of symbolic interaction: for example, many applications use a select-then-operate model for manipulating artifacts. These changes cause several problems for the maintenance of workspace awareness. First, when actions are less obvious, it is more likely that they will go unnoticed. Second, changes occur suddenly, and instantaneous change is more difficult to interpret. Third, since the constraints on an artifact’s behaviour are arbitrary in a virtual workspace (that is, they are defined by the system’s designer), actions may seem surprising and confusing unless the rules of the environment are known in advance. Finally, indirect manipulation is more difficult to connect to a causal agent or actor, and this means that even when the meaning of the action can be determined, it can still be impossible to tell who is behind it.
4.1.3 Groupware limits the expressivity of artifacts Groupware complicates feedthrough—the gathering of information from artifacts— because artifacts in a shared workspace often do not show effects of their use. First, symbolic manipulation as described above reduces the interim feedback that an artifact produces during an operation, since changes can happen instantaneously. Second, intermediate states of an artifact are often not transmitted to others, only the final change. For example, typing is rarely transmitted character-by-character, and instead is delivered after the return key is pressed. Other systems only show the final position of a moved object, not the progress of the move. These two problems affect what can be seen of an action while it is happening. A third problem reduces what can be learned from an object about past actions. Artifacts in the real world show traces of how they came to be what they are. Their histories are 68
often visible in their appearance—how carefully they were created, what colour of ink was used to write on them, how much they have been used, and other telltale signs of manipulation. In contrast, computational artifacts do not tell tales. They have a blandly consistent appearance and manipulating them does not automatically leave traces (Hill et al 1991). Their sameness means that people have fewer signs for determining what has happened and what another person has been doing.
4.2 An example of awareness management in groupware I introduced the three steps of collecting, distributing, and displaying workspace awareness information at the beginning of the chapter. To illustrate how these steps work in a groupware application, I describe a simple example using the GroupKit groupware toolkit (Roseman and Greenberg 1995). The awareness displays and groupware systems shown in later chapters were all built with GroupKit. GroupKit is an extension to the Tcl/Tk programming language (Osterhout 1996) that simplifies the construction of realtime distributed groupware. It provides programming abstractions for passing messages to other machines in a conference, shared data structures called environments, and a set of interface widgets commonly used in groupware such as menus, participant lists, and scrollbars. After a brief outline of GroupKit’s architecture and message passing facilities, I describe how awareness information is handled in a GroupKit application.
4.2.1 GroupKit architecture Groupware systems built with GroupKit use a replicated architecture (e.g. Crowley and Forsdick 1989; Lauwers et al 1990), where the application process runs on each workstation in the conference, and where data is duplicated at each site. This architecture stands in contrast to a centralized setup, where the application process, the application data, or both are located on a central machine. A replicated architecture implies that each application process must communicate with every other process, forming lines of communication illustrated in Figure 16. In terms of awareness information, this means 69
that data collected at each local machine about the local user must be sent separately to each other machine. GK Application Process
GK Application Process
GK Application Process
Figure 16. Lines of communication in GroupKit applications Application processes communicate with each other through TCP/IP sockets that connect every pair of machines. On top of the socket layer, GroupKit messages take the form of Remote Procedure Calls (RPCs), which allow one process to invoke a Tcl procedure on another machine. GroupKit provides two high-level programming abstractions for passing information between machines. The first is an interface to the RPC layer: the GroupKit commands gk_toAll, gk_toOthers, and gk_toUserNum allow a program to invoke a procedure on all machines, on all machines except itself, or on one particular machine. The second abstraction is a shared data structure called an environment. Although the data in an environment is replicated at each participant’s machine, environments automatically track changes to their data and inform all the machines in the conference of those changes. Environments can be configured to generate events in the application when changes are made, allowing application procedures (such as a redisplay procedure) to be tied to changes in the data structure.
4.2.2 Management of awareness information Applications must explicitly collect, distribute, and display any workspace awareness information that is used in the system. To collect the information, interface events that reflect elements of WA must be trapped, and the relevant information recorded. To distribute the information, it must be transmitted to others in the conference as a 70
GroupKit message. To display the information, application processes must interpret the message and draw relevant parts of the display. The following GroupKit code fragment illustrates how simple telepointer information might be managed. For simplicity, I use RPCs (gk_toOthers) rather than environments to distribute the telepointer’s location. The code shows only the collection, distribution, and display of the awareness information; it assumes that a drawing surface (called a canvas) has already been created, and that the application has created telepointer items on that canvas for each remote user. Since this code runs on all machines in the conference, these steps manage the telepointer information for each person in the conference. # 1) collect cursor information from the local user bind .myCanvas “broadcastTelepointer %x %y” # 2) distribute x and y location for the local user proc broadcastTelepointer {x y} { gk_toOthers updateTelepointer $me $x $y” } # 3) update the location of a remote user’s telepointer proc updateTelepointer {user x y} { .myCanvas coords telepointer$user $x $y }
In this example, $me uniquely identifies the local user, and .myCanvas is the canvas drawing surface. The three parts of the code are explained below: Collection. The bind command attaches a Tcl callback (the broadcastTelepointer procedure) that is invoked whenever the local user’s mouse is moved. Distribution. The broadcastTelepointer procedure contains the gk_toOthers command that invokes the updateTelepointer procedure on all other machines in the conference. Note that we use gk_toOthers because the local user does not need a telepointer for themselves.
71
Display. Finally, the updateTelepointer procedure does the actual display work, moving the appropriate telepointer item (one has previously been created for each remote user) to the right place on the canvas.
4.3 A general approach: the synthetic information landscape The problems discussed above imply that workspace awareness in a groupware system will always be different than in a face-to-face setting. However, a far greater degree of support can be provided than what is seen in current systems. I propose the idea of a synthetic information landscape as a general approach to providing awareness information in groupware. An information landscape is simply a set of displays that sustains some of the content and presentation qualities that are part of physical workspaces. The assumption behind this idea is that maintaining WA will be easier if people are able to use skills that they already have. That is, people should be able to maintain awareness in groupware by gathering perceptual information from a dynamic environment, interpreting what that information means, and then acting on their knowledge. The metaphor of a landscape has implications both for the kinds of information that are presented and the ways that they are displayed. Much of what I discuss below regarding the collection, distribution, and display of workspace awareness information fits within this approach.
4.4 Collection Any workspace awareness information that is to be part of a groupware interface must first be collected by the system. This implies that code in the system will record input or interface events that are meaningful in terms of supporting workspace awareness. This need raises two basic questions: what information should be collected, and how should it be gathered? The conceptual framework sets out what elements of information should be made available to group members. However, it does not state how the elements of workspace awareness can be determined using the information sources found in a 72
groupware system. I look at three issues below: where to find appropriate data to support the basic elements of workspace awareness, how to deal with task-specific awareness requirements, and how different collection methods affect the information.
4.4.1 Sources for general workspace awareness information The designer needs to find information that will allow people to maintain the basics of workspace awareness. This information is not necessarily directed toward any task requirement, but is available in the background to be picked up when appropriate. Of the categories presented in Chapter 3, three are fundamental parts of face-to-face environments: who, what, and where. That is, people should be able to determine who they are collaborating with, what they are doing (in general), and where they are working. Element:
Source in a physical workspace
Example source in a groupware system
Presence
Physical presence in the room
Logged into the system
Identity
Obvious from physical appearance
Name or other information must be provided by participant
Authorship
Authorship of current actions is obvious from physical presence
Actions performed at different workstations imply different authors
Action
Consequential communication and feedthrough
Consequential communication and feedthrough
Intention
Inferred from actions and context
Inferred from actions and context (although less information about actions and context is available)
Location
Where a person’s body is located
Location of any embodiment (e.g. telepointer), or location of recent action
View
Orientation to workspace and distance from it
Location and extents of viewport
Gaze
Orientation of head and eyes
The cursor may give a rough indication of gaze direction
Reach
Location and arm’s reach
Anything in view can be reached
Who:
What:
Where:
Table 3. Sources of awareness information in physical and groupware workspaces. 73
Table 3 compares sources of information from face-to-face and groupware settings. The groupware sources are not exhaustive, and are derived from what is available in a standard workstation-based groupware setup. The major difference between the two columns is that information sources in face-to-face environments are both obvious and heavily dependent on the orientation and appearance of people’s bodies, whereas groupware must make do with more indirect cues. For example, a person’s presence is obvious in a physical workspace, but must be inferred from login status in a groupware system. Also, “where” questions (location, view, gaze, reach) are generally dependent on the location and orientation of a person’s body in the physical workspace; in groupware, these elements are harder to establish unambiguously. Despite these differences, however, reasonable analogues do exist in a groupware system for supporting the basics of workspace awareness.
4.4.2 Sources of task-specific awareness information Certain kinds of joint actions in shared workspaces make specific demands on the awareness of the participants. This kind of information is not collected through low-level system events as was the general information above, but through specific events or occurrences in the groupware system. For example, if a task required interleaved actions by two people (see below), then the system would have to trap the event that signified the completion of each person’s action. Unfortunately, these events cannot be known in advance, and must be determined by the designer through experience with the task and the participants. However, designers can be on the lookout for particular types of tasks that are likely to impose specific requirements for workspace awareness. For example, I have identified three common types: unitary actions, interleaved actions, and producerconsumer situations. Unitary actions. Some actions cannot be carried out by a single person and require the simultaneous operation of multiple people (e.g. Forsyth 1983). Shared actions usually occur when the demands of the task exceed the capabilities of one person, or when 74
constraints such as time or quality dictate that more people could do a better job. For example, an object may be too heavy for one person to lift, or might be more quickly manipulated by several people. When people act simultaneously on a single object, they need detailed information about their partners’ activities. Interleaved actions. Some tasks require separate actions from multiple people, where each action is constrained by those that preceded it. A simple example is that of people building a tower of blocks, each placing the next block in turn: each person must wait until the previous action is completed before they can begin the next. Interleaved actions occur when people have divided a task (as in the blocks example), or when people are playing different roles and each have different contributions to make to the finished product. There are different kinds of constraints that actions can impose on one another. Some actions are blocked until other operations are complete, while others only need information about the nature of the prior action to proceed. Interleaved actions require people to maintain awareness of the progress, completion, and occasionally the details of others’ actions. Producer-consumer situations. In some tasks, activities are divided such that one person produces objects or information that another person consumes. For example, one draftsperson might assemble sub-drawings that another person fits into a larger plan; if the product is information, one person might give another instructions on how to carry out a procedure. In these situations, the producer has to monitor the consumer’s use, and adjust their production to fit what the consumer needs.
4.4.3 Effects of different collection methods Once a designer knows what information sources will be used to represent elements of workspace awareness, they must decide how that information will be collected. They must collect the information in a way that is appropriate to the source channel and to the element of workspace awareness that the channel represents. First, different channels have different information characteristics, such as rate of change and amount of 75
information generated by a change. For example, cursor position changes often, but login status changes rarely; a particular action may generate a large amount of data, whereas a telepointer move generates only a few bytes. Second, the WA elements represented by the channel may have particular requirements with respect to their importance or timing: for example, the departure of a group member is a more important event than a single telepointer move, but the telepointer move has stricter requirements about delay than does the departure event. These requirements are determined partly by the nature of the element, but also partly by the specific domain and task situation. To match these characteristics and requirements, the designer can change the way the information is collected. A channel can be continuously monitored, sampled periodically, or sampled upon certain events. This decision by the designer defines what a ‘moment’ is in the definition of WA: “up-to-the-moment understanding of another person’s interaction with the workspace.” In addition, the designer must consider whether the format and accuracy of the collected information are suitable for distribution or whether they must be altered or filtered beforehand.
4.5 Distribution Distributing the awareness information to other machines in the network generally implies less work for the designer than collection or display. Often, many of the aspects of distribution are handled by the underlying structures of the groupware system: for example, in GroupKit, the designer need only decide whether the information should be sent to all participants, to all but the local user, or to one specific participant (see Section 4.2). Nevertheless, there are a few distribution issues that the designer must consider; again, these issues revolve around matching the distribution to the requirements and characteristics of the workspace awareness information. Latency. Latency refers to the amount of time that display changes lag behind the occurrence of a remote event. Any communication across a network introduces some latency, but delays may be short, long, or unpredictable. Face-to-face workspace do not 76
experience these delays, since information in a physical workspace travels at the speed of light or sound. In groupware, designers must consider what the information will be used for and what delay dependencies exist. For example, actions that accompany talk are difficult to interpret if they lag behind the verbal communication, so they have a greater requirement for low distribution latency. Recipients. The designer must determine who will receive the collected information. In some cases this issue is decided by the underlying groupware tool, but in other cases there can be a computational saving in reducing the amount of communication between processes. Send frequency. The designer also has control over how often an information source is distributed to others. Information must be sent often enough to be useful at other sites, but systems must be careful to not overwhelm slower machines with too many messages.
4.6 Display After workspace awareness information has been collected and distributed, it must be displayed in the groupware interface. Once again, what is automatic in a physical environment must be explicitly managed in groupware: the designer must determine where and how to display each piece of workspace information. Display choices greatly affect how well awareness can be maintained. As Endsley (1995a) says, “the way in which information is presented via the operator interface will largely influence [awareness] by determining how much information can be acquired, how accurately it can be acquired, and to what degree it is compatible with the operator’s [awareness] needs” (p. 50). In display, a designer must support the activities of the perception-action cycle, for the groupware system’s interface is the whole environment for the user. That is, at each site in the groupware system, each person will engage in a separate cycle of gathering information from the interface, interpreting the information, and exploring the interface. Below, I consider some basic issues of where and how to display workspace
77
awareness information, and then look at how display can aid users in maintaining WA through the perceptual cycle.
4.6.1 Dimensions of display space A designer faces basic questions of where and how to display workspace awareness information in a groupware interface. I have determined two basic dimensions that provide boundaries for some of these questions. First, when considering where information will be displayed, the dimension of placement draws a basic distinction between information that is situated within the workspace and information that is presented separate from it. Situated placement implies that the information is displayed at the workspace location where it originated, and separate placement means displaying the information outside the workspace in a separate part of the interface. Second, the issue of how information will be displayed suggests the dimension of presentation: a display can be either be literal or symbolic. Literal presentation implies that the information is shown in the same form that it is gathered, and includes low-level movement and feedback. Symbolic presentations extract particular information from the original data stream and display it explicitly. These two dimensions combine to form the matrix shown in Figure 17. Placement Situated
Separate
Literal
Presentation
Symbolic
Figure 17. Presentation and placement of awareness display techniques.
78
These two dimensions roughly divide the design space of workspace awareness displays. These concepts will be used to organize the example displays shown in Chapter 5. There are, however, several other aspects to presentation. A designer must match a variety of display characteristics to the qualities of each information stream (although this process is more feasible for task-specific information than for general WA information). Three characteristics that affect workspace awareness information are salience, update frequency, and granularity. Salience. This characteristic is the degree to which changes in the information stream will draw the attention of the user. Salience in the display should correspond to the importance of the information (or, the importance of knowing that it has changed). If the channel’s salience is less than the information’s importance, then information will be missed; if salience is greater than importance, then the display will be distracting. Salience is affected by a number of factors, including size of the representation, proximity to a person’s focus, the use of colour and motion, and people’s existing knowledge (see Section 2.2.2). Update frequency. The rate at which a display is updated should match the sampling requirements of the activity—that is, things that need to be checked often should be updated frequently, and things that need only occasional attention can be updated infrequently. This characteristic should correspond to the sampling rate at which the information was collected (see Section 4.4.3). Update frequency applies primarily to continuous (or quasi-continuous) variables such as cursor or object movement, since information streams that change only sporadically can generally be updated whenever they change. Granularity. Display granularity should match the grain size at which the information is used. For example, some tasks require that people maintain only a general idea of others’ locations, and others require detailed knowledge. Display granularity can be manipulated by changing a graphical display’s resolution or representation.
79
The ‘values’ that a designer assigns to each of these characteristics will depend upon the requirements of the task, the group, and the domain. However, awareness needs change during the course of an activity, and so making too many assumptions about the characteristics is unwise. In general, the qualities of required awareness knowledge are easier to determine and will change less often. The qualities of general WA information (that is, useful but not required) are more difficult to characterize, and so should be given a more subtle presentation.
4.6.2 Supporting the perception-action cycle in display Gathering perceptual information from the interface People will gather perceptual information from an interface, much as they gather it from a physical environment. The effort required to gather a particular piece of awareness information is its acquisition cost. If the information that they need is easy to obtain, then acquisition cost is low and maintenance of WA is easier. If the information can only be seen by issuing a series of commands to the system, then acquisition cost will be high. I discuss two display principles below that can reduce acquisition costs, principles that are part of the information-landscape approach presented earlier. Continuous presentation: An integral part of the idea of a landscape is that it is always there in the background. It is a resource that people can take information from, but one that they need not attend to all the time. Continuously-available information reduces acquisition costs since a person has only to shift their gaze to another part of the display. Continuous information also guarantees that when another person does something interesting, the information will be available to others. If information is not always there, and must be explicitly summoned, participants have to know ahead of time when interesting events are going to take place. A third advantage of continuous presentation is that people can acclimatize themselves to the information stream. As in physical settings, people can ignore the landscape during focused individual work, but still observe patterns or critical events that indicate the need for closer attention. The cost of continuous 80
presentation, on the other hand, is that screen space is taken for information that is not always in use. Literal presentation. The actual movements and detailed actions of other participants are a rich source of WA information and the vehicle through which consequential communication (see Chapter 3) can occur. Literal information is easy to gather using perceptual skills that are well-practiced in face-to-face environment. If literal presentation is used, then other display techniques that further enrich the landscape are made possible. For example, workspace representations and embodiment can be made more expressive, and direct manipulation can be used to interact with the artifacts in the workspace.
Interpreting perceptual information The way that information is presented can greatly affect the amount of mental effort required to make sense of the information. This mental effort is interpretation cost. Where displays show information in a form that is familiar and easy to use, interpretation costs are low. If the display uses formats that have nothing to do with the task, and present information that must be converted mentally before it can be used, then interpretation costs are high. The conceptual framework sets out four kinds of knowledge that people use to aid interpretation of perceptual information (see Section 3.4.2), and parts of these contexts can be conveyed through the groupware interface. Below, I discuss four display principles that can aid interpretation: situating information in the workspace, providing spatial and temporal context, using formats defined by the task situation, and using formats that match people’s awareness needs. Situate information in the workspace. By presenting WA information in the workspace, designers can make use of people’s existing knowledge of that space. The workspace is already a familiar place to groupware participants, since they interact with it to do their individual work. Existing knowledge about the workspace can therefore be used to help interpret situated presentations of WA information. This principle was previously suggested by Dourish and Bellotti (1992), who called it shared feedback: “presenting 81
feedback on individual users’ activities within the shared workspace” (p. 112). Both consequential communication feedthrough lend themselves to situated presentation. That is, people’s actions and the feedback from those actions already happen within the workspace, and so it seems natural to present those events to others in the place where they occur. Provide temporal and spatial context. A consequence of situating information in the workspace is that information should be displayed in an appropriate temporal and spatial context. This means that actions should be observable as they unfold over time, and that they should be seen in relation to relevant objects and workspace landmarks. Without spatial context, deixis is more difficult, and actions and gestures are harder to relate to the objects that are being manipulated. Temporal context implies showing the intermediate states of an activity, and using an appropriate update frequency. Some kinds of actions, such as gestures, require a certain temporal resolution to be properly interpreted. Use formats defined by the task. If people traditionally relate to awareness information in a particular way, then following those traditions in the interface will reduce interpretation costs. For example, if an editing task is structured so that people generally think of locations as section numbers in a document, then presenting locations as page numbers will require people to translate the information before they can understand it. Use formats that match awareness needs. One of the design principles presented by Endsley (1995a) for situation awareness displays is to present information in the form that it will be used. This approach can also be applied to workspace awareness displays, although with a few caveats. The difficulty is in determining beforehand what a person will use workspace awareness knowledge for, especially awareness that is useful but not required. This uncertainty implies that a designer will have difficulty presenting awareness information as ready-made knowledge in the form that people need. Nevertheless, the general principle can still be used. For example, when different pieces of information are used together, they can sometimes be integrated in a single display (e.g. Wickens 1992). 82
Further exploration of the interface Usage cost is the amount of effort required to use workspace awareness information, either in further exploration of the environment or in taking action. There are two general principles that can lower usage costs. Depth of detail. Awareness displays should allow people to gather additional information related to a particular event. Since peripheral observation of an event often leads to closer attention, displays should be able to provide additional detail upon inspection. If I see a particular action that piques my interest, I should be able to find out who is behind the action and what they are doing, without going through a complicated dialogue with the system. Action in context. Displays should allow people to take action based on the awareness information that they gather. Taking action in a physical workspace is simple: for example, if I see that someone requires assistance, it is easy to go to where they are, help them with their local activity, and return to my own work. This kind of behaviour is often more complicated in a groupware environment, where moving around in the workspace can be more difficult than in the physical world. Nevertheless, facilities can often be found to simplify actions that arise from information in the interface.
4.7 Summary This chapter has looked at design issues involved in supporting workspace awareness in shared-workspace groupware. Support for awareness is needed in groupware for two reasons. First, groupware technology hinders the maintenance of awareness: groupware systems reduce perception of the workspace, and reduce the expressiveness of bodies and workspace artifacts. Second, computational workspaces are synthetic environments, and nothing exists in them without design. Therefore, designers must take on the tasks of collecting, distributing, and displaying any workspace awareness information that is to be part of the system.
83
Collection of information requires that the designer match elements of workspace awareness to appropriate information sources in the groupware system. Distribution is often a simple task taken care of by the underlying architecture of the system. Finally, display choices greatly affect people’s abilities to maintain workspace awareness. The design space can be roughly divided using two dimensions: placement (situated or separate) and presentation (literal or symbolic). Several display principles can help people to maintain awareness using the activities of the perception-action cycle. Many of these principles are part of the information-landscape approach to managing workspace awareness information. 1. Gathering perceptual information from the interface: • Present awareness information as a continuous stream • Present literal information when possible 2. Interpreting perceptual information • Situate information in the workspace • Provide temporal and spatial context • Use formats defined by the task • Use formats defined by awareness needs 3. Using awareness information • Provide depth of detail • Allow action in context This ends the first part of the research process. Chapter 3 operationalized the concept of workspace awareness at a high level, indicating what information should be included in the interface, mechanisms for maintaining awareness, and situations where workspace awareness is used in collaboration. This chapter provides a second level of operational detail, considering the specific steps a designer must take to add support for workspace awareness to a groupware interface. The next two chapters look at application, the next part of the research process. They apply these ideas to the design and construction of workspace awareness displays. I have designed a variety of display techniques and built several specific displays that support various aspects and elements of workspace awareness. In Chapter 5, I present a number of different displays, organized around the principles of placement and presentation. In Chapter 6, I look more closely at the evolution of one display called the radar view. 84
Chapter 5
Workspace awareness displays
The second part of the research process is the Operationalization
application of workspace awareness to the design of groupware interfaces. This chapter explores the
Evaluation
design space of workspace awareness displays. I discuss display techniques and approaches, and Application
show examples of particular solutions to the design problems presented in previous chapters.
These examples are drawn both from my original design work, and also from existing systems and prior research. Original displays are all built using the GroupKit groupware toolkit (Roseman and Greenberg 1995). I use two dimensions of the design space, introduced in Chapter 4, to group the displays: placement and presentation (see Figure 18). The placement of a display can be either situated in the workspace or separate from it. Situated placement implies that information is displayed at the workspace location where it originated, and separate placement means that information is displayed outside the workspace in a separate part of the interface. Second, the display’s presentation can either
Placement
be literal or symbolic. Literal presentation
Situated
implies that the information is shown in the same form that it is gathered, and includes low-level movement and feedback. Symbolic
Separate
Literal Presentation Symbolic
presentations extract particular information
Figure 18. Dimensions of design
from the original data stream and display it
space.
explicitly. Figure 19 presents a preview of the display techniques in this chapter. I first look at situated approaches, with both literal and symbolic presentation. I focus on ways to 85
increase the information provided by workspace embodiment, actions, and artifacts. These techniques address each of the areas where groupware hinders the maintenance of workspace awareness. Situated and literal techniques are closely aligned with the display approach introduced in Chapter 4, as these support the maintenance of WA through consequential communication and feedthrough. Situated and symbolic techniques are useful when no literal information about a person or an action is available to the system. Since situated techniques require that the part of the workspace showing the information be visible to the viewer, the second part of the chapter discusses strategies for making the workspace visible in addition to the techniques themselves (Section 5.2). Third, I look at separate symbolic displays. Although these displays lack the context provided by a situated placement, they are useful in some situations. Separate-symbolic displays can show the basic elements of WA information, and can also show abstract relationships that are difficult to observe in literal presentations. I consider two kinds of abstract relationship: those dictated by specific demands of the task, and temporal relationships that illustrate WA elements over time. WA display techniques
5.1 Situated techniques 5.1.1 Embodiment
5.1.2 Making actions perceivable
5.1.3 Expressive artifacts
Telepointers
Action feedthrough
In-use indicators
View rectangles
Process feedthrough
Authorship indicators
Avatars
Action indicators
Past use indicators
Video embodiment
Action animation
Sound cues
5.2 Workspace Visibility
5.3 Separate-symbolic techniques
5.2.1 Overviews
5.3.1 Basic WA information
5.2.2 Detail views 5.2.3 Focus+context views
5.3.2 Arbitrary relationships
Figure 19. A preview of the techniques that will be discussed. 86
The awareness displays presented here are, for the most part, designed for groupware that uses existing mouse-and-windows technology. I will occasionally look at nonstandard solutions that have proven to be particularly effective (e.g. Section 5.1.1), but I am primarily concerned with systems that use standard workstations, basic input devices, and graphical monitors for display. This configuration will be the standard for groupware applications for some time to come. Many of the design issues and display solutions discussed here do have currency in more complex setups with integrated video, wall-sized displays, and virtual reality hardware. However, discussion of these environments is beyond the scope of this dissertation. I illustrate the awareness displays in a variety of groupware applications. Several displays are illustrated using two systems in particular. The first system is a shared editor for laying out newspaper pages (e.g. Figure 31). In this system, the workspace corresponds to a two-page newspaper spread, and the artifacts in the workspace are columns of text, pictures, and story headlines. The newspaper editor is also used in the usability study of Chapter 8. The second system used in this chapter is a groupware concept-map editor (e.g. Figure 45). The system allows users to create labeled nodes, move and edit them, and connect nodes to signify relationships between concepts. I use the following conventions in figure captions to indicate the implementation status of displays presented in this chapter. First, if no note appears in the caption, then the display is a fully-implemented system in GroupKit. Otherwise: •
A prototype is a working implementation, but one that is unpolished.
•
A recreation is a picture drawn of an implemented system. The picture is used to show aspects of the system that would be difficult to see using screen snapshots.
•
A mockup is an unimplemented drawing of a display idea.
•
If a reference is given, the display is taken from prior research.
87
5.1 Situated techniques Information in a face-to-face workspace is both situated, as it originates from within a spatial context in the workspace, and literal, as it is raw, uninterpreted perceptual information. These two qualities can be applied to the presentation of workspace awareness information in groupware interfaces as well. The techniques in this section attempt to follow the lead of physical workspaces. As introduced above, situated techniques display awareness information at the place in the workspace where it originates, and literal techniques present the information in its original form. That is, the location and form of the displayed information will be similar to the location and form of the source of that information. In some cases, however, literal information is difficult to obtain, and so I will also discuss situated and symbolic techniques. Situated techniques follow the basic assumption of Chapter 4, that people should be able to maintain workspace awareness using many of the same mechanisms that they already know from face-to-face work. This means providing information about bodies, actions, and artifacts in the workspace. This information lets people watch each other work, lets them see the effects of each others’ actions, and lets them communicate through the workspace. The following three sections look at ways to increase the expressiveness of embodiment, workspace actions, and workspace artifacts over what is currently done in groupware.
5.1.1 Embodiment A workspace embodiment can provide information about who is in the workspace, where they are, and what they are doing, and can afford both consequential and gestural communication. Although the limits of conventional input devices constrain expressiveness, as discussed in Section 4.1.2, embodiment can still be realized. Since interaction with computational artifacts is generally more restricted than interaction in the physical world, even a few degrees of freedom can allow people to convey a lot of information. Therefore, maximizing the information gathered from computational 88
interactions can go a long way in helping people maintain workspace awareness. Below, I compare four forms of embodiment that can be used in shared workspaces—telepointers, viewports, avatars, and video images—and discuss what WA information can be provided through them.
Telepointers Telepointers in groupware can go well beyond their basic function of indicating a location in the workspace. The function of a mouse pointer in a single-user application is simply to mark an x-y location, but in a groupware application, telepointers provide people with a workspace embodiment. In addition to location information, telepointers provide implicit information about presence and activity. Presence is indicated by the existence of the telepointer: if there’s a telepointer, then there’s someone behind it who is logged into the conference. By watching the telepointer move, a person can also determine that there is activity going on, the rate of activity, and often the type of the action as well. All of this is conveyed simply by an ordinary telepointer, as long as it can be seen in the workspace. Since a telepointer is often a person’s only representation in the workspace, it would be useful to convey other WA information through it. In particular, telepointers can be made more expressive by overloading them with identity and activity information. Identity information is required when there are more than two people in the workspace. Being able to identify the people behind workspace embodiments is crucial for determining who is who in the workspace, and for determining the authour of particular actions and changes. Identity information can be added to a telepointer in several different ways. Figure 20 compares four methods: colour, names, pictures, and abstract icons.
89
Carl
Saul
Figure 20. Four identification methods: colour, nametag, portrait, icon (recreation). Of these four methods, colour is the least intrusive; the others all require additional screen space and use additional objects that may clutter the display. However, names and pictures have lower interpretation cost than colour or abstract icons; these require that people remember a mapping between people and abstract information. In addition, portraits could also become live or periodic video images to give an even better idea of who is behind the telepointer. Telepointers also play a major role in conveying what a person is doing, primarily by showing the characteristic motions of the action as it progresses. However, people in face-to-face settings also use other information about a person’s body to determine their activities. One common cue is the tool that a person is holding: for example, seeing that someone is holding a hammer gives a good indication of their recent or imminent actions. In this case, the hammer is not strictly part of the body, but there is a strong enough connection to consider it a logical extension of the body rather than as merely information about an activity. Groupware systems such as drawing programs often use computational tools to manipulate workspace artifacts, and telepointers can be changed to indicate the tool that each person has chosen. For example, Groupsketch (Greenberg and Bohnet 1991) had tools for drawing, erasing, typing, and pointing, and when a person chose a tool, their cursor on all displays changed to an icon of the tool (see Figure 21). In fact, showing tools may be necessary for the correct interpretation of actions performed with the tool (see Section 5.1.2).
90
Figure 21. Groupsketch, showing mode-specific telepointers (Greenberg et al 1991).
Viewports and view rectangles If people interact with the workspace through viewports, then the viewport can be part of a person’s workspace representation. Once again, the viewport is not technically part of a person’s body: as Smith (1992) says, “we don’t normally project a ‘cone of vision’ out into the world so that people can tell what objects are within our gaze” (p. 20). However, the orientation of a person’s head and body in a face-to-face setting does in fact indicate what a person can see, and the viewport is useful as an indirect representation of those perceptual extents. In particular, it indicates three elements of WA that are normally conveyed by the body: where in the workspace a person is working (location), what they can see (view), and what they can manipulate (reach).
91
People’s viewports can be represented in the workspace so that others can see them. As viewports are generally rectangular, these representations are often called view rectangles. The most basic method for displaying them is simply to superimpose a rectangle on the objects in the workspace. For example, Figure 22 shows the GroupDesign system (Beaudoin-Lafon and Karsenty 1992). In the figure, the window at right (Christophe) shows two other people’s viewports as shaded rectangles. The two other windows (Alain and Michel) do not show others’ viewports. Since this approach only shows another person’s view rectangle when their view intersects with the local user’s, the primary use of this approach is to indicate what objects both users can see at the same time. If an object appears within another person’s view rectangle, then they can see that object in their view. When views do not intersect, other view rectangles will not be seen. However, if a secondary representation of the workspace is available that shows a greater area than the main viewport, then view rectangles can be seen regardless of their location. One way that this can be done is by using an overview of the workspace, as described later in
Figure 22. Viewport rectangles in the GroupDesign system (Beaudoin-Lafon and Karsenty 1992). 92
Section 5.2.1.
Avatars Even though a mouse is the only spatial input in a standard groupware system, embodiment can take other forms than telepointers. One technique borrowed from virtual reality systems (e.g. Benford et al 1995) represents people as avatars, stylized pictorial representations of each person in the conference. Avatars provide a humanlike “body” on which identity information and some kinds of gesture are more easily interpreted. So, instead of a telepointer with a name tag or portrait trailing along behind it, avatars provide an embodiment that looks more or less like a person, that can have a recognizable face, and whose actions in the workspace are carried out by a “hand” at the end of an “arm,” rather than an essentially disembodied telepointer. Figure 23 shows a mockup of a workspace where the three remote participants are represented by avatars. The avatars are simplistic shapes, but have faces and names, and manipulate objects on the “table” with a hand controlled by the mouse. As people move around in the workspace, their avatar moves around the perimeter of the table. When they enter or leave the conference, they do so through the ‘door’ (upper left). To gain the realism needed by this approach, a perspective view is used to represent the workspace. The shift from two dimensions to three also allows avatars an additional degree of freedom compared with a telepointer, if a 3D input device is used.
93
Carl
Saul
Ted
Figure 23. Avatars in a simulated tabletop workspace (mockup). With a standard workstation, these avatars provide no more information than a telepointer and a view rectangle, but it may be that they package it in a more understandable way. This benefit, however, requires considerable screen space, and reduces the amount of area for workspace detail and individual work. The richer sense of presence created by techniques like avatars must be weighed against the requirements for individual
Figure 24. Shadow (left) and local user (right) in VideoWhiteBoard (Tang and Minneman 1991). 94
workspace interaction.
Video embodiment Although video techniques go beyond the standard technical setup of most groupware systems, it is worth noting several research systems that provide particularly effective embodiment in shared workspaces. These systems, introduced in Chapter 4, combine video images of people in the conference with the representation of the computational workspace. Video techniques provide a far more realistic and flexible workspace representation than anything described above. There are a several different ways that video can be used. First, with large display devices, silhouettes or shadows of people’s bodies (Figure 24) can be represented on the workspace (e.g. Tang and Minneman 1991). Shadows do not show a lot of detail, but indicate workspace location and arm movement (see Figure 24). Second, full-fidelity video of arms and hands can provide detailed information about actions and movements (e.g. Tang and Minneman 1990). This allows a full range of motion (and two hands if needed) for gesturing over the artifacts in the workspace (see Figure 25).
Figure 25. Video hands in VideoDraw (Tang and Minneman 1990).
95
Third, full-fidelity video of the entire upper body (Figure 26) can show arms, hands, and faces (e.g. Ishii et al 1992). In certain setups, this can allow eye contact with a remote participant and provides information about where they are looking (see Figure 26). As discussed in Chapter 4, however, these techniques require sophisticated equipment, and may not scale well to larger workspaces and larger groups.
Summary—embodiment
Figure 26. ClearBoard, showing video image of remote user (Ishii et al 1992). 96
Embodiment provides a workspace representation for each person in a groupware system. Table 4 summarizes the ways that four methods of embodiment—telepointers, view rectangles, avatars, and video techniques—convey different elements of workspace Element:
Telepointer
View rectangle
Avatar
Video image
Presence
existence of telepointer
existence of view rectangle
existence of avatar
existence of video image
Identity
colour, name, portrait, abstract icon
colour, name, colour, name, portrait, full video image identifies portrait, abstract icon abstract icon the person; less obvious with partial video or silhouette
Who
proximity of the Authorship telepointer to an action
actions within a view proximity of the rectangle are initiated avatar or their ‘hand’ by that person to an action
people can be seen executing actions
What Action
movement of the show navigation telepointer shows actions only actions in progress
movement of the avatar’s body or arm shows actions in progress
people can be seen executing directmanipulation actions
Intention
prediction based on motion
prediction based on motion
prediction based on motion and other bodily information
Artifact
proximity of telepointer to artifact
proximity of ‘hand’ to proximity of video hand to artifact artifact
Where avatar indicates coarse workspace location; ‘hand’ shows finegrained location
full video images indicate general location; video of hand or direction of gaze indicates specific location
gaze often follows gaze is likely telepointer somewhere within the view rectangle
gaze is likely within view, may be following hand
eye-contact video shows direct representation of gaze; gaze also often follows hand
telepointer is view rectangle always within the extents are equal to view view extents
area in front of avatar area near video image or area where a person is looking
Location
telepointer indicates finegrained location in the workspace
Gaze
View
Reach
view rectangle indicates coarsegrained workspace location
people can normally people normally reach arm’s reach for objects near their reach for things avatar inside the view rectangle
Table 4. WA information provided by four kinds of embodiment. 97
awareness. Embodiments can convey information about who is in the workspace, where they are, and what they are doing; therefore, the table concentrates on who, what, and where categories.
5.1.2 Making actions perceivable Actions in shared workspaces are often difficult to perceive. There are three reasons for the difficulty. First, actions are not as noticeable as they are in physical workspaces: the limited freedom of the mouse implies that people make fewer obvious characteristic actions, and the presence of symbolic commands like menus and control keys mean that some actions have no workspace representation at all. Second, many actions look similar (e.g. actions that select an object and then execute a command), and so are hard to distinguish from one another. Third, actions can happen almost instantaneously, leaving little warning of their occurrence and little time to see and interpret them. Each of these problems, however, can be addressed. I outline three methods below: showing action feedthrough can aid interpretation of direct-manipulation actions; showing process feedthrough can provide some information about symbolic commands like menu choices and keypresses; and showing action indicators and animations can create synthetic feedback from symbolic actions.
Action feedthrough Direct manipulation is the most perceivable kind of action in a shared workspace, as long as intermediate states are transmitted to others, and as long as others can see the action. However, even when these steps are taken, in many cases information crucial to interpreting the action is not transmitted to remote participants. All of the local feedback that helps a user complete a direct-manipulation action can also help others recognize and interpret that action. This kind of feedback is action feedthrough. For example, a crop tool in an image-manipulation application shows a temporary rectangle to the local user, indicating the area selected for the crop operation. If this rectangle is not shown on
98
remote screens, then remote participants will have difficulty determining what operation is being performed with the tool.
Process feedthrough Symbolic command through menus or keypresses are also common actions in computational workspaces. These actions are inherently less perceptible than direct manipulation, but are sometimes necessary. In some cases, an action may be difficult or impossible to accomplish through direct manipulation, and for some tasks, there are simply too many kinds of operations to turn them all into direct-manipulation tools. Symbolic actions typically have very little workspace representation, but they need not be invisible. When the process of selecting an operation or command provides feedback, this information can be transmitted to other people to help them determine what is about to happen. This is process feedthrough. Menus, for example, provide this kind of feedback. Figure 27 shows a popup menu that is automatically shown on other screens, and that displays the process of choosing a symbolic command. There are three variants of the popup, although the figure illustrates only the first two. The first variant reproduces the entire remote menu and all of the remote user’s mouse movements on it. The second shows the extents of the menu as an empty rectangle, and shows only the item that the remote user’s mouse is currently over. This version is useful when a large menu would hide too much of the local user’s view. The third variant provides only the minimal information. It does not show intermediate selections, but only that the remote participant is using a menu, and when they have made a choice, what item was chosen. In Figure 27, the picture at left shows the fully-reproduced menu (which is the same as what the local user sees), and the picture at right shows only the menu extents and the intermediate selection.
99
Figure 27. A remotely visible popup menu (recreation). Other types of commands also provide process feedback, and the same technique can be used to make them more visible. For example, a symbolic command may open a dialog box for entry of additional information, such as the scale factor in a resizing operation. Although it may require too much space to reproduce the entire dialog on remote screens, a summary representation could indicate the state of the current activity or the values of particular fields.
Action indicators and animations Some commands, however, do not provide any process or action feedback. When someone presses the ‘delete’ key to remove a selected object, the operation is nearly instantaneous and there is no intermediate information that the system can transmit to others. In these cases, the system cannot make the action itself more noticeable or distinguishable. However, it can create an artificial signal for the action, and this action indicator can be given a more perceptible workspace representation. For example, a simple approach to showing the ‘delete’ operation is illustrated in Figure 28. When a node in this concept-map application is deleted using a keyboard command, the application creates an action indicator on remote screens and displays it for a moment before removing the object. This technique gives the rest of the group information and time to interpret the sudden disappearance of the object from the workspace.
100
Figure 28. Symbolic delete indicator, during and after delete (recreation). Although this solution is an improvement over no action representation, it still has a fairly high interpretation cost. A remote user still has to see and read the indicator, and if several actions are represented the same way, distinguishing between them may still be a problem. An alternate approach that can mitigate these problems is to have the artifact itself help to indicate the action by ‘acting it out.’ When actions cause a visible change in the artifact, these changes can be made more perceptible even if the action is invisible. By changing what in the real world would be a characteristic motion to become an invented characteristic behaviour of the artifact, an action can be made implicitly noticeable and distinguishable. Figure 29 shows this approach in a concept-map system. When a node is deleted, it does not simply disappear, but swells up for a moment before gradually fading away (the supernova effect). Although the delete action is still invisible, the effects of that action have been drawn out and made more noticeable.
101
Figure 29. “Supernova” animation of a delete action (recreation). This approach builds on the observations of Ellis, Gibbs, and Rein (1991) that others’ actions are inherently more difficult to interpret than your own, and that smooth animation of changes can aid interpretation. The extra step here is to allow that behaviours can also be invented and embellished for the purpose of indicating action. Different animation effects might be required, of course, depending on the importance of the action and the constraints of the task. One open question with animation techniques is whether an effect like the supernova-delete should be shown in the local user’s workspace as well. The local user doesn’t need the extra feedback, since they presumably already know what they’re doing. However, not doing so could lead to confusion unless the participants know ahead of time that representations will be different. This problem fits with the larger issue of how differences in representation affect awareness (see Section 4.1.1).
Summary—making actions perceivable Actions in computational workspaces often happen too quickly, are hard to see, and are hard to differentiate. I introduced three ways for making actions more perceivable. Showing action feedthrough displays visual feedback that the system provides the local user during direct-manipulation actions (such as the temporary ‘rubber-band’ rectangles used to select multiple objects). Showing process feedthrough displays intermediate steps in carrying out symbolic actions (such as menu choices) or relevant information in a 102
dialogue with the system. Action indicators and action animation are synthetic feedback that stretch out an instantaneous symbolic command and makes it more perceivable. Action indicators display a marker showing the type of activity. Action animations have the artifact ‘act out’ the command in a meaningful and noticeable way. Table 5 summarizes the workspace awareness information shown by these techniques for each of the ‘what’ elements (action, intention, and artifact). Element:
Action feedthrough
Process feedthrough
Action indicators
Action animations
Action
all local feedback from an action is distributed
shows intermediate steps in symbolic actions
marks symbolic commands after they occur
Artifacts ‘act out’ a symbolic command
Intention
greater feedback about current activity helps people predict intention
greater feedback about current activity helps people predict intention
intention not supported as indication is shown after the command occurs
intention not supported as animation is shown after the command occurs
Artifact
proximity of visual feedback to an artifact indicates that it is in use
proximity of process feedback can indicate that it is in use
proximity of the indicator to an artifact indicates that it is in use
The acting artifact is the one being manipulated
What
Table 5. Workspace awareness information shown in expressive-action techniques
5.1.3 Making artifacts more expressive Feedthrough is tremendously important for the maintenance of workspace awareness. As discussed earlier, most groupware systems do not distribute the feedback that artifacts provide to the local user. However, here I will only discuss techniques that go beyond the basic level. I assume that whatever the local user sees, the remote users will see as well, including indication of selection and the display of intermediate states of operations. Beyond these basics, artifacts can also display information about whether they are in use, who is working on them, and what has happened to them in the past. I also discuss the use of sound cues as an additional channel for feedthrough information.
103
Expressing information about in-use artifacts When objects are being used or are reserved in some way, they can indicate that they are unavailable to others. In many cases, ordinary indications of selection are enough to tell others that an object is in use. In some workspaces, however, dependencies between artifacts imply that several objects are reserved when only one is selected; in others, participants may be allowed to reserve several artifacts at once. In the Calliope text editor (Mitchell 1996), people can lock words, sentences, or paragraphs at a time. In Figure 30, two users have applied different locking levels: one is using word-level locking (on the word “take”) and the other is using paragraph locking (on the bottom paragraph). The reserved text is indicated by a box surrounding the appropriate words.
Figure 30. In-use indication in the Calliope text editor (Mitchell 1996). This idea of marking reserved objects can be extended. People can also mark objects to communicate other intentions to the group. For example, Figure 31 shows a newspaperlayout system where people can mark the articles and stories that they are planning to use in the near future. The objects indicate this intention with a yellow outline. The objects are not locked, and others can manipulate them, but the visual indication helps people to know each others’ plans and may simplify later coordination. When the objects are moved, the mark disappears.
104
Marked items
Figure 31. Newspaper application with objects marked for later use (prototype)
Expressing information about authorship Feedthrough can also provide authorship information, important if there are more than two people in the workspace. As mentioned above, proximity of an action to a telepointer or other embodiment can suggest authorship, but when actions happen outside the local viewport, more pervasive information may be required. As with embodiments, there are several ways to identify the person behind an action, including colour, name, and portrait. For example, an artifact could change colour to that of the person making the change, or could display the person’s name. The Calliope text editor in Figure 32 (Mitchell 1996) shows the text entered by each person in a different colour.
105
Figure 32. Text colour indicates author (Mitchell 1996). Even with only two people in the workspace, feedthrough must be designed so as not to confuse the local user. That is, it must be clear what is local feedback and what is remote feedthrough. One solution for displaying local and remote selections is to show them in different colours: black for the local selection, and each remote participant’s chosen identifying colour for remote selections.
Expressing information about the past The techniques described above for indicating an action’s authour really just annotate an artifact with symbolic information, and there are many other kinds of information that can be conveyed in this way. One kind is information about the past use of the artifact. For example, artifacts can record and display the amount or frequency of changes made to them. This approach was first used by Hill et al (1991) to show “edit wear” and “read wear” on objects (see Figure 33). Each time an object is used, its workspace representation becomes darker.
106
Figure 33. Spreadsheet cells showing edit wear and read wear (after Hill et al 1991). There is no real limit to what temporal information can be attached to a workspace object. An artifact could show the amount of time since it was last manipulated, who was the last person to change it, or how often it has been changed recently. The need for this type of information, however, must be dictated by the task. Also, there is limited display space in an artifact, and there are limitations to our abilities to perceive and differentiate symbolic attributes such as colour. Therefore, the amount of information that can be attached to an object is limited before the display becomes cluttered and difficult to interpret.
Expressing information through sound cues Sound can be a useful addition to artifact and action feedthrough. Sound is not an additional type of information, but rather an additional channel through which to convey information. In some cases, awareness information presented through sound will reinforce visual information on the screen, but it can also be used on its own, especially when screen space is limited or the information is of a peripheral nature. Sound can be used to convey several kinds of information about artifacts, events, and actions (e.g. Gaver 1988, Blattner et al 1989). These include the occurrence of an event, the type of the event or action, the duration of an activity, the details of the action, or the characteristics of an artifact being manipulated. 107
•
Occurrence of an action or event. Sounds have long been used to mark the occurrence of an event or the presence of a particular state. For example, alarms in control systems indicate faults or hazardous conditions, and beeps in computer applications can indicate inappropriate actions such as trying to drag past the end of a document.
•
Type of action. Different sounds can also help people differentiate between different kinds of events. For example, “earcons” (Blattner et al 1989) are short musical signatures corresponding to certain events in computer systems, such as the creation or deletion of a file.
•
Duration of action. The length of a sound can indicate the duration of an activity or an operation. For example, when files are copied using the SonicFinder (Gaver 1988), the system plays a sound during the entire progress of the copy operation.
•
Details of the action. In addition to duration, other details of an activity can be represented in qualities of the sound. For example, in the file-copy action above, the pitch of the copy sound is used to indicate the amount remaining to be copied: higher pitches indicates less of the file remaining to be copied (Gaver 1988).
•
Characteristics of the artifact being manipulated. When actions are performed on an artifact, the sound of the action can also represent characteristics of that artifact. In the SonicFinder, user files sound like they are made of wood, and applications sound like they are made of metal. Therefore, when a user file is selected, it makes a woodensounding “thunk”; when an application is selected, it makes a metal-sounding “clank.” In addition, the pitch of the “thunk” or “clank” reflects the size of the file or application, with deeper sounds indicating larger objects (Gaver 1988).
Like visual displays, different auditory presentations have different interpretation costs. Three types of sound that have different costs have been considered. These are abstract sound, metaphoric sound, and everyday sound. •
Abstract sounds represent things with arbitrary notes or waveforms. For example, some earcons used arbitrary 3-note phrases to signify events. Although abstract 108
sounds can represent any type of event, they require that people explicitly learn the mapping between the sounds and the events. •
Metaphoric sounds try to suggest the event through some auditory quality. For example, a tone that fades away might be used to indicate a delete operation, using an analogy “between deletion and quieting, or fading into the distance” (Gaver 1988, p. 64). Metaphoric sounds provide more information about the type of action than do abstract sounds.
•
Everyday sounds further reduce the interpretation cost of a sound by using mappings that people already know. That is, they use the sounds of real-world equivalents to computational actions. For example, dragging a file across a computer’s desktop might produce a scraping sound, similar to that made by sliding a piece of paper across a real desk. Everyday sounds are generally easy to interpret, but the range of computational actions that correspond to everyday sound is limited. For example, there is no everyday sound for common operations like “show properties” or “duplicate.”
As an example of everyday sound, Figure 34 shows the SonicFinder (a version of the Macintosh Finder). In the figure, a file is dragged to the trashcan, and produces different sounds when it is (a) selected, (b) dragged, (c) moved over the can, and (d) finally dumped. Sound cues have primarily been used in single-user software, but a few kinds of multiuser systems have employed auditory information to provide information about others. Many of these are multi-player games (e.g. Doom). In groupware research, SharedARK (Smith et al 1989; Smith 1992) is exemplary in its use of sound. The system is a multiuser physics construction microworld, where “sound is made by activities such as dropping objects, activating processes, or pressing buttons,” and “a user is made aware of the activity of collaborative partners simply by overhearing the clicks, bumps, and hums caused by their work, which are audible even when collaborators are off screen.” (Smith 1992, p. 19). In one experiment with SharedARK, the ARKola system (Gaver, Smith, and 109
Figure 34. Dragging a file to the trash in the SonicFinder (Gaver 1988). O’Shea 1991) attached auditory icons to the simulated machines in a simulated bottling plant. The sounds indicated whether the machine was running normally, overflowing, or broken. The machine sounds were useful in helping people understand what was going on in another person’s part of the plant. The visibility problem in groupware workspaces provides an opportunity for sound cues to be more useful than they are in a single-user system, where sound is generally redundant to visual information. When actions happen in unseen parts of the workspace, sound can convey information that might otherwise go unnoticed. The recent appearance of toolkits for three-dimensional sound localization suggest that in addition to the uses described above, workspace sounds could also indicate where in the workspace an action is occurring and how far away from the listener it is.
Summary—expressive artifacts Artifacts can be made more expressive than they currently are. Expressive artifacts show additional information about others, and can use a variety of perceptual channels to do so. 110
The primary requirement for an expressive artifact is that it shows basic feedthrough—the intermediate states that it goes through when manipulated. In addition to basic feedthrough, there are several kinds of information that artifacts can express. Three of these are indications of use, indications of authorship, and indications of how the object has been manipulated in the past. This information is often shown visually, but can also be conveyed through sound cues. Sound can indicate the occurrence, type, and details of actions performed on workspace objects, and also the direction and distance of those actions. Table 6 summarizes how these techniques support various elements of workspace awareness. I include only a subset of WA elements that apply specifically to these techniques. Element:
Usage indicators
Authorship indicators
Indicators of past manipulation
show author by colour or name
may show author (e.g. by colour)
Sound cues
Who Authorship What Action
show that activity is occurring, but not what action
Intention
marking reserved objects indicates future plans
Artifact
artifact showing the indicator is the object in use
artifact showing the indicator is the object in use
can show past actions
different sounds indicate different kinds of action
artifact showing the indicator is the object in use
different types of artifacts can produce different kinds of sound
Table 6. Workspace awareness information shown by expressive artifacts
5.2 Techniques for workspace visibility All of the visual techniques that situate awareness information in the workspace encounter the same visibility problem: that the relevant part of the workspace has to be visible for the techniques to be of any use. When the workspace is too large to fit into a single window, the entire area outside the local user’s viewport cannot be seen (see Section 4.1.1). There are a number of techniques for making the relevant parts of the 111
workspace visible. These techniques can be characterized in terms of three principles: the extent of the workspace shown in the display, the size of the display (and hence the scale of the artifacts), and the visual and spatial representation of the workspace. Based on these principles, I consider three general groups in the sections below. First, overviews show the entire workspace in a small secondary display. Second, detail views duplicate a selected part of the workspace. Third, focus+context views attempt to provide both local detail and global context within the same display2.
5.2.1 Overviews Overviews show the entire workspace in miniature. They are usually presented as small windows that can be inset into the regular, full-size view of the workspace. Although they do not take up much room, they provide a high-level look at the entire space. They correspond in some ways to a person’s peripheral vision in a face-to-face environment: they give a broad perspective, but not much detail. For example, an overview is shown as it might be used alongside a main view in a newspaper-layout application in Figure 35. Figure 36 shows the extents and size of an overview compared to a normal view: the normal view (light grey) shows about a third of the workspace at full size, while the overview (dark grey) shows the whole workspace greatly reduced in size. Overviews can make embodiments, actions, and feedthrough visible, regardless of where in the workspace they occur. Since events are shown at a lower resolution than they would be in a normal view, overviews are best at helping people maintain high-level workspace awareness. That is, they can show where in the workspace people are working, and the general structure of their activities. When the overview shows additional awareness information like view rectangles and telepointers, it is called the radar view, as
2
These systems are demonstrated in two videotapes, (Gutwin, Greenberg, and Roseman 1996), and (Greenberg, Gutwin, and Cockburn 1996). 112
shown in Figure 37 (also shown in Figure 35). The evolution of the radar view is discussed in greater depth in Chapter 6.
Figure 35. A workspace overview (left) beside a main view. Normal viewport
Overview
View size:
View extents: Workspace area
Figure 36. View extents and view size for overview and normal view
113
Figure 37. Radar views showing viewports and telepointers Several factors determine how much detail is shown in an overview. The size and reduction factor of the overview dictate its resolution, but the fidelity of the representation also affects visibility. Low-fidelity representations require fewer computational resources, and can still be recognizable to people familiar with the workspace. High-fidelity representations can provide details that may be useful or required in some situations. Low- and high-fidelity overview representations are compared in Figure 38. Whether low or high fidelity, the radar view still shows all of the artifacts and preserves spatial relationships displayed by the full-size view. However, other workspace representations are also possible. In some cases, a more abstract representation of workspace artifacts may be appropriate. For example, the workspace may have an explicit
Figure 38. The same workspace as a high-fidelity and low-fidelity overview 114
structure that can be used to create an overview. The system in Figure 39 represents a text document (Macbeth) as an outline, showing only the Act and Scene headings. Since much of the document’s detail cannot be seen in this kind of overview, view rectangles and telepointers are replaced with a portrait indicating the section of the play that each person is currently looking at. An outline is likely to be more appropriate for large text documents, since a detailed overview would require considerable space, and since the text would be too small to provide meaningful landmarks.
Figure 39. Outline radar view. If space is at a premium, the overview’s representation of the workspace can remove the artifacts altogether, and just show where people are located. One kind of display that takes this approach is the multi-user scrollbar. This groupware variation on a normal scrollbar was first used in the SASSE group text editor (Baecker et al 1993); Figure 40 shows the GroupKit version of this display. It provides a one-dimensional representation of the workspace as a vertical region beside the normal scrollbar. Each person’s viewport is represented in the overview as a coloured rectangle that moves up and down as they scroll up and down through the workspace. Since there are no artifacts shown in the scrollbar overview, it is difficult to tell exactly where another person is located, or what they can see. This representation does indicate, however, whether another person is near the beginning or the end of the document, whether they are close to the local user, and whether their viewport intersects or coincides 115
Figure 40. Multi-user scrollbar in a text editor. with any others. The multi-user scrollbar also makes going to another person’s location simple: the local user simply scrolls until their view indicator is adjacent to the person’s that they wish to visit.
5.2.2 Detail views Although overviews provide visibility of the entire workspace, the reduction in size that they impose makes it difficult to obtain details of actions and artifacts. In some tasks and some workspaces, people need more specific information about what others are doing. Detail views are another kind of secondary viewport that provide a closer look at another person’s work area: they show less of the workspace than an overview does, but what they do show is larger and in greater resolution. Although a detail view could show any part of the workspace, I consider two configurations to be most applicable, called the “over the shoulder view” and the “cursor’s-eye view.” The view extents and view sizes of these two displays are compared to a normal view in Figure 44. The over-the-shoulder view shows exactly the part of the workspace that appears in another person’s full-size viewport. The objects are still smaller than full size, but are considerably larger than they would be in an overview. Figure 42 shows the over-the116
Normal viewport
Over-the-shoulder view
Cursor’s-eye view
View size:
View extents:
Figure 41. View extents and size for detail views, compared to normal view shoulder view in a newspaper application. The inspiration for this view is the idea of looking over at another person’s work area in a face-to-face setting, to see what objects they have in front of them, to see what they can see, and to look more closely at something that may have been noticed in peripheral vision. In Figure 42, the over-theshoulder view is shown at left, with the entire workspace shown at right (reduced in size). In real use, the over-the-shoulder view is only about one-sixth the width of the workspace.
Figure 42. Over-the-shoulder view (left) and entire workspace (reduced, right). The second kind of detail view is the cursor’s-eye view, so called because it shows only a small area directly around another person’s mouse cursor. Figure 43 shows the cursor’seye view in a newspaper application. Although its extents are limited, the view shows 117
Figure 43. Cursor’s-eye view (left), and remote user’s main view (reduced, right). objects and actions in full size and full detail. This view is useful when the precise details of another person’s work are required: for example, when one person wishes to keep an eye on the way another aligns objects, types, or adjusts the fine details of a drawing. The cursor’s-eye view does not show the entire scene, so its use is limited to situations where the general nature of a person’s actions are known in advance. In Figure 43, the cursor’seye view is shown at left, and the remote main view that it originates from is shown at right (reduced in size). The cursor’s-eye view is shown at full size.
5.2.3 Focus+context views Two additional strategies address the visibility problem not by adding secondary displays, but by always showing the entire workspace in the main view. A large-scale overview provides visibility of the workspace, and detailed work is made possible by magnifying a particular area of interest. I consider two techniques: first, fisheye views that use a distorted representation of the workspace; and second, DragMag views that provide a ‘magnifying glass’ to enlarge parts of the overview. Fisheye views are computer visualization techniques that provide both local detail and global context in a single display (e.g. Furnas 1986; Sarkar and Brown 1992). They take their name from the photographer's fisheye lens, a hemispherical lens that distorts a scene 118
to provide an extremely wide angle of view. In a computational fisheye, the user chooses a point of focus where they wish to see local detail: this area is visually emphasized, and the remainder of the data is reduced in size. Figure 44 shows the view extents and view size of the fisheye, where the fisheye view is like a full-screen overview, but with the workspace mapped onto a ovoid. Fisheye representations of a workspace can provide a seamless and smooth transition from local to global contexts, and allow the presentation of multiple focal points, one for each participant, all within the same view. Fisheye view Normal viewport View size:
View extents: Workspace area (distorted)
Figure 44. View extents and size of fisheye view compared to normal view Figure 45 shows a concept-map editor that uses a fisheye representation of the workspace. The window at left shows the local user’s view, and the window at right shows a remote user’s view. The local user’s focus point and cursor are on the node labeled “The Vatican Bank,” and the remote user’s focus point and cursor are on the node labeled “Nicaragua.” The fisheye view uses two magnification functions, one for the local focus and one for remote foci. First, the area around the local user’s focus is enlarged enough to let them work in detail on the artifacts. Second, the node at the focus point of each remote user is enlarged, but the area around it is not enlarged. There are a number of usability problems with this kind of representation, although discussing them is outside the scope of the dissertation. Nevertheless, it is possible to
119
provide both local detail and enough context for the maintenance of workspace awareness, all within a single view.
Figure 45. A fisheye representation of a concept-map workspace. The DragMag view is another technique that provides focus and context within the same window. The technique is related to the “magic lenses” of Bier and colleagues (1994). The DragMag uses a full-screen overview as its basic representation. The overview provides context and visibility of the workspace and the people in it. Detailed individual work is accomplished by dragging a magnifier to the area of the overview where the work is to be done. The magnifier scales the objects beneath it to full size, and they can then be worked on in detail. Meanwhile, the overview continues to provide context and peripheral awareness outside the magnifier. In addition, the magnifier also shows a partiallytransparent representation of the overview beneath it, to help people maintain global context. Figure 46 shows the view extents and size of the DragMag, and Figure 47 shows a DragMag view of a concept map. The local user’s magnifier is at upper middle, looking
120
at a node labeled “The Sun.” The extents of a remote user’s magnifier are displayed as a rectangle at lower right (remote magnifiers do not magnify objects in the local views). DragMag view
Normal viewport
View size:
View extents: Workspace area
Figure 46. View extents and size for the DragMag view.
Figure 47. A DragMag view of a concept map.
121
5.2.4 Summary of visibility techniques When a shared workspace is too large to fit into a single computer display, groupware systems encounter the visibility problem. A large part of the shared workspace cannot be seen, and awareness information presented there is lost. There are several techniques for providing participants with visual access to relevant parts of the workspace. These techniques vary along three dimensions: the amount of the workspace shown, the size of the display, and the representation of the workspace artifacts. The first two dimensions are summarized in Figure 48. Entire screen
Focus+context views
Display size Cursor’seye view
Over-theshoulder view
Extents shown
Radar views
Entire workspace
Figure 48. Summary of extents and display size. Workspace representation also changes from one technique to the next. The workspace objects in the display may be shown at low or high fidelity, and may represent objects literally, abstractly, or not at all. Finally, techniques may use a distorted representation (e.g. the fisheye) or multiple layered representations (e.g. the DragMag) to provide detail and context in a single view. A summary of the visibility techniques is shown in Table 7 (note that the table uses categories introduced in this section, not the elements of workspace awareness that were used in previous tables). Display Quality
Radar view
Outline radar
Multi-user scrollbar
Cursor’seye view
Over-theShoulder
Fisheye view
DragMag view
Extents
entire workspace
entire workspace
entire workspace
region near same as cursor main view
entire workspace
entire workspace
View size
small window
small window
small window
small window
full screen
full screen
122
small window
Representation
all objects only headings in workspace shown represented; low or high fidelity
Embodiment
view rectangle, telepointer
portrait
no artifacts all objects shown in extent represented at full-size
all objects in remote main view shown
distorted
view rectangle
telepointer
telepointer, magnifier, telepointer focus indication
telepointer
magnifier adds second layer
Table 7. Summary of visibility techniques
5.3 Separate and symbolic techniques Presenting awareness information outside the workspace, using symbolic indicators, is a contrasting approach to that described above. These displays are generally placed in a separate area of the interface or in a separate window, and show state rather than process information. Instead of using embodiment or artifacts to convey the information, symbolic indicators extract important data from the environment and display it explicitly. Although separate indicators lack the context provided by situated presentations, they are still necessary in some situations. They are also generally simpler to implement, require fewer computational resources, and do not encounter the visibility problem. The next sections look at presentation of basic workspace awareness information through separate symbolic displays, and at techniques for visualizing relationships or qualities that are difficult to determine from literal presentations.
5.3.1 Basic WA information Separate symbolic displays, like literal displays, show information about who is in the workspace, where they are working, and what they are doing. However, the information is presented explicitly and at a more abstract level. For example, two symbolic displays showing presence and identity are illustrated in Figure 49, taken from GroupKit (at left) and Teamrooms (at right) (Roseman and Greenberg 1996). They show a simple list of current participants’ names or portraits.
123
Figure 49. Participant lists (Roseman and Greenberg 1996). Location can also be shown separate from the workspace, but the information must be presented in a form that can be interpreted without using the workspace as a context. There are other contexts that can be used. For example, coordinate systems are commonly used to interpret location. People often use a simple two-by-two system (top, bottom, left, right), and mapmakers impose a more fine-grained system (see Figure 50). If the workspace or the task uses these systems, then coordinates can be used in awareness displays. Left
Right
A B C D E F G H I J 1 2
Top
3 4 5 6 Bottom
7 8
Figure 50. Coarse and fine coordinate systems. In other cases, the workspace has an explicit structure derived from the organization of the task, and this context can also be used to interpret location information. For example, text documents are often organized into sections and subsections, and a drawing of a floor plan is divided into rooms. Figure 51 shows an indicator of what section of a document each person is currently working in. This display is similar to the outline radar view in 124
Figure 39, but does not show the entire structure of the document, only each person’s location.
Figure 51. Location indicator for a structured text document (prototype) To display information about activity, many of the symbolic techniques discussed earlier can be removed from their workspace context and placed in a separate display. For example, system mode, current tool in use, or current menu or keyboard action can all be shown in a separate display.
5.3.2 Arbitrary relationships The lack of context makes some kinds of information more difficult to present in a separate symbolic indicator, but these displays can also extract arbitrary information from the environment that would be difficult to find in a literal presentation. There are two kinds of information that symbolic indicators display particularly well, task-specific information and temporal relationships. Task-specific information. If the task requires that people track specific states, conditions, events, or relationships, then a symbolic indicator that displays only this specific information can be more effective than finding the information in a literal display. For example, it may be vitally important to know when a control-room operator shuts down a particular piece of equipment. Although this information could be gathered from a literal display of the operator’s actions, a symbolic indicator can make that one action more noticeable and harder to miss. Other examples include arbitrary relationships between people and artifacts in the workspace, such as the nearest person to me, the person who last used the welding tool, or the people who have not yet been in the Introduction section. 125
Temporal relationships. In order to understand how a person or an artifact are behaving over time, a literal presentation requires that the display be watched continuously. However, if the specific quantities of interest are known beforehand, then the groupware system can track those variables and display an up-to-date summary. Temporal indicators come in three flavours. First, they can track how long it has been since certain events occurred. For example, an idle time indicator tracks the amount of time since a person was active in the workspace. Figure 52 shows a simple idle-time indicator from the Teamrooms system (Roseman and Greenberg 1996). Second, temporal indicators can show the current value of a particular quantity—a kind of meter on an artifact or person. For example, an indicator could show the number of times that an artifact has been manipulated within a certain time period, or could show a person’s current rate of activity. Figure 53 illustrates “social activity indicators” (Ackerman and Starr 1995), meters that display the current rate of traffic on different asynchronous communication channels. Third, indicators can show trends, by taking the meters described above and graphing a range of values over time instead of just showing the current value. Thus, a trend indicator could show the overall activity in the workspace over time, or changes in the number of people participating in the activity over a certain time period.
Figure 52. Idle-time indicator (Roseman and Greenberg 1996). 126
Although these displays can provide specific useful information for maintaining awareness, the ability to isolate particular information and analyze a channel over time also raise concerns about privacy. I briefly consider the overall problem of inappropriate awareness in Chapter 11.
5.4 Chapter summary
Figure 53. Social activity
This chapter has shown a variety of example
indicators (Ackerman & Starr
displays and display techniques for presenting
1995).
workspace
awareness
information.
These
techniques differ in the placement and the presentation of information. The situated approach attempts to use workspace embodiment, representations of actions, and expressive artifacts to help people maintain awareness using mechanisms that they already know. Since the situated approach displays information where it happens, it depends on the visibility of the relevant part of the workspace. There are several means for showing other areas of the workspace that vary magnification, extents, and representation to provide different amounts of global and detailed information. Separate and symbolic techniques display awareness information as a state rather than an ongoing process. Symbolic information requires less screen space and does not depend on workspace visibility, but provides much less detail about actions and artifacts, and does not present information within a spatial and temporal context. The next chapter takes a closer look at the radar view, a display that provides visibility of the entire workspace, and allows the presentation of situated WA information. The radar evolved over the course of three design iterations, including the two evaluations of Chapters 8 and 9. I look at the origins of the display, and at how the design changed to better support both individual work and the maintenance of workspace awareness. 127
Chapter 6
The evolution of the radar view
The radar view, introduced in the previous chapter,
displays
workspace
Operationalization
awareness
information on a miniature representation of the
Evaluation
entire shared workspace. The radar view allows consequential communication, feedthrough, and gesture to be perceived regardless of where people
Application
are working. I have evaluated the radar in a variety of systems and circumstances, and so a considerable amount of design work has been put into it. In this chapter, I trace the evolution of the display through three design cycles and discuss how the awareness information and the presentation choices changed. Many of the observations and much of the feedback used in redesigning the display comes from the evaluations that will be presented in the next few chapters. Therefore, the story told here foreshadows some of the results that will be presented later. In this chapter, I discuss the origins of workspace overviews and radar views, and then describe the design and redesign of three successive versions of the radar. Later chapters provide details about the setup and findings of the evaluations.
6.1 Inspirations and roots Many people who undertake tasks in medium or large physical workspaces have faced the problem of not being able to see everything at once, and have dealt with it by constructing miniature representations to use as a guide. For example, a paper map (already a miniature representation) is often too large to spread out completely, and people will often fold the map so that it shows only a particular area of interest. The folding technique makes the map more manageable, but at the cost of context: it is now difficult to relate the area in focus to the rest of the map. As Figure 54 shows, context can be given 128
using a second view, one that shows the entire workspace in miniature and also indicates the current area of interest. The main part of the map still shows the area of interest in detail. In the figure, the overview is inset into both maps as a globe with a rectangle indicating the outline of the detail area.
Figure 54. Two examples of overviews in newspaper maps (Calgary Herald 1997). In computational workspaces, these visibility problems are common, since the user can see only one screenful of the space at a time. Miniature representations have been used in games and drawing programs as navigational aids and as a way for people to see an entire picture or document at once. Unlike paper maps, however, computational overviews can be dynamic, so that the miniature changes whenever something happens in the main view. Figure 55 and Figure 56 show examples of dynamic miniatures in single-user applications. Figure 55 shows the early arcade game Defender. The “scanner” view at the top of the screen shows the whole game area; the black rectangle shows the region that is visible in the main part of the screen. Figure 56 shows a drawing program (Aldus SuperPaint) that provides an overview of the current document: the overview (at left) also shows the current viewport (dotted rectangle). 129
The above examples all involve single-user workspaces, but multi-user workspaces also encounter the visibility problem. The problem is actually worse in groupware: in addition to problems of context, lack of visibility also poses problems for workspace awareness (see Section 4.1.1). When events happen outside the main view, situated placement of awareness information cannot be perceived, and consequential communication and feedthrough cannot happen. The radar view makes the entire workspace visible, allowing information about presence, actions, and location to be perceivable and usable by the people in the conference.
130
Figure 55. The arcade game Defender, with ‘scanner’ view at top (Williams 1980).
Figure 56. Drawing program with miniature (left) and main view (right) (Aldus 1990). Variations of the radar view have appeared in previous groupware systems. The term was coined by Smith and colleagues (1989) to describe the miniature view of the Shared Alternate Reality Kit (SharedARK), a multi-user physics microworld. This miniature looked and worked like Defender’s scanner, but also showed a viewport outline for each person. In Figure 57, SharedARK’s radar view is shown at the top of the screen; 131
rectangles in the radar indicate view extents. A later version of the radar, used with onedimensional text workspaces, was implemented in the SASSE group text editor (Baecker 1993). This device, called the “gestalt view,” is shown in Figure 58. The gestalt view’s overview breaks up the text so that it can all be shown in the lower half of the screen. Radar View View Rectangles
Main Workspace View
Figure 57. Radar view from SharedARK (Smith et al 1989)
Figure 58. Gestalt view from the SASSE text editor (Baecker et al 1993)
132
6.2 Radar view version 1 The first radar view built for this research was a simple passive overview of the objects in a workspace (Figure 59). The display was updated whenever an object moved in the main view, so dragging an object would be immediately shown in the radar. It used a low-fidelity representation of workspace objects, replacing them with coloured rectangles, to simplify the miniaturization process and to minimize display load. Figure 59 shows this version of the radar used
Figure 59. The radar
in a newspaper-layout application. Text columns are
view version 1
represented as grey rectangles, headlines are black, and pictures are blocks in different colours. The display is shown as it would be used in a newspaper-layout application in Figure 60 (although the main view is smaller than it would be in real use).
133
Figure 60. Version 1 used in a page-layout application. This version of the radar view shows only the workspace objects. Consequently, feedthrough is the only mechanism that can be used to gather workspace awareness information. Even so, the display provides some information about presence, location, and activity. For example, when you see an object move in the radar, you can assume that there is someone there, that the moving object is in the other person’s main view, and that they are engaged in moving it. However, motion is the only source of information in the display; when nothing is moving, it is difficult to determine anything about the others in the conference. Through my own informal observations, it became clear that the display needed a more permanent representation of who was in the workspace and where they were.
134
6.3 Radar view version 2 The second version of the radar added an embodiment of each participant to the overview, by superimposing viewports and telepointers on the display (Figure 61 and Figure 62). The embodiments were also updated in the radar whenever changes were made in the main view. Viewports were displayed as coloured rectangles (view rectangles), made partially transparent by rendering only selected pixels according to a bitmap mask. Miniature telepointers were also displayed for each participant. Identity was conveyed by colour: each participant’s view rectangle and telepointer were displayed in a different colour.
Figure 61. The radar view version 2
135
Figure 62. The radar view in a groupware newspaper-layout application The view rectangles and telepointers provide information about where people are working and what they are doing. Telepointers also allow nonverbal gestural communication even when participants are working in different parts of the workspace. However, this version of the radar, like version 1, was a passive display that could not be manipulated. People could not change their viewport’s location, manipulate workspace artifacts, or point to things in the radar view; these operations could only be accomplished through their main view. When a person put their mouse cursor into the radar view, their telepointer disappeared on other people’s screens. Version 2 of the radar view was examined in the usability study of Chapter 7. While the radar was shown to be a useful and valuable addition to the system, there were a number of display and design issues raised by the participants. These issues fell into three areas: interactivity, display fidelity, and identification. 136
Interactivity. As discussed above, the radar view was a passive information display. People who used the radar wanted it to be interactive, and they suggested three capabilities. First, they wanted to be able to point to things in the radar view. Second, they wanted to be able to move objects using the radar view. Third, they wanted to be able to move their main workspace view by dragging their view rectangle inside the radar. Display fidelity. Two problems arose from the way that the radar represented objects. First, some participants had difficulty keeping track of which objects in the main view were represented by which objects in the radar view. That is, although they could see that their partner was moving a headline, they couldn’t tell from the radar view which headline it was. Second, some people had difficulty seeing the radar telepointers. Two reasons given were that the telepointers were small, and because the contrast between the telepointer and the object underneath it was sometimes poor. Identification. People had occasional difficulty in remembering which view rectangle in the radar was theirs and which was their partner’s. Although this was not a common problem, several people thought that it would become more severe with larger groups. This feedback was used in the next redesign of the radar view. More detail about these issues, the principles underlying them, and other details of the study are given in Chapter 8. The next version of the radar view included major changes in each of the areas discussed above.
6.4 Radar view version 3 The third version of the radar view made major changes in the fidelity of the representation, and in the interactivity of the display (Figure 63). Minor changes were also made to ease identification, and to improve presentation and behaviour. The first major change moved from colour-coded rectangles to high-fidelity representations of the objects in the workspace. Objects in the radar now looked like objects in the main view,
137
Figure 63. The radar view version 3 only smaller.3 A high-fidelity representation allows people to differentiate between similar-looking objects in the radar. The second major change made the radar a fully interactive display that allows pointing, manipulating, and navigating. People can now point to objects in the radar, and their radar telepointer on others’ screens will perform the same gesture. Objects can be selected, moved, and manipulated within the radar, at least to the limit of the display’s resolution. Navigation is also simplified: dragging one’s view rectangle in the radar causes the main view to scroll to that location. Smaller changes were undertaken to provide information about identity and improve the visibility of telepointers. Identifying whose view rectangle is whose was simplified by attaching people’s portraits to their view rectangles, although colour is still used as a secondary source of information. Telepointers were made more visible by enlarging them slightly, changing their shape from a dot to an arrow, and giving them a black outline to improve contrast. Version 3 of the radar view is shown at actual size in Figure 63, and as part of a concept-map editor in Figure 64. In this application, the radar is inset into the main view of the workspace as a separate pane. Note that the size and shape of the radar
3
The higher-fidelity representation is achieved by adding a tool called Pad++ to GroupKit. Pad++ (Bederson and Perlin 1994) provides high-fidelity scaling operations for a wide variety of object types. 138
view are different from version 2, but only because the size and shape of the workspace in the new application are different; the reduction factor is approximately the same in both displays. Variants of this version of the radar view have been evaluated in different ways. A highfidelity but display-only variant is the focus of the study in Chapter 8, and the fully interactive radar has been subject to informal assessment as part of the concept map application. In general, people were pleased with the radar’s high-fidelity representation and interactive capabilities, and people had very few major difficulties interpreting and using the display. However, a variety of smaller issues were raised that concern two further areas: display size, representation details, and performance. Display choices. Several aspects of the radar’s visual attributes were discussed. Many of these comments indicated that for certain activities, the radar was either too large or too small. In some situations, people felt that the radar view blocked too much of the workspace. These comments usually concerned attempts to get at an object that sat underneath the radar. In other situations, however, people felt that the radar was too small, in that the objects in it were hard to see or hard to manipulate with the mouse. Representation details. People noted four additional (though minor) problems with the representation of objects in the display. First, in a few cases, the telepointer obscured the object beneath it: when a person grabbed a small object in the workspace, the radar telepointers sometimes made it difficult for others to identify the object. Second, the radar did not show the popup menus used in the concept-map application. A few people suggested that the display should show all of the actions going on in the main view (see Section 5.1.2). Third, users of the concept-map application noted that the portraits in the view rectangles sometimes made it difficult to see the objects over the portrait. Fourth, people noticed that what is visible in a view rectangle does not exactly match what is visible in the main view, since view rectangles do not indicate the radar view itself. Occasionally, people would believe an object to be visible in their main view, when in reality it was hidden behind the radar. 139
Figure 64. The radar view in a concept map editor. Performance. One performance problem was reported. The radar view sometimes faded out momentarily during periods of high activity. When two or more people all moved their viewports at once, the radar view on slower workstations would be unable to keep up with all the activity. These problems and suggestions were used in the next and final redesign of the display.
6.5 Radar view version 4 Version four is the current version of the radar view (Figure 65 and Figure 66). Again, several changes have been made based on the feedback described above. The major differences in version 4 concern the size of the display and the magnification of the objects shown in it. Three strategies were implemented to improve the visibility and 140
Figure 65. Transparent radar using a rendering mask resolution of the radar and to reduce the problem of occlusion. These strategies are variable magnification of objects, transparency, and the full-screen radar. Variable-magnification representation. The size reduction of the radar view can render some workspace artifacts too small to see clearly enough for the purposes of the task. Artifacts that are small to begin with can become almost invisible when reduced in size 64 times. Therefore, presenting artifacts in the radar at different reduction factors could be useful: that is, some objects in the radar will be larger, relative to true size, than others. Since this strategy depends on prior knowledge of the objects in the workspace, it can only be used as a customization of the radar view rather than a standard capability. Radar transparency. The problem of the radar occluding main view objects can be approached using transparency. The background of the radar can be made partially transparent, to make main-view objects behind the radar visible. The benefit is that people will less often lose objects behind the radar. The drawback is that visual clarity of the radar is somewhat reduced. The transparent radar is shown in Figure 65; the system is a pipeline construction kit built for the study in Chapter 9. The visual effect is 141
Figure 66. The normal size of the radar view (left) and the full-screen radar (right) unfortunately hampered by the implementation, since the underlying tools do not allow true transparency through alpha-channel blending. Instead, the display uses a rendering mask to let some of the underlying image show through. Full-screen radar. When people work in the radar view, objects are sometimes too small to manipulate easily. This problem can be solved for some applications by allowing the user to temporarily expand the radar to the full size of the screen. When a command is chosen from the menu, the radar view expands to fill the entire workspace window, covering the main view (see Figure 66). This capability gives people maximum possible resolution when they are working in the radar view: objects are much easier to see, text is easier to read, more detail is visible, and objects are easier to grab and manipulate. With a typical screen size, the full-screen radar increases its area and resolution by a factor of nine. When in full-screen mode, the local user’s view rectangle is dimmed in all other radars to indicate that they are not using their main view. In the figure, the full-screen radar (at right) shows only the remote user’s view rectangle. The rationale behind the full-screen capability is that when people work in the main view, they need the radar view to maintain workspace awareness. However, when they work in the radar view, they do not usually need the detailed information in the main view. The full-screen radar differs from the zoom capability in traditional programs in that the radar doesn’t go away when you go back (that is, zoom in) to the main view. 142
In addition to these size and magnification changes, several minor alterations make small adjustments to the representation and behaviour of the radar view. First, in order to reduce the computational load when multiple people move around in the workspace at once, view rectangles are simplified during moves. The portraits and the rectangle border are not shown, reducing the number of moving objects from three per person to one. Second, telepointers were changed to move partly behind an object when the object is grabbed. The telepointer’s outline is still visible above the object, but the interior fill drops behind. Third, popup menus are now represented in the concept-map radar. Popups are not automatically dealt with by the underlying tool, so when a popup is shown in the main view, a miniature version must be drawn manually in the radar.
6.6 Summary This chapter has reviewed the evolution of the radar view, a display that presents awareness information on a workspace miniature. Table 8 compares the major characteristics of each version and compares the major changes that occurred with each redesign. The radar view combines visibility of the entire workspace with information about identities, locations, and actions of participants in the groupware conference. Through three design iterations, the radar view has evolved from a basic overview to an interactive display that shows considerable information about participants. The table summarizes both the representation used and the workspace awareness information provided by the display (I include only a subset of the elements of WA that apply specifically to the radar view). Thus far in the dissertation, I have looked at the operationalization and application of workspace awareness: what it is, how it works, and how to use it in the design of groupware. The next part of the research process is evaluation. The following three chapters will consider the evaluation of the ideas presented thus far. In particular, they explore the research hypothesis presented in Chapter 1, that support for the maintenance of workspace awareness improves the usability of real-time distributed groupware 143
systems. I begin this exploration in Chapter 7, which looks more closely at the issue of groupware usability, the research hypothesis, and the methodology that will be used to test it. Version 1
Workspace representation
low-fidelity
Version 2
Version 3
Version 4
low-fidelity
high-fidelity
high-fidelity, variable size or transparent
Workspace awareness information: Who Presence
indirect, through object movement
presence of view rectangles and telepointers
presence of view rectangles and telepointers
presence of view rectangles and telepointers
Identity
none
colour of view rectangle and telepointer
colour and portrait
colour and portrait
object feedthrough
telepointer movement, object feedthrough
telepointer movement, object feedthrough
telepointer movement, object feedthrough, process feedthrough (e.g. popup menus)
Location
indirect, through object movement
location of view rectangle and telepointer
location of view rectangle and telepointer
location of view rectangle and telepointer
View
indirect, through object movement
extents of view rectangle
extents of view rectangle
extents of view rectangle
What Action
Where
Table 8. Representation and WA changes for versions 1-4 of the radar.
144
Chapter 7
Evaluation methodology
The third part of my research process is evaluation.
The
operationalized
preceding the
concept
chapters of
Operationalization
have
workspace Evaluation
awareness, and have applied it to the design and construction of awareness displays and systems. This work has built an infrastructure that now
Application
allows me to look more closely at the hypothesis posed at the beginning of the thesis. The next few chapters will test the claim that support for the maintenance of workspace awareness improves the usability of groupware. The infrastructure is necessary because it provides a means of tracing and explaining the connections between awareness displays and the underlying ideas of workspace awareness, and lets me be reasonably confident that the evaluations of these displays actually test the effects of awareness support. This chapter lays the groundwork for the evaluation. I first outline my goals, and then review some basic issues of research evidence and methodology. I then tackle the questions of what groupware usability is, how improvements in usability can be detected, and how the difficulties of measuring groups will affect the evaluation. I then give an overview of the two studies discussed in the next two chapters: an exploratory usability study in Chapter 8, and a laboratory study in Chapter 9.
7.1 Evaluation goals The primary goal of these evaluations is to test the research hypothesis: that is, to test whether support for WA improves the usability of groupware. Section 7.3 considers that goal in more detail. There are also a number of secondary goals, which can be organized into four groups: explanation, design, validation, and groupware evaluation. 145
Explanation. Through these evaluations I will gather information about why certain displays are or are not useful, based on observations of behaviour at a more detailed level than what exists in the conceptual framework. This information will broaden understanding of how WA works and can be used to add detail to the conceptual framework. Further design. These evaluations will show the strengths and weaknesses of particular designs, their applicability to specific situations, and the usability of the displays themselves. These results will be used to improve existing displays and to create new ones. As mentioned in Chapter 6, some of these design results have already been introduced. Validation. These evaluations will put awareness support on the beginnings of an empirical footing, and expose weaknesses in the underlying ideas, processes, and the conceptual framework. Groupware evaluation. As the science of evaluating groupware systems is still young, these evaluations will provide practical information about the usefulness, the pitfalls, and the efficiency of different evaluation methods and measures.
7.2 Methodological approach I examine the research hypothesis with techniques taken from usability engineering (e.g. Nielsen 1993) and standard controlled experimentation (e.g. McGrath 1994). Before detailing the methods that I have chosen, however, I will sketch out the general background of empirical research methodology. This context will allow me to better explain my choice of methods, and will provide a set of concepts that will be useful in looking back at these evaluations and methodologies in later chapters.
7.2.1 Background McGrath (1994) sets out a practical framework of methods for the behavioural and social sciences which also applies to HCI research. He begins by noting that research is simply a 146
structured way of gathering of information or evidence, but that the way in which the evidence is gathered affects what it means. As he says, “the meaning of research evidence, in any area of science, is inherently tied to the means and methods by which that evidence was obtained” (p. 152). It is therefore advisable to consider the strengths and limitations of different techniques before embarking. McGrath continues by observing that “all methods are flawed, but each is flawed differently” (p. 154). His overall message is that no one method can provide perfect results. His framework shows this by considering different methods in terms of three criteria. The three “desirable features” of research evidence are: generalizability of the evidence across a population, precision of measurement of the behaviour in question, and realism of the context in which the measurements take place (p. [155]). Unfortunately, one of the dilemmas of the research process is that “although you always want to maximize all three of these criteria,…you cannot do so” (p. 155), since steps taken to increase the strength of one feature often weaken the others. McGrath suggests four basic methodological approaches that are compared in Figure 67: respondent methods, experimental methods, field methods, and theoretical methods. Respondent methods gather participant responses to questions or stimuli created by the researcher, in order to examine the distribution of some variable across a population. For example, judgment studies gather responses from a small set of judges, and sample surveys gather more general information from a wider range of people. Respondent methods can be general, if they use a large sample, and can also provide specific feedback about a stimulus or an object (such as an interface). However, the responses gathered are always subjective. Experimental methods typically take place in the laboratory, and have the researcher deliberately create a setting for behaviour with specific rules and instructions. The researchers then “induce some individuals or groups to enter the concocted system and engage in the behaviour called for by its rules and circumstances” (McGrath 1994, p. 157). There are two types of experimental methods. Laboratory experiments are 147
controlled experiment that often study “low-level perceptual, cognitive, and motor activities of individuals” (Baecker et al 1995, p. 86). They attain great precision by controlling all variables other than those under observation, but they do not account for ways that behaviour will be influenced by a real task environment. Experimental simulations, on the other hand, are an attempt where “to achieve much of the precision and control of the laboratory experiment but to gain some of the realism (or apparent realism) of field studies. This is done by concocting a situation or behaviour setting or context, as in the laboratory experiment, but making it as much like some class of actual behaviour setting as possible” (McGrath 1994, p. 157). Field methods have the researcher directly observe behaviour in its natural setting, and attempt to minimize the intrusion into that setting. Field studies use techniques like ethnography and interaction analysis to observe processes or technology in real work situations. Field experiments change one aspect of the work environment and then observe the effects of the change over a short or a long term (Baecker et al 1995, p. 80). Since field methods study people in natural settings, they are highly realistic. However, observations in field methods can be specific to individuals or cultures, and so it is often difficult to generalize to other situations. Theoretical methods explore behaviour without observing it, through formal theories or through computer simulations. In HCI, for example, theories of human information processing can be employed to evaluate interfaces, using techniques like GOMS (e.g. Byrne et al 1994). Models based on formal theory could also form the basis for a computer simulation that is used to derive predictions of performance with a particular system or device (Baecker et al 1995, p. 82). Figure 67 shows how these four kinds of methods relate to the criteria of precision, generalizability, and realism, and also shows how moving toward one of the criteria always moves away from another.
148
PRECISION
Judgment Study
Laboratory Experiment
Laboratory Simulation
Sample Survey
Respondent Methods
Experimental Methods
GENERALIZABILITY Formal Theory
Theoretical Methods
Field Methods Field Experiment
Computer Simulation
Field Study
REALISM
Figure 67. Research strategies (adapted from McGrath 1994).
7.2.2 Methods for research on workspace awareness Experimental methods will be my primary means for gathering evidence about the effects of workspace awareness in groupware. As a secondary method, I will also use respondent techniques within experiments to gather judgment data. I employ two types of experiment. The first study is a usability study, which provides a broad range of data and allows exploration of several conditions and several questions. The second is a laboratory simulation as described above, which allows me to focus on more specific issues raised by the exploratory study. Other methods are inappropriate or infeasible for a variety of reasons. Surveys are unsuitable since populations that have experience with groupware and WA support are small and difficult to reach. Theoretical methods are difficult because no formal theory of awareness exists. Field techniques present practical problems. In particular, it is difficult to find work situations where real-time distributed work is already being done and where I could integrate a groupware system with existing operations and observe its use in real work situations.
149
I have chosen experimental techniques because they provide definite benefits in testing my hypothesis, and have limitations that are reasonable given the scope of this research. The advantage of these methods is that they are precise, a useful quality in an area where the underlying principles are not well understood. Their drawbacks are lack of generalizability and lack of realism. In these studies, I address the problem of realism somewhat by using experimental simulations, which test realistic systems with realistic users for experimental purposes (Baecker et al 1995, p. 80). In both the studies described below, I built working groupware systems that were used to accomplish realistic tasks. I will return to the issues of precision, realism, and generalizability in Chapter 9. For the moment, however, now that a backdrop is drawn on the methods that I have chosen, I will continue with a closer consideration of the research hypothesis.
7.3 Improving groupware usability The hypothesis of this research is that support for the maintenance of workspace awareness improves the usability of real-time distributed groupware systems. This claim cannot be evaluated until it is clear what I mean by groupware usability, and what an improvement in that quality will look like. Usability in general is the degree to which a computer system is effective, efficient, and pleasant to use. An effective system is one that is straightforward, prevents errors, and that fits the needs and work practices of the users and the task situation. An efficient system is one that reduces effort, reduces the user’s memory load, and handles errors well. A system that is pleasant to use is one that does not frustrate, confuse, or belittle the user, and one that does not cause physical or mental discomfort (Nielsen 1993). Usability can be contrasted with the idea of utility: where utility concerns what things the system can do, usability concerns how well the system supports people in doing them. Real-time groupware systems are certainly subject to these criteria as well. However, there are two levels at which they can apply, two levels that Salas et al (1995) called taskwork and teamwork. At one level (taskwork), a groupware system is a system for 150
getting things done in an application domain, just like a single-user system; the taskwork is the reason for the group convening in the first place. A groupware system that does not support these domain tasks—one that would be a poor single-user system—will also be a poor group application. However, there is a second level (teamwork) that involves the task of collaboration itself—that is, in addition to the domain task, the group also has to work at working together. This task of managing the collaboration requires group members to communicate, coordinate resources and activities, organize tasks and divisions of labour, monitor and evaluate each other’s work, and follow social rules and conventions that help to keep the group running smoothly. A group’s performance in these tasks is not a trivial matter: success or failure at collaborating can greatly affect success in the domain task. The usability of a groupware system, then, must also be considered in terms of teamwork, and I believe that poor usability in this area is behind the awkwardness and clumsiness of current groupware systems. For the most part, current systems may allow collaborative work to happen, but they remain utilitarian and do little to make collaboration effective, efficient, or pleasant. Groupware usability is therefore the extent to which a groupware system supports the activities of collaboration. A non-exhaustive list of these activities is shown in Figure 68. By support, I mean that people should be able to carry out the activities efficiently, effectively, and pleasantly. A further breakdown of these criteria are also shown in Figure 68. Each of the activities can be considered in terms of each criterion. A usable system, therefore, would reduce effort in communication and improve accuracy; it would reduce errors and allow groups to deal quickly with breakdowns; and it would allow people to work in the style that they want, and would not frustrate or hinder the collaboration.
151
Activities of teamwork:
Usability criteria:
• communication
• efficiency
• coordination
• effort
• coupling management
• quality
• anticipation
• error rate
• assistance
• flexibility
Figure 68. Collaboration activities and usability criteria
7.4 Measuring groupware usability The second issue in clarifying my hypothesis is that of measurement—how can improvements in usability be determined? First of all, effectiveness, efficiency, and pleasance are qualities that cannot be measured directly, and so I turn to indirect measures. In several prior studies, Olson and Olson (e.g. 1992, 1995) have considered three aspects of group activity that fit well with my conception of groupware usability. Their approach measures the product of collaboration, the process of collaboration, and the participants’ satisfaction with the collaboration. •
Product measures rely on the assumption that a group’s success in the collaboration task will influence their success in the domain task. They judge collaboration outcomes in terms of quality or time.
•
Process measures look for patterns in behavioural or verbal activity during a collaborative session and connect these to issues of effectiveness or efficiency. Process measures are often obtained by observation or through video and protocol analysis.
•
Satisfaction measures record participants’ subjective experience with the groupware system, and investigate whether people find the system to be a good setting for collaboration. In addition, measures of satisfaction can also explore people’s perceptions of a system’s efficiency and effectiveness. These measures are usually obtained through questionnaires and interviews. 152
Taking measurements in these three areas allows me to get a broad look at groupware usability. However, measuring product, process, and satisfaction in group activity is not as simple as it might be in an individual activity. There are several issues that make measurement more difficult in a group environment, issues that Grudin (1990) calls “almost insurmountable obstacles to meaningful, generalizable analysis and evaluation” (p. 172). Although I dispute their insurmountability, several of these obstacles must be considered in light of the evaluations to come. These are the difficulty of measuring awareness, the inherent variability and resourcefulness of groups, and the influence of task on measurement. Measuring awareness. Although awareness is the primary tool used in this research, my evaluations focus on measuring usability rather than awareness. The main reason for this is that awareness is difficult to measure (e.g. Adams et al 1995). There are three problems. First, awareness is a hidden mental process that provides few if any outward signs. Second, people have difficulty reporting on their own level of awareness; one problem, as Endsley (1995a) suggests, is that people rate their awareness higher if they have succeeded in a task, and lower if they have not. Third, workspace awareness knowledge can be hard to describe and harder to quantify. For example, it may be difficult to describe in words what another person is doing, and it is even more difficult to assess the correctness and precision of such a description. This final problem led me to discard a method for measuring awareness (the Situation Awareness Global Assessment Technique) (Endsley 1995b). Group variability. There are more sources of variance in groups than in individuals. Not only do groups combine individual variances, but social and organizational factors contribute as well. As Grudin (1990) says, “an individual’s success with a particular spreadsheet or word processor is unlikely to be affected by differing backgrounds or by the personalities of other group members, so single users can be tested in a lab on the perceptual, cognitive, and motor variables that have been the focus for single-user applications. But it is difficult to create a lab situation that accurately reflects the social, 153
motivational, economic, and political dynamics that are quite likely to affect the use of groupware.” (p. 176). As a result, I can expect a broader distribution of possible results, and more difficulty in establishing statistical differences. Group resourcefulness. Not only are groups variable, but also resourceful and adaptable. They can change their behaviour to complete a task even when they must overcome deficiencies in a system. To do this, they may communicate more often, pay closer attention, choose a different strategy, or just put more effort into the task. Monk et al (1996) note that “in an experimental situation, people tend to protect their primary task, getting the work done, at a cost to any secondary tasks or to subjective effort” (p. 126). As a result, “measures based on task performance, for example how well or how quickly the work is completed, are only sensitive to gross changes in the facilities available for communication” (p. 125). This ability to get the job done is a hidden variable that can hide the effects of an independent variable, especially one relating to awareness, since awareness is often useful but not essential to task completion. As a result, I will have to set up tasks that control this hidden variable. The activities that I choose will have to isolate the factors that I am interested in, and I must consider beforehand how groups may be able to overcome the inadequacies of a system. Task influence. Monk et al. (1996) observe that in the long history of research comparing face-to-face communication with mediated communication, one of the clear findings is that “the results obtained depend very much on the experimental tasks used” (p. 125). As a result, I will have to be careful both in choosing my tasks and in interpreting my results, and will have to consider what specific characteristics of my tasks can be generalized to other situations.
7.5 Study overviews Now that a context of methods, approaches, and issues has been given, I will move on to the studies themselves. In preparation for the next two chapters, I will give brief
154
overviews of my two evaluations of WA support: an exploratory usability study, and a controlled experiment. Chapter 8 details an early usability study that was undertaken to assess several awareness displays in a realistic groupware application, to explore the differences between displays, and to gather design feedback. The study used a newspaper layout application, and nine pairs of participants completed two layout tasks with different awareness support. Data included observations, questionnaire responses, and interviews. The study looked particularly at three aspects of the awareness displays: whether they provided appropriate information, whether they were valuable in completion of the task, and whether they distracted participants from their individual work. The study showed that some of the designs were useful and valuable, raised a number of design issues, and provided some understanding of the differences between displays. Some of this feedback was used in the redesign of the radar view (version 2 to version 3) presented in Chapter 6. Chapter 9 describes a later and more focused evaluation of awareness support. I conducted a controlled experiment that compared the effects of providing view and telepointer information on a variety of product, process, and satisfaction measures. The experiment also used construction tasks, this time in a pipeline construction system. Twenty pairs completed several tasks using two systems that provided different amounts of workspace awareness information. The study showed significant improvements in speed and communication efficiency for some of the tasks, and showed that the radar view allowed more effective strategies for completing tasks. Observations of the sessions and participant feedback provide some explanation for these results, and also indicate additional design directions.
155
Chapter 8
A Usability Study
The first evaluation of awareness support was an Operationalization
exploratory usability study that looked at the effects
of
different
displays
on
people’s Evaluation
collaboration. I compared four displays added onto a realistic shared-workspace system. This study was designed both as an investigation of
Application
product, process, and satisfaction, and as test of the displays’ functionality and performance in a task situation. Therefore, it looked both at the effects of awareness on the overall system, and also at the usability of the displays themselves. Participants found two displays based on workspace overviews—versions 1 and 2 of the radar view—to be particularly useful for the layout tasks used in the study. The results also suggested new design requirements for awareness displays: they should support both shared and individual work, should use familiar representations, and should provide ways for users to act on what they see.
8.1 Goals of the study The overall aims of the study were to gather information about how a variety of awareness displays are used when implemented in a realistic groupware system, and to begin assessing the effects of awareness support on groupware usability. In particular, I was concerned with awareness support for medium sized workspaces, where participants can move around independently and engage in mixed-focus collaboration. There is almost no research literature on the use of the devices shown in Chapter 5, and several of my own displays had only been used in tïy applications. Consequently, this study provided
156
valuable experience with the displays, and raised issues that were used as specific questions in later experiments. The study looked both at specific display issues and at overall effects on usability. Evaluation of the displays themselves involved three questions. First, does the display provide the awareness information that participants want? Second, is this information easy to interpret and apply? Third, does the display intrude on individual work, either by using up too much screen space or by distracting people from their tasks? The investigation of overall system usability and the displays’ effects looked at two further issues: how the displays affect people’s perceptions of the quality of collaboration and the quality of the final product; and how participants assess the value of the display in the groupware system. These issues consider the collaborative process and product, but since the measures were subjective, the picture that emerges is seen through the eyes of the participants.
8.2 Methodology Pairs of participants completed a construction task using a specially-built groupware system. The task entailed arranging columns of text, pictures, and headlines into a two page layout for a fictional newspaper. Page layout was chosen because it is a basic construction task that non-expert participants can easily understand, because it involves a medium-sized workspace, and because it requires that participants undertake basic activities of coordinating activity, navigating around the space, and communicating about the artifacts. A real-world example of collaborative page layout is shown in Figure 69. Participants used two different versions of the groupware system that provided different awareness displays. The study used observation, questionnaire, and interview techniques to gather information about the awareness displays. The overall approach was experimental but informal, without many controls on the situation or the task. I attempted to gather a broad range of data while still allowing the collaboration to proceed as normally as possible. This approach allowed me to identify areas of interest during the 157
Figure 69. Collaborative page layout in the real world (from Hubbel 1993) analysis, rather than set out to answer a few specific questions defined beforehand. The following sections describe details of the methodology, including the participants, the organization and setup of the study, the groupware application, and the awareness displays.
8.2.1 Participants Eighteen computer science students participated in the study as paid volunteers. They were paired into nine groups. Participants were allowed to choose their own partner if they wished; if not, they were randomly paired with another participant. The first pair acted as pilot participants to test the groupware system and the experimental methods. Four of the remaining eight pairs had experience working with each other in class groups during the previous semester. All of the participants were familiar with the workstations, optical mice, and X window system used in the study. Most were familiar with the idea of 158
groupware, but none had experience with realtime distributed groupware or the system built for the study. Participants
8.2.2 Physical setup Participants worked at Sun workstations with
Video camera
19-inch colour monitors, separated by a divider
Experimenters
so that they could see neither the other person nor the other workstation. However, participants
Figure 70. Experimental setup
could talk normally across the divider. Two experimenters observed and provided assistance when needed. A video camera recorded one workstation’s screen and the conversation.
8.2.3 Groupware system I built a shared-workspace page layout application for the study, using GroupKit. The system's workspace simulated a two-page newspaper spread, and the artifacts in the workspace included headlines, columns of text, pictures, and banners (see Figure 71A). Participants had equal and simultaneous access to the artifacts, and could perform several kinds of actions on them. People could move artifacts by dragging them, could cut a column of text by double-clicking the middle mouse button on the column, and could join two text columns by dragging one over the other with the middle button held down. Each person's main view occupied most of their screen, but showed only about one-third of the whole workspace (see Figure 71A). Participants could move their main view using scrollbars, and were able to position their views independently: that is, the system used relaxed-WYSIWIS view sharing. In addition to the main view, the system was augmented by various awareness displays, shown in Figure 71 and described individually below.
159
8.2.4 Awareness displays In addition to the main view, systems could incorporate a miniature view, a radar view, multi-user scrollbars, or a cursor’s-eye view. Some of the displays used in this study have already been introduced in Chapters 5 and 6, so the descriptions below will serve primarily as a reminder. •
The miniature (mini) view (Figure 71B) shows an overview of the entire workspace, reduced in area by a factor of 64. This display corresponds to version 1 of the radar view (see Section 6.2). Each artifact in the workspace is represented in the miniature by a solid rectangle: text in grey, headlines in black, and pictures in different colours. The movement of any object is immediately shown in the miniature.
160
A.M ain view The m ain view of the workspace where objects can be m anipulated (in this figure,reduced to 60% ofnorm alsize). B.M iniature view Showsthe entire workspace in m iniature; objects are represented as coloured rectangles. C .Radar view Shows a m iniature of the workspace,plus each user’stelepointer and view rectangle.
D .C ursor’s-eye view Showsa full-size but lim ited area around the other user’s cursor.
G .M ulti-user scrollbar E.Telepointers Show relative positions Show position of F.Teleport others’m ouse Showsthe other ofallparticipantsas cursorsin the person’sm ain coloured bars beside a norm alscrollbar. m ain view. view.
Figure 71. Awareness displays and main view. •
The radar view (Figure 71C) was previously introduced as version 2 of the radar (see Section 6.3). The radar also uses a miniature of the workspace, but shows each person’s viewport and telepointer, using a different colour for each participant.
•
The cursor’s-eye view (Figure 71D) provides full-size details of another person’s interaction, but shows only a limited part of their view (see Section 5.2.2). As a person moves their cursor on a remote machine, the background of the display pans to keep the display centred on the pointer.
•
The multi-user scrollbar (Figure 71G) shows each person’s relative location in the workspace (see Section 5.2.1). The outside control is a standard scrollbar that allows people to move their own view. Beside the real scrollbar are coloured bars showing the current size and position of each person’s viewport.
161
In addition, all configurations of the system provided two basic awareness techniques. First, the main view was equipped with telepointers (Figure 71E) so that people could see each others’ mouse cursors when they were looking at the same objects. Second, I provided teleporting (Figure 71F) as a fast way of glancing at the other person’s part of the workspace. Pressing the right mouse button would immediately scroll the view to the other person's location, and remain there as long as the button was held down.
8.2.5 Task Participants were asked to lay out two pages of a fictional newspaper (The Daily Planet) using the columns, pictures, and headlines that were supplied to them. These objects were initially stacked in piles in the workspace, a separate pile for each story, and participants had to arrange the objects so that the two pages looked like a typical newspaper spread. The initial state of the workspace for the first task, and an example completed layout are shown in Figure 72. Newspaper page layout was chosen as a typical construction task. As discussed in Section 2.4.3, construction tasks involve the assembly of a whole out of parts or pieces. In this task, the pieces are the columns, headlines, and pictures, and the whole is a finished layout. Each group completed two layouts, using their own knowledge of what newspapers
Figure 72. Initial state of the workspace (left) and a completed layout (right). 162
should look like. Groups were allowed a maximum of fifteen minutes for each task. The pair was allowed to organize the completion of the task in any way they wanted, as long as they worked together. They were also asked to ensure that the two pages had a consistent look, a constraint designed to prevent pairs from working totally independently. Groups were allowed to ask questions about the capabilities and functions of the system at any time.
8.2.6 Procedure Participants were introduced to the study and asked to sign consent forms, and were then given a guided tour of the system, its functions, and any awareness displays that were part of the configuration. Participants then practiced the system’s functions, and when they felt comfortable, they began the first task. After fifteen minutes, the pair was stopped and given a questionnaire that explored their experiences with the system. This procedure was repeated for the second task. Finally, I conducted a short interview to investigate events that I had observed during the tasks and to explore particular responses on the questionnaires. The pair were then paid and thanked for participating.
8.2.7 System configurations Six system configurations were used in the study (Table 9 and Table 10). Since one of the Group
Display for Task 1
Display for Task 2
1
Basic configuration
Radar view
2
Radar view
Basic configuration
3
Miniature view
Cursor’s-eye view
4
Multi-user scrollbar
Basic configuration
5
Radar view
Miniature view
6
Miniature view
Multi-user scrollbar
7
Radar view
Radar view and Cursor’s-eye view
8
Radar view
Basic configuration
Table 9. System configurations used by each group 163
goals of the study was to observe a broad range of configurations and combinations, the number of participants using each display was not equalized. The ‘basic’ configuration shown in the tables refers to the system that included only the main view with telepointers and the teleport function. Display
Total Pairs
Basic configuration
4
Multi-user scrollbar
2
Cursor’s-eye view
2
Miniature view
3
Radar view
6
Table 10. Total use of each system configuration
8.2.8 Data collection The experimenters recorded observations about group interaction and use of the system during the sessions. Questionnaires were given after each task; these used 5-point Likert scales and balanced positive and negative questions. The questionnaires are shown in Appendix A. A short interview was also conducted and audio taped at the end of the session. Although I did not directly measure the quality of the product or of the collaboration, the questionnaire and interview explored product and process through participants’ subjective experiences. Satisfaction was judged by asking groups which of the two interfaces they preferred, and why.
8.3 Results and interpretation The study considered whether the displays showed information that people wanted, whether the displays were easy to interpret, whether the displays intruded on individual work, and how participants felt about their effect on the collaboration and the final product. The results are organized below using these issues. I concentrate primarily on the four add-on displays, but also consider the teleport function and main-view telepointers in some cases. First, however, I present a few general observations of the study. 164
8.3.1 General observations All of the groups completed their layouts, and appeared to enjoy using the system. I observed a variety of collaboration styles, from top-down divide-and-conquer approaches where the group assigned tasks and then went off and did them, to close cooperation where the two participants often worked on the same story at the same time. In all of the pairs, manipulation of the artifacts was shared about equally between partners; I did not observe “single scribe” collaboration that has been noted in studies of collaborative writing (Baecker et al 1993). Regardless of the style, all the groups used the relaxedWYSIWIS capabilities of the system to focus at various times on separate areas of the workspace. Even though the layout task did not force tightly-coupled interaction, it was clear that partners in all conditions maintained and used workspace awareness. I saw people gathering awareness information by asking their partner about where they were and what they were doing, or by watching them work (through the interface). People also provided awareness information, primarily by verbally shadowing their own activities and intentions. I also observed utterances and actions that depended on awareness of location or activity, such as frequent deictic reference to artifacts or workspace locations. People also used the awareness displays. Almost all of the participants were clearly interested in them, and gave us thoughtful comments and suggestions about how the displays could be used or improved. In some cases, people even became quite attached to the displays, especially when the second system configuration took away a display that they had liked using in the first! The participants found the radar and miniature views to be the most useful. Participants gave more positive responses to the mini and the radar in both the questionnaires and in the interviews, and expressed their preference for them over the others when they had the opportunity to compare.
165
8.3.2 Amount and type of use People reported that they primarily used them to gather information about the other person in the workspace. However, the mini and radar displays were used in a way I did not initially expect: to aid individual work. For example, people often looked at the mini or the radar to manipulate text columns that were too long to be seen completely in the main view. The cursor’s-eye view was used in more limited ways: one person said that when they knew “that my partner was on a picture…I would use the cursor’s-eye view to determine which picture.” In some sessions, displays went unused because people forgot about them: several users said that they didn’t remember to use the teleport function; another said “to be honest, I kind of forgot about the radar;” and a user of the mini said “most of the time, I did not notice it.” This situation may have been caused by inexperience with the system, but also by the placement and visibility of the displays. The teleport function had no visual reminder of its presence, and the other widgets were small and were placed in the corner of the screen. One user said “the location of the radar was not very good. [It] forced you to look quite a distance.”
8.3.3 Information presented One of the goals of the evaluation was to determine whether the displays collected and presented the right information. I asked questions about amount and type of information, how well the displays showed location and activity, and whether they were missing any information. Responses to these questions were consistently more positive for the systems that provided additional awareness information. That is, the basic configuration was ranked lowest, the scrollbars were given a neutral response, and then increasingly positive responses were given to the cursor’s-eye view, the mini, and the radar. The participants’ responses suggest that they saw a lack of information in the basic configuration, and that the add-on displays (especially the radar) provided some of what they needed for the task. 166
Participants also suggested additional information that the displays could show. For example, the basic configuration was often found to be lacking in location information (e.g. it was “difficult to tell at times where my partner was working”) and in information about the overall workspace (e.g. “[it was] hard to tell [the] layout of the page;” “[it] would be nicer with a full view of the 2-page area.”). This information would have been provided by the radar view, and two participants using the basic system came up with the idea of miniature and radar views as ways to address these deficiencies. Some of the requests concerned information about type of activity and intentions that was not available in any of the displays. Four participants felt that information about “the type of operation being performed by my partner” was missing. Some participants wanted to know when their partner was going to cut a column of text, and two others mentioned that they could not tell when their partner had grabbed an object to move it. This information would have warned them against trying to move the same object. Participants also wanted information about their partner’s intentions. A few comments concerned “what my partner was going to do next” and their “future plan.” Participants agreed that this would be difficult for the system to determine, but some people did make concrete suggestions. For example, one participant wished that he had been able to mark the objects that he was planning to use, so that his partner would know not to take them.
8.3.4 Ease of interpretation A second goal was to determine the interpretation costs of the displays. Information about the other person’s location was considered easier to interpret in the radar and mini views than in the other displays. The cursor’s-eye view was seen as having two problems. The first was a technical problem: the cursor’s-eye animation was not smooth, which may have made it difficult to understand. One user said “identifying where your partner is hard because my partner’s movement in [the cursor’s-eye view] is very jerky.” The second problem was one of context: a few participants said that the display did not show enough of the workspace for them to understand what they were looking at. 167
Feedback about the multi-user scrollbar indicated that although the scrollbars presented the relevant information, it was difficult to actually determine where the other person was. The scrollbar showed each user’s view location, but split the extents of the rectangular view into horizontal and vertical dimensions. To determine where someone was, a user had to mentally integrate information from the horizontal and vertical scrollbars. The radar display, in contrast, showed view location in a form that was already integrated. Participants had little difficulty in determining who was who in the displays. However, since there were only two people in the workspace, they often did not need the colour cues that the displays use to distinguish participants. Several people looked for motion to identify their partner, rather than remembering who was represented by each colour. For example, one participant determined his partner’s location by “wait[ing] to see what was being done on the screen that was not connected to my actions.” Almost all of the participants reported that they were easily able to switch their focus between the main view and the awareness displays, despite the fact that the representation and extents of the awareness display differed from the main view. The overall lack of difficulty may be due to representations that were similar to the main view, and therefore familiar to the participants.
8.3.5 Effects on individual work, collaboration, and product The measures also looked at perceived effects on individual activities, group interaction, and the final layout. I found that the participants were not distracted by the mini or radar displays, and that several people felt the radar had a significant positive effect on their work. Participants stated strongly that the mini and radar views did not distract them or slow down the completion of the task: “not distracting in the least!” said one participant. The scrollbars and the cursor’s-eye view did cause problems: two people found that the
168
scrollbars distracted them from their tasks, and another considered the cursor’s-eye view “almost distracting” because it “shows too small an area to gain any real benefit from it.” There was also a perceived effect on the final product. Several participants volunteered that the radar and mini views improved the layout. For example, they said “we really needed the radar to help in the overall appearance,” “the final result would have been much worse without the radar display,” and “the radar screen made the task possible... I think without it would have been difficult to complete the task.” Despite enthusiasm for the radar and mini views, I did not observe major differences in the quality of the interaction or of the layout. Based on an informal review of final products, all pairs created reasonable layouts in fifteen minutes; also, groups with unaugmented systems did not seem to have a great deal more difficulty in carrying out their tasks than groups with the mini or radar displays. This may be due in part to the insensitivity of the measures, or to the normal adaptability of groups, as discussed in the previous chapter.
8.3.6 Perceived value It was clear that the participants in the study found some of the displays valuable. Participants felt strongly that the radar was a valuable addition to the system, and that the radar and mini displays were worth their screen space. When comparing the two system configurations that they had used, participants almost always preferred configurations incorporating these displays (see Table 11). One participant said “it really felt like you were working on the same big table,” and I received joking complaints when the second system “took away” the radar view. The interviews suggest that the value of these displays was about evenly divided between their ability to assist individual work, and the workspace awareness information that they provided. Group
Configuration preferred
1
Radar view over basic configuration
2
Radar view over basic configuration 169
3
Miniature view over cursor’s-eye view
4
No preference (Multi-user scrollbar or basic configuration)
5
Radar view over miniature view
6
Miniature view over multi-user scrollbar
7
Radar view over radar + cursor’s-eye view
8
Radar view over basic configuration Table 11. Configuration preferred by each group
8.4 Discussion The study has exposed some of the issues underlying the usability of awareness displays. In this section, I consider some of these issues, discuss the implications for groupware designers, compare my findings to previous work, and comment on possible limits to the generality of my conclusions.
8.4.1 Underlying issues The study shows that the radar and mini views were fairly useful in a collaborative pagelayout task, and that the multi-user scrollbar and the cursor’s-eye view were less useful. Some explanation of these findings can be seen in the relationship between individual and group work, the coupling of perception and action, and the idea of familiar representations. Supporting group and individual awareness. Participants found the radar and mini views useful for individual work as well as for keeping track of the other person. This came as a surprise, as the overviews were intended simply as backgrounds for workspace awareness information. In retrospect, however, it seems obvious that overviews have intrinsic value for individual work; they provide global context about the task and also help people orient themselves and their activities within the workspace. Supporting perception and action. In some cases, participants had difficulty making use of the information gathered from the displays. One person said “it was easy to get info 170
about my partner but the ‘bridge’ between getting info about and then proceeding to go over to where my partner was, is slow.” He had seen his partner do something in the cursor’s-eye view that he wanted to help with, but it took him a long time to scroll his main view to where she was. Others wanted to be able to manipulate objects in the miniature, or navigate by dragging their radar view rectangle. Insight into these difficulties is given by Neisser’s model of the perceptual cycle (see Section 2.2.1). Since exploration of an environment is directed by the information that we have already picked up, it is natural that people would want to act on the information available in the radar view. Furthermore, it seems appropriate to take action in the same context where the information was gathered. If the participant had been able to reach into the cursor’s-eye view and move the objects shown there, the bridge between perception and action would have been considerably shorter. Familiarity of representation. The similarity between the main workspace and the radar’s scaled representation appeared to help people interpret additional information such as view extents and cursor location. The small scale and low fidelity did not seem to be a problem, suggesting that shape, relative size, and area provide sufficient cues for mapping between the radar and main views. In contrast, the multi-user scrollbar had an unfamiliar representation: it showed view locations on an abstract scale (the length of the scrollbar), which had no spatial connection to artifacts or distances in the actual workspace. This presentation limits the information that can be drawn from the scrollbar, and unless two indicators are perfectly aligned, it is difficult to determine exactly which artifacts can be seen by both people.
8.4.2 Comparison to previous work A number of this study’s conclusions can be contrasted with previous CSCW research. In particular, I consider previous usability studies of awareness displays, the issue of distraction, and the principles of passive collection and workspace presentation of awareness information.
171
Baecker and colleagues (1993) report on the only other usability study that I know of to include awareness displays. They evaluated a synchronous text editor that included a multi-user scrollbar and a text overview similar to the radar view (see Figure 58 in Chapter 6). They do not provide detailed results, but say that “most subjects were able to use SASSE’s… collaborator awareness mechanisms successfully” (p. 404). This contrasts my results with the multi-user scrollbar; however, this display better suits a text editor than the layout system since text usually has only one dimension. Ellis, Gibbs, and Rein (1991) considered the issue of distraction in groupware interfaces, and state that these interfaces should present information but not be overly distracting. Experiences in this study leads me to some speculation on this issue. It is commonly thought that distraction is caused by perceptual information that draws our attention, but distraction may have as much to do with interpretation difficulty as it does with salience. If people already have a good sense of workspace awareness, then changes in a display like the radar are expected and will generally not distract. Ellis et al. state that groupware participants “are generally not as aware of others’ contexts and can less easily interpret sudden display changes resulting from others’ actions” (p. 49). To this I add that if people can stay aware of others’ contexts, then display changes will be easier to interpret and thus less distracting. Finally, Dourish and Bellotti (1992) offer a principle for supporting awareness in groupware workspaces. They state that awareness information should be “presented in the same shared work space as the object of collaboration” (p. 107). The present study used multiple views of the workspace, and suggests that it is not so much which display contains the information, but rather that the workspace context provides a valuable aid to interpretation of awareness information.
8.4.3 Critical reflection There are a variety of issues that may limit the generality of my conclusions. The two most important concern group size and task type. First, how will these displays scale to 172
larger groups? Many of my results may change somewhat if more than two people are in the workspace. It is possible that in larger groups (i.e. 3-5 people), view rectangles and telepointers would clutter the radar display. In the mini view, participants will have far more difficulty in determining who is moving an artifact, since they can no longer adopt the “if it’s not me, then it’s my partner” identification strategy. Although the radar shows different coloured telepointers that can assist in identifying people, this technique forces users to map colours to people. The cursor’s-eye display and the teleport capability are not themselves affected by additional people, since they show only one person; however, users would have to decide whom they wished to track using these display, or sacrifice more screen space to have multiple cursor’s-eye views. I believe that none of these concerns would render the displays useless in a larger group, but it is obvious that they must be examined in more detail. The second issue concerns how my results generalize to tasks other than page layout. Layout is one kind of construction task, and shares several characteristics with others of this variety. For example, the task is completed through spatial manipulation of the artifacts, and both the spatial relationships between artifacts and the overall appearance of the workspace are important factors in completing the task successfully. Overview displays such as the radar view should thus be useful in other kinds of construction tasks that take place in medium-sized workspaces, such as drafting, assembly, or design.
8.5 Summary This chapter has detailed a usability study of several awareness displays in a page-layout groupware system. The study suggests that overview displays are useful both for individual activities and for helping people maintain workspace awareness. In addition, the results suggest that interpretation costs can be lowered if displays present awareness information in a familiar context, and that displays should allow people to act on the information provided.
173
This study was a valuable first step in exploring both the mechanics of specific displays and the effects of awareness support on groupware applications. The design information uncovered here has been used in the redesign of the radar view (as described in Chapter 6). The measures used in this evaluation, however, were not precise enough to answer many questions about whether awareness support improves the usability of groupware systems. Using experience gained in this initial study, I carried out a more formal experiment designed to measure usability with greater precision. The next chapter reports on that study.
174
Chapter 9
A laboratory experiment
My research hypothesis is that increased support Operationalization
for the maintenance of workspace awareness will increase the usability of real-time distributed Evaluation
groupware systems. This chapter looks at a more specific version of that hypothesis: whether adding awareness information to a groupware
Application
interface allows people to complete tasks more quickly and with less effort. Previous chapters have discussed how awareness of others can help make collaboration more effective, efficient, and robust. In particular, Chapter 8 provided qualitative evidence that awareness support is valuable. It also showed that workspace miniatures are useful vehicles for this information. In the experiment discussed here, I go beyond the previous study and consider the quantitative effects of awareness support on groupware usability. I compare people’s collaboration when using two groupware interfaces that provide different amounts of awareness information through workspace miniatures. In particular, I compare a basic miniature to one that adds three kinds of information: •
the location of others’ viewports in the workspace;
•
the location and motion of people’s cursors; and
•
the motion of workspace objects as they are moved.
The awareness-enhanced version of the miniature has already been introduced in Chapter 6 as the radar view (a variant of version 3). The experiment measures three aspects of groupware usability: how well groups perform with each interface, the efficiency of their communication, and the group’s satisfaction with the system. In addition, I look at the strategies that groups use to carry out their tasks.
175
The adaptability and resourcefulness of groups makes groupware difficult to evaluate (Grudin 1990; Monk et al 1996). Previous studies have considered awareness information primarily in terms of different modes of communication. For example, Chapanis (1975) showed that a distributed construction task was accomplished more quickly when participants could talk to one another than when they communicated by either handwriting or typing, but that the addition of a video link did not have any effect. This and other experiments suggest that performance in problem-solving tasks is “only sensitive to gross changes in the facilities available for communication” (Monk, 1996, p. 125). Nevertheless, I believe that support for awareness will make substantial differences to usability, because of the importance of the workspace in collaborative interaction. As discussed in Chapter 2, the workspace is an external representation of a joint activity, and a stage on which the collaboration is acted out. Other researchers have recognized that a shared workspace and the artifacts in it change the way people communicate through actions, speech, and gesture (see Section 3.5.1). Workspace awareness is one of the keys that allow people to interact in and through the shared workspace. This study takes initial steps towards an empirical understanding of the role played by workspace awareness, and of how to support it in groupware.
9.1 Method The study’s basic question asks whether adding information about another person’s location and activity in the visual workspace will help groups complete tasks. In particular, I compared people’s performance, perception of effort, and verbal efficiency for two interfaces that provided different levels of awareness support4. Both interfaces
4
I compared systems with different levels of support, rather than one system with support and another without support, for two reasons. First, it is difficult if not impossible to remove all awareness support from a groupware system—that is, people can use a variety of cues to determine the activities of another group member. Second, since the radar’s workspace miniature is useful for individual work as well as group work, a miniature had to be part of both systems to avoid giving one condition an advantage. 176
used workspace miniatures, but the basic overview only showed information about the local participant, whereas the radar view added information about the location and activity of others in the workspace. Groups completed three kinds of tasks to provide a broader perspective on awareness in collaborative situations. Groups also worked with both interfaces, and were asked afterwards which they preferred.
9.1.1 Groupware system and experimental conditions I built a direct-manipulation groupware application for the experiment, using GroupKit. The application, a pipeline construction kit, allows the assembly and manipulation of simple pipeline networks in a shared two-dimensional workspace (Figure 73). Users can create, move, and rotate sections of pipe, and can join or split sections using a welding tool. The workspace is rectangular, and three times larger than the computer screen in each direction. Users scroll around the workspace by dragging their cursor past the window border.
177
Radar view Main view
Partially-completed pipelines
Storehouses
Welding tool
Welds
Remote telepointer
Figure 73. The pipeline application (radar view version) The pipeline system’s interface consists of two windows. The main view takes up most of the screen and shows objects in full size and detail. The main view allows users to manipulate objects and to scroll to other areas of the workspace. People create pipelines by dragging pipe sections from storehouses in the corners of the workspace (see Figure 73), aligning the sections, and then welding them together by dropping a diamond-shaped welding tool onto the joint. Welds are marked by a yellow square, and once pieces are welded, they move as a unit. The second window is one of two miniature views, the radar view or the overview. This view is inset into the top left corner of the main view, and shows the entire workspace in miniature. The radar view and the overview differed in three ways, as compared in Figure 74. 1. The radar showed workspace objects as they moved; the overview was only updated 178
after the move was complete. 2. The radar showed both people’s viewports (the area of the workspace visible in each person’s main view) and the overview showed only the local user’s viewport. 3. The radar showed miniature telepointers for both users, and the overview did not show any telepointers.
Viewports
Telepointers
Local viewport
Figure 74. Radar view (left) and Overview (right). The system also provides several basic groupware features in both experimental conditions, features evident only in the main view. The system gives feedback on others’ actions by showing object movement in all main views, and by displaying main-view telepointers whenever users’ main views overlap. The system also implements an optimistic locking mechanism to manage simultaneous actions on objects in the workspace (e.g. Greenberg and Marwood 1994). In sum, the two conditions differed only in the awareness information presented in the miniature. The overview only showed information about the local user, while the radar showed where the other person was located, showed their pointer, and showed moves as they occurred.
9.1.2 Tasks Participants completed a practice task and three kinds of test tasks. The test tasks were 179
designed to mimic episodes and activities that I observed in face-to-face collaboration, but were constrained to meet three criteria. First, I wanted tasks that required people to move independently around the workspace. Second, I wanted people to need awareness of their partner, and in particular, to use location or activity information. Third, I wanted tasks that were as realistic as possible and likely to occur in a wide variety of workspace activities. As a result, the test tasks are more controlled than the practice task. I imposed controls on how the task was to be carried out to reduce the amount of variance introduced by group variability and resourcefulness, as discussed in Chapter 7. I adopted this approach after an early pilot study with an open-ended task suggested that differences between conditions could be easily overshadowed by differences between groups. In the test tasks described below, division of responsibility in the tasks is similar to Chapanis’ (1975) communication studies, where a source person has information that a seeker person needs to do their part of the task. The practice task was an open-ended construction task where the group was asked to build a pipeline network given to them as a schematic diagram. This task gave participants a chance to become familiar with the system and the session procedure. The initial configuration of the workspace and the schematic of the goal state are shown in Figure 75. The Follow task asked participants to make ten specific welds on an existing pipe network. One person, the joiner, was given a paper map (Figure 76) showing the locations to be welded, and had to prepare the pipe sections at each place. The other person was the welder, and would follow the joiner to each location and weld the pipe. Since the welder had no map, the joiner was also responsible for ensuring that the welder went to the correct location. The workspace map for the first Follow task, showing the initial pipeline layout and the ten welding sites, is shown in Figure 76. The map also shows the initial state of the workspace at the start of the task. Materials for the second set of tasks are shown in Appendix B. 180
Figure 75. Practice task initial state (left) and schematic of goal (right)
3 5
6 4
10
7
8
9
1
2
Figure 76. Workspace map for the first Follow task The Copy task asked participants to construct two identical structures from two existing stockpiles of pipe sections. The stockpiles were located at opposite ends of the workspace. One person, the leader, had a paper picture of what was to be built, and used this to find the next piece in their stockpile. The other person, the copier, did not have the picture, and so had to copy the leader’s actions. The leader was responsible for making sure that the copier knew which piece to take next and where to place it. The initial state of the workspace and the first picture of what was to be built are shown in Figure 77.
181
Construction Areas
Stockpiles
Figure 77. Initial workspace state (left) and first goal (right) for the first Copy task The Direct task asked one participant to verbally guide the other through adding six specific pipe sections to an existing network. The director had a map showing which pieces were to be added, and where they were to be added, but was not allowed to move around in the workspace. The actor did the work, following the director’s instructions. The director did not see their main view during this task, so the only visual feedback that they received of the actor’s progress was from the miniature view. The workspace map
6
3 4 2
5
1
Figure 78. Workspace map for the first Direct task 182
for the first directing task is shown in Figure 78; the pieces to be added are shown in grey. These three tasks were chosen because they contain particular joint actions that are common to many construction tasks in shared workspaces. These are: the Follow task involves meeting another person at a specified location in the workspace; the Copy task involves indicating an object to another person; and the Direct task involves telling another person how to get to a specific location. These joint actions are repeated several times in each task, in order to stabilize performance.
9.1.3 Study design The study used two designs, the first for a formal analysis and the second for an exploratory analysis. The formal study combines two independent variables in a two-way mixed factorial design: View is a between-participants factor, and Task is a repeatedmeasures factor. The hypothesis is that the additional awareness information in the radar view will improve people’s speed, efficiency, and satisfaction with a groupware system. The hypothesis is tested by looking for effects of View in interaction with Task. Differences between tasks are expected, since the different task types are not related. Three dependent variables are measured within each cell of the diagram in Table 12. These variables—completion time, perceived effort, and communication efficiency—are discussed in Section 9.1.4.
View:
Weld
Task: Copy
Direct
Radar view
Pairs 1-10
Pairs 1-10
Pairs 1-10
Overview
Pairs 11-20
Pairs 11-20
Pairs 11-20
Table 12. Experimental design for formal experiment. In addition to the between-participants comparison, I wanted to gather preference data; therefore, participants used both the radar and overview interfaces. After finishing the first three tasks, groups were asked to complete a second set of tasks using the other interface. They then chose which interface they preferred. The same three measures were 183
taken for the second set of tasks, so that exploratory within-participants analyses could be carried out as well. The exploratory design encloses the first, and combines three independent variables in another two-way mixed design: View is now a within-participants variable, Order is a between-participants variable, and Task is again a repeated-measures variable but now nested within View. In Table 13, the shaded cells correspond to the primary design above. View:
Weld
Radar view Task: Copy
Direct
P 1-10
P 1-10
Overview first: P 11-20
P 11-20
Order:
Radar first:
Weld
Overview Task: Copy
Direct
P 1-10
P 1-10
P 1-10
P 1-10
P 11-20
P 11-20
P 11-20
P 11-20
Table 13. Experimental design for exploratory data collection (P = Pair).
9.1.4 Measures of groupware usability I use five measures in this study: completion time, perceived effort, verbal efficiency, overall preference, and strategy use. However, since groupware usability is not directly observable, these measures can only assess the construct indirectly. The connection between the measures and groupware usability follows the structure set out in Chapter 7. First, groupware usability is the extent to which a system supports people in performing the activities of collaboration (such as communication, coordination, or coupling). Second, “goodness” in these activities is defined by a set of criteria (such as efficiency, effort, or speed). Third, differences in these criteria will have observable effects on the process of collaboration, the product, and on participant satisfaction. In particular, my measures were chosen for the following reasons. 1. Completion time is a basic measure of product performance. It assumes that there is a relationship between the activities of collaboration and the speed at which a group can perform the task.
184
2. Verbal efficiency is a more direct measure of communication. It involves the criteria of efficiency and error rate. Note that this measure assesses efficiency in terms of task rather than time—that is, the verbal communication required to convey a fixed amount of information. 3. Perception of effort is a subjective measure of the criterion of effort for the activities of collaboration. I recognize, however, that people will have difficulty differentiating between these activities, and so the measure only collects overall information. 4. Overall preference is a broad satisfaction measure based on a comparison of the two systems. It assumes that there is a relationship between overall usability and preference: that participants will prefer a system that better supports the activities of collaboration. 5. Strategy use is a qualitative process measure that looks at how groups in the different conditions carried out the task. I assume that a more usable system will allow groups to choose more appropriate strategies for each task. Table 14 categorizes these measures in terms of product, process, and satisfaction. In using several different measures, my aim is to obtain a broad perspective on the usability of these systems. A broad view, however, can only see larger features; therefore, my analysis will only be able to find more obvious differences between the two systems. In addition, since these measures look at different aspects of the same construct, they may not be completely independent of one another. For example, an unusable system could lead both to larger completion times and to increased perception of effort. However, I believe this to be an unavoidable consequence of looking at groupware usability from several angles, and I am willing to sacrifice some precision for the benefits of a broader view. In addition, there are enough differences between the measures that I will treat them as different families of data during analysis. Type of measure
Measure used
Product
Completion time
Process
Verbal efficiency, perception of effort, strategy use 185
Satisfaction
Overall preference Table 14. Summary of measures used
9.1.5 Participants Participants were recruited from the student community at the University of Calgary, and were paid $10 for taking part in the study. Criteria for inclusion, as indicated during recruitment, were that participants be fluent in English, experienced with mouse-andwindow-based applications, and familiar with scrolling, pointing, clicking, and dragging operations. Participants were disallowed if they had been involved with any previous workspace awareness studies. Excluding one pair whose data were not used (see Section 9.2.1), forty people participated in the study, 30 men and 10 women. Although there were unequal numbers of female and male participants, sex pairings were equalized across the two conditions, as shown in Table 15. Pairing:
Overview Condition Radar Condition
Male-Male
6 pairs
6 pairs
Female-Female
1 pair
1 pair
Female-Male
3 pairs
3 pairs
Table 15. Sex pairings of experimental groups Participants ranged in age from 19 to 48 years, and averaged 27.4 years. Participants were assigned a partner for the study, either by choosing one themselves or by random assignment. Most people reported that they interacted with their partner either rarely or often, as shown in Figure 79. Although I did not control for familiarity, these two groups were represented about equally in the two conditions.
186
Number of participants
20
17 15
15 10 5
2
3
0
0 Less than 1
1
2
3
3+
Number of interactions per week
Figure 79. Familiarity of participants with their study partners Participants had limited prior experience with groupware. The only groupware systems that participants used more than once per week were multi-player games (eight participants), and email systems and web browsers (all participants). None of the participants had previously seen the groupware system used in the study.
9.1.6 Procedure The experiment was carried out in several stages. Participants were first asked to sign consent forms and fill out a short demographic questionnaire, and then were introduced to the situation and the system’s functions using standardized instructions. Pairs were randomly assigned to either the radar or the overview condition, and the specifics of their miniature view were explained. Participants were then allowed to practice with the system until they could each perform a basic set of simple operations such as scrolling, drag-scrolling, welding, and unwelding. Pairs then completed seven tasks with the pipeline system, in the sequence shown in Table 16. After a practice task, groups completed three tasks with one version of the system (either radar or overview), and then completed three more tasks with the other version. For each task, a similar procedure was followed. First, the experimenter gave standard instructions regarding the task and the goal. Second, the pair completed a practice trial in the task: for example, the pair would be asked to make one practice weld 187
in the Follow task. Third, the pair carried out the task. Fourth, participants filled out a questionnaire relating to their experiences during the task. After all tasks were completed, participants also filled out a final questionnaire relating to their preferences. A short interview was then conducted to follow up particular episodes observed during the session or particular questionnaire responses.
Radar 1st st
Overview 1
Practice task
Tasks 1-3 (radar)
Pairs 1-10
Pairs 1-10
Tasks 1-3 (overview)
Tasks 4-6 (radar)
Tasks 4-6 (overview) Pairs 1-10
Pairs 11-20
Pairs 11-20
Pairs 11-20
Table 16. Task sequence for radar and overview conditions Pairs completed tasks 1-3 with one view, and then completed tasks 4-6 with the other. The second three tasks were intended primarily to give participants experience with both interfaces, so that they could decide which they preferred at the end of the session. Task order was counterbalanced (for example, group 1 did the first three tasks in the order 1-23, group 2 in the order 1-3-2, etc.). The second three tasks were always done in the same order as the first three tasks. Since there are six potential orderings of three tasks, but only 10 pairs in each condition, two orderings in each condition were used only once rather than twice.
9.1.7 Data Collection Four types of data were collected, in addition to experimenter observations. 1. The time to complete each task was recorded with a stopwatch. 2. The pair’s workspace actions and verbal interactions were recorded on videotape, and parts of the verbal record were later transcribed. 3. Participants answered questions about perceived effort after each of the six test tasks. Questions were either balanced 5-point Likert scales (agree/disagree) or 5-point scales
188
with fixed endpoints (see Table 17)5. Since each person within a pair may have had a different experience, I collected these data as individual rather than pair responses. 4. Participants were asked their preference between the two systems after they had completed all tasks. Again, I collected these data as individual rather than pair responses. How difficult was it to complete this task?
difficult
•
•
•
easy
little effort
•
•
•
a lot of effort
How hard did you have to concentrate to do this task?
not hard
•
•
•
very hard
How difficult was it to discuss things during the task?
easy
•
•
•
difficult
How much effort did this task require?
Table 17. Perceived-effort questionnaire
9.1.8 Physical setup Participants worked at separate workstations, angled so that they could not see each others’ screens, but so that they could see one another and talk easily. The experimenter sat at a recording station at the back of the room. The actions of both participants were transmitted to a third computer that showed a composite of the workspace. This computer’s screen and both voices were recorded on videotape. The layout of the experiment room is shown in Figure 80.
5
As the format of the questionnaire does not clearly indicate that scales had five points, participants were reminded before filling out each questionnaire that they could select any of the five responses, including the endpoints. 189
Participants Video camera Experimenter
Figure 80. Experiment room setup
9.2 Results In the following sections, I report on the results of several analyses performed on product, process, and satisfaction measures. I first present the results of the formal study: that is, the results obtained from a group’s first three tasks. Second, I present participants’ preferences. Third, I discuss results of the within-participants exploratory study. Fourth, I summarize participants’ strategy use.
9.2.1 Data usage and corrections One pair’s data was removed from the sample since they were unable to complete the practice task without extensive assistance from the experimenter. This difficulty involved interpretation of the experimental materials rather than any aspect of the experimental condition. All other pairs were able to complete all tasks without help, although two pairs did not complete the second set of tasks due to time restrictions. In five cases, completion times were adjusted after the session because of system or network problems; the amount of time subtracted was determined by watching the video record. In all cases, I believe the corrected time to be a true reflection of completion time. In addition, two groups in the radar condition were not recorded on videotape due to technical problems, and so they are not included in the analysis of communicative efficiency. I was, however, able to carry 190
out a complete analysis with the reduced sample. Therefore, I do not consider any of these issues to be severe enough to affect the results or conclusions of this study.
9.2.2 Completion time The primary hypothesis concerning the product of collaboration was that participants would be able to complete tasks more quickly using the radar view than they could using the overview. Completion times were recorded for each task. Times for tasks 1-3 are summarized in Table 18, and shown in Figure 81 (error bars indicate standard deviation). Tasks took participants between about two and about eight minutes; for Follow and Direct tasks, the average completion time was less for the radar condition than for the overview condition. Task
View
N
max
min
Follow 1
Radar
10
4.73
2.05
3.21
0.84
Overview
10
7.82
2.22
4.58
1.54
Radar
10
4.77
2.20
3.36
0.91
Overview
10
4.52
1.70
3.12
0.90
Radar
10
4.20
2.38
3.19
0.63
Overview
10
5.87
3.02
4.39
1.07
Copy 1 Direct 1
Mean
sd
Table 18. Summary of completion times (in minutes) for tasks 1-3 7
(significant)
(significant)
6 5 4
Radar
3
Overview
2 1 0 Follow
Copy
Direct
Figure 81. Mean completion times (in minutes) for tasks 1-3 191
I compared the independent variables Task and View using two-way analysis of variance (ANOVA). There was an interaction between Task and View (F = 7.772, p < 0.05). As mentioned above, differences between task types were expected and were not analyzed. To explore the effect of View in the interaction, posthoc comparisons of radar and overview completion times were carried out for each task type. For the Follow and Direct tasks, I used one-tailed t-tests in accordance with my research hypothesis. However, means in the Copy task were not as expected, and so do not meet the assumptions for a one-tailed test. As a fallback for this task, I used a two-tailed test instead. A Bonferroni correction was employed to maintain alpha below 0.05; therefore, only those effects with p < 0.0167 were considered significant. Of the three tasks, differences in Follow and Direct were significant. Results of the posthoc comparisons are summarized in Table 19. The proportion of variance accounted for by View is indicated by the squared pointbiserial correlation coefficient (r2pb). The coefficient indicates that only about one-quarter to one-third of the variance in the sample is accounted for by View; however, as outlined in Chapter 7, greater overall variance was expected in this experiment. Task type
df
tails
t (obtained)
p
r2pb
Follow 1
18
1
2.48
< 0.0167
0.255
Copy 1
18
2
-0.580
= 0.569
Direct 1
18
1
3.05
< 0.0167
0.341
Table 19. Comparisons of completion times for tasks 1-3
9.2.3 Communication efficiency Verbal interaction in the first three tasks was recorded and transcribed. Communication efficiency was measured by counting the number of words in particular categories that matched the repeated joint action in the task. In the Follow and Direct tasks, the category included any words that the group spoke in establishing where the welder or actor was to go next. For example, the category included words spoken by either participant that described locations, provided directions, or clarified location information. When the welder or actor arrived at the correct location, counting stopped: that is, the category did 192
not include talk about the location or orientation of particular pipe sections. For the Copy task, the category included any words that the group spoke in establishing which pipe section the copier was to select next. For example, the category included words spoken to indicate a piece, describe a piece, or clarify a description. Counting stopped once the copier selected the correct section. Two assistants each coded half of the transcripts and counted the words in each category. On a test set of four transcripts, inter-rater agreement between the two coder’s counts (using Pearson’s r) was above 80% for all three tasks. Word counts are summarized in Table 20, and mean counts are illustrated in Figure 82 (error bars indicate standard deviation). Task
View
N
max
Follow 1
Radar
8
123
64
98.75
21.77
Overview
10
348
103
221.43
77.09
Radar
8
224
0
129.08
86.55
Overview
10
133
1
73.30
49.59
Radar
8
345
104
223.50
81.40
Overview
10
427
138
280.97
98.09
Copy 1 Direct 1
min
Mean
sd
Table 20. Summary of verbal efficiency (in number of words) for tasks 1-3 400 350 300
(significant)
250
Radar
200
Overview
150 100 50 0 Follow
Copy
Direct
Figure 82. Mean verbal efficiency (in number of words) for tasks 1-3
193
Analysis of variance again showed an interaction between Task and View (F = 17.03, p < 0.05). To assess the effect of View on verbal efficiency, I compared radar and overview conditions for each task type. I used one-tailed tests for the Follow and Direct tasks; again, means for the Copy task did not meet my assumptions for using one-tailed tests, so a two-tailed tests was used. Tests showed a significant difference only for the Follow task. A summary of the comparisons is shown in Table 21. Task type
df
tails
t (obtained)
p
r2pb
Follow 1
18
1
4.34
< 0.0167
0.541
Copy 1
18
2
-1.72
0.104
Direct 1
18
1
1.32
0.101
Table 21. Comparisons of verbal efficiency for tasks 1-3
9.2.4 Perceived effort Perception of effort was measured by a repeated questionnaire given after each task. Responses were gathered from each individual (rather than from each pair). The questionnaire looked at four aspects of how hard a task was: (1) overall difficulty, (2) effort required, (3) concentration required, and (4) difficulty discussing the task. Questions used five-point scales with semantic anchors (see Table 17). Responses were translated to interval scores, using 1 to represent least effort and 5 to represent most effort6. Table 22 summarizes mean responses for each question in each task, and Figure 83 illustrates the means. Note that lines connecting the points are intended only to visually differentiate the two conditions, not to imply connections between questions. Task: Question: Mean
Radar
Follow 1 1
2
3
Copy 1 4
1
2
3
Direct 1 4
1
2
3
4
1.65 2.05 2.55 1.70 1.90 2.30 2.40 2.15 1.90 2.40 2.50 2.20
Overview 2.10 2.75 2.75 2.15 1.30 1.55 2.30 1.50 2.15 2.55 2.80 2.70
6
Converting categorical data to interval scores misrepresents the data to a certain degree; however, χ2 analysis was not possible on the data due to low expected values. 194
1. How difficult was it to complete this task? 2. How much effort did this task require? 3. How hard did you have to concentrate to do this task? 4. How difficult was it to discuss things during the task?
5 Radar Overview
Perceived Effort
4
3
2
1 1
2
3
4
1
Follow
2
3
4
1
2
Copy Task and Question
3
4
Direct
Figure 83. Mean questionnaire responses for tasks 1-3 SD
Radar
0.75 0.94 0.94 0.86 0.91 1.03 1.05 1.09 0.79 0.99 0.95 0.95
Overview 1.07 0.97 1.02 1.09 0.57 0.69 0.98 0.69 0.99 0.89 1.01 1.30 Table 22. Summary of questionnaire responses, tasks 1-3 I compared responses from radar and overview conditions on each question. Again, I used one-tailed tests for Follow and Direct tasks; again, means for the Copy task did not match my assumptions for using one-tailed tests, so two-tailed tests were used. Alpha of 0.05 was divided between the 12 tests; therefore, only results where p < 0.0042 were considered significant. None of the comparisons showed significant differences. Comparisons are summarized in Table 23. Question
Follow 1
Copy 1
Direct 1
df
tails
p
df
tails
p
df
tails
p
1
38
1
0.0656
38
2
0.0171
38
1
0.1910
2
38
1
0.0130
38
2
0.0101
38
1
0.3088
3
38
1
0.2619
38
2
0.7566
38
1
0.1686
195
4
38
1
0.0780
38
2
0.0299
38
1
0.0868
Table 23. Comparisons of perceived-effort questions
9.2.5 Preferences After all tasks were completed and pairs had used both interfaces, participants were asked three questions about which system they preferred. The questions asked which system better supported collaborative work, which system was easier to use for group tasks, and which system the participant preferred overall. Almost all of the participants who responded chose the radar view, as shown in Table 24. Which system:
Radar
Overview
1. …better supported your collaboration
35
3
2. …was easier for group work
38
0
3. …did you prefer overall
38
0
Table 24. Number of participants preferring each interface I analyzed these responses using one-way χ2 tests, summarized in Table 25. Again, alpha was maintained at 0.05. Not surprisingly, the number of participants choosing the radar condition was significantly higher than the expected number for each question. χ2
df
p
Question 1
26.95
1
p < 0.0167
Question 2
38.00
1
p < 0.0167
Question 3
38.00
1
p < 0.0167
Table 25. χ2 analysis of preference questions
9.2.6 Strategy use I also looked at the strategies that groups used to carry out the tasks, in order to compare the ways that people worked across the conditions. In particular, I recorded the strategy used to indicate locations (for the Follow and Direct tasks) and to indicate pieces (for the Copy task). I identified strategies subjectively by watching the session videotapes. People 196
Strategy Relative-to-you
Used in Follow, Direct Describe-location Follow, Direct Left-right-topFollow, bottom Direct Relative-to-previous Follow, Direct Map coordinates 3x3 Follow, Direct Pipe-tracing Direct Follow-rectangle
Follow
Relative-to-us
Follow
Move-piece-to-show
Follow
1D-relative-and-wait
Follow
Follow my cursor Describe-piece
Follow Copy
Show by move Show by drag Show by drop Show by placing
Copy Copy Copy Copy
Description Directions based on the other person’s current location: e.g. “up and left from where you are” A description of an object at the location: e.g. “the squiggly looking thing” Rough coordinate system dividing the workspace into four blocks: e.g. “next one is in the top left corner” Directions based on a previous identified location: e.g. “near where we were for the last one” Directions based on a 3 by 3 grid: e.g. “go to 1,2” Directions to follow a line of pipe: e.g. “follow this pipe along to the right, and then it goes up” One person tracks the other by following their view rectangle in the radar Directions given when both participants are in the same place: e.g. “now down and a little to the left from here” One person moves a pipe section to indicate a location through the radar or overview Directions to move up, down, left, or right, after which the person giving directions waits until success is established One person follows the other’s main view cursor A description of the next piece to be used: e.g. “it’s an elbow section with a medium straight on the end” The piece is moved back and forth in the storehouse The piece is dragged up to the construction area The piece is moved outside the storehouse and dropped The piece is moved to the construction area and placed
Table 26. Strategies used for directing and indicating used a wide variety of methods, both verbal and nonverbal, for indicating locations and pieces. The variety is an indication of how resourceful groups can be, as discussed in Chapter 7. The strategies are described below in Table 26. There were several differences in strategy use between the two conditions, differences that can be partly attributed to the information available in the two interfaces. Strategy use is summarized in Table 27. There were differences in what strategies were used, the amount each type was used, and in how they were used. To begin with, people used a 197
variety of strategies in both conditions, but the types used were not the same. In general, groups in the overview condition used a wider range of strategies than groups in the radar condition. Strategies that I observed only in the overview condition include pipe-tracing (Direct task), 1D-relative-and-wait, follow-my-cursor, map-coordinates, and move-pieceto-show (Follow task). The only strategy seen solely in the radar condition was followrectangle (Follow task), which is understandable since the overview did not provide a view rectangle to follow7.
Direct
7
Radar condition relative-to-you describe-location left-right-top-bottom relative to previous
Follow
follow rectangle left-right-top-bottom relative to us relative to previous relative-to-you describe-location
Copy
show by drag show by move describe-piece
Overview condition left-right-top-bottom describe-location relative to previous relative-to-you pipe tracing left-right-top-bottom describe-location move piece to show relative to us relative to previous 1D and wait follow my cursor relative to you map coordinates (3x3) show by drop describe-piece show by placing
Since follow-rectangle does not usually involve detailed verbal exchanges, I had to look for indirect evidence that the strategy was used. I assumed that follow-rectangle was in use if any of the following occurred: • the participants give verbal indications of use, such as “I’ll just follow you;” • the mover gives no verbal indication of location at all, and the videotape shows that the welder moves to the right location without apparent difficulty • the mover gives verbal indications that are underspecified (e.g. “and now over here…”), and the videotape shows that the welder moves to the right location without apparent difficulty 198
Table 27. Strategy use in the three test tasks The amount that strategies were used also varied across the two conditions. In each task, I observed major differences. For the Direct task, radar groups used the relative-to-you strategy far more often than overview groups. One factor in this difference may be the difference in feedback provided by the two miniature views. The radar condition provided continuous feedback of the other person’s location, whereas the overview condition only showed location indirectly when the other person dropped an object. Therefore, relativeto-you directions could only be used in the overview condition when the other person indicated their location (here-I-am feedback) by explicitly dropping an object. In the Follow task, radar groups depended heavily on follow-rectangle, a strategy not possible in the overview condition. In the Copy task, the difference between radar and overview conditions was only in the variant of the “show” strategy used. Radar groups primarily used show-by-drag, whereas overview groups primarily used show-by-drop. This difference can be explained by the information differences in the two miniatures: the radar showed continuous movement, whereas the overview only showed position changes when an object was dropped. There were also differences in the way that the strategies were used. The most apparent of these occurred in the Follow task. For the radar condition, the follow-rectangle strategy was predominant, and yet other verbal strategies were used as well. For example, people would often verbally indicate the next location while they were moving there, even though their partner was already following their view rectangle. In many cases, these verbal indications were too underspecified to provide complete directions (e.g. “and now over to the left”). The use of multiple strategies, even though underspecified, may have provided people with redundant information that helped to confirm that they were following correctly.
199
9.2.7 Within-participants exploratory results Completion times and questionnaire results were also gathered for the second trio of tasks, those completed with the group’s alternate interface. These measures allowed me to consider the issue of what happens when a group moves from one view type to another. I assumed that all groups would perform better in the second set of tasks because of practice, but I wondered whether the improvement would be greater when going from the radar view to the overview, or when going from the overview to the radar view. I consider the differences between first and second trials for completion time and perceived effort. Since verbal records were not transcribed for the second set of tasks, within-participants differences in communication efficiency are not analyzed. These results are exploratory because of a potential confound of training effect. That is, within-participants differences cannot be adequately explained in terms of View, due to the confound of training effects from the first interface. Therefore, these results are used only as supplementary findings.
Completion time differential The time difference between a group’s first and second attempts at a particular task indicates their improvement, and I expected that groups would be faster on their second attempt. Table 28 summarizes the differences between a group’s first and second attempts at each task. Figure 84 illustrates these changes. Task
View order
N
max
min
Mean
sd
Follow
Radar then overview
10
4.48
-0.60
0.68
1.57
Overview then radar
9
0.17
-4.55
-1.44
1.42
Radar then overview
9
1.52
-1.37
-0.14
1.04
Overview then radar
9
-0.12
-1.17
-0.51
0.36
Radar then overview
9
1.53
-0.43
0.47
0.57
Overview then radar
9
-0.27
-1.98
-1.03
0.48
Copy Direct
Table 28. Summary of completion times differentials (in minutes) 200
Completion Time (min)
5 4
O
O
R
R
O
O R
O
3
R R
O
R
2
Overview - Radar Radar - Overview
1 0 View 1 View 2 Follow
View 1 View 2 Copy
View 1 Direct
View 2
Task and View
Figure 84. Mean changes in completion time from first to second attempts at a task. For groups that started with the overview and then moved to the radar view, the results were as I expected: for each task type, groups were faster in the second attempt (using the radar view). However, when groups started in the radar condition and then used the overview, only the Copy task was faster in the second attempt. The Follow and Direct tasks were both slower with the overview: Follow by about a minute, and Direct by about half a minute.
Perceived effort differential A similar analysis was done with questionnaire responses. The difference between a participant’s first and second responses to the questionnaire indicated whether they thought the second task was easier or harder than the first. Differentials were calculated by subtracting the first response from the second. Table 29 summarizes the mean differentials for each questionnaire question. Task Question
Follow 1
2
3
Copy 4
1
2
3
Direct 4
1
2
3
4
Mean Radar then 1.13 0.95 0.65 0.80 0.33 0.22 0.06 -0.11 1.44 1.06 1.17 0.89 overview Overview -0.83 -1.22 -0.94 -1.06 -0.06 -0.11 -0.56 -0.28 -0.06 -0.11 -0.50 -0.22 then radar SD
Radar then 1.28 1.36 1.31 1.54 0.84 1.06 1.00 1.13 1.04 1.11 0.71 1.08 overview 201
Harder
1
0
Easier
Differential in Perceived Effort
2
-1
Overview - Radar Radar - Overview
-2 1
2
3 Follow
4
1
2
3 4 Copy Task and Question
1
2
3
4
Direct
Figure 85. Perceived effort differentials between first and second attempts at a task. overview Overview 0.99 1.06 0.73 1.11 0.73 0.90 0.78 0.75 1.30 1.23 1.42 1.40 then radar Table 29. Mean questionnaire differentials Figure 85 illustrates these differentials in perceived effort. In the figure, points below the zero line indicate that the second task was perceived to be easier than the first, and points above the line that the second task was perceived to be harder. Again, the lines in the figure are intended only to visually separate the two data sets. I assumed that as groups became more experienced at each task, they would consider it to require less effort. This was the case when groups used the overview first and the radar second: they felt that the second task was easier. However, when groups used the radar and then the overview, they felt that the second task was more difficult than the first.
9.2.8 Summary of results A variety of results were obtained, some showing improvement when there was additional awareness information, and some showing no difference between the two displays. When using the radar view, groups finished the Follow and Direct tasks significantly faster, and used significantly fewer words in the Follow task. The within202
participants measures appear to reinforce these findings, and participants overwhelmingly preferred the radar view when they had seen both interfaces. However, no differences were found in perceived effort for any of the tasks, and no differences were found on any measure for the Copy task. In addition, strategy use differed in several ways between the conditions.
9.3 Discussion The two versions of the interface differed only in that the radar view provided visual indications of the other person’s location, the location of their cursor, and the motion of objects that they moved. The significant differences between these two very similar interfaces clearly suggests that the additional awareness information helped people complete some tasks more quickly and more efficiently. I interpret and explain these findings below. First, I consider two reasons why the additions to the radar view were successful: that they allow visual communication, and that they provide continuous feedback and feedthrough. Second, I examine the measures of perceived effort, and consider why the Copy task was not affected by the view type.
9.3.1 Visual vs. verbal communication The radar condition provided visual indication of the other person’s location and activity by showing view rectangles and telepointers. This information helped people complete the Follow and Direct tasks more quickly. One way that visual information aided the task was by allowing people to use strategies that were better suited to the task and therefore more effective.
Visual information and strategy in the Follow task In the Follow task, the joiner (the person with the map) had the job of communicating ten successive workspace locations to the welder (who had no map). When groups used the overview system, the joiner had to convey this information verbally. Joiners used a wide 203
variety of techniques for indicating locations, and were generally adept at choosing a technique that would best describe where the welder should go next. They often began with general directions (e.g. left-right-top-bottom or relative-to-previous strategies), and then gave more specific indication using the describe strategy. In many cases, however, the locations were not easy to indicate using any of the strategies. For example, when the next location was not obviously in a corner of the workspace, and not in an obvious direct line from the current position, then neither of left-right-top-bottom or relative-to-here were appropriate. In these situations, the joiner had to rely more heavily on describing the location, and had to be more careful in planning and delivering her utterances. Often, their descriptions became fairly complicated: J: The second weld is near the bottom in the middle section, there’s two pieces of pipe, ok, there’s two longer pieces of pipe, ok, there’s, umm, right in the middle, right on top of the lowermost piece of pipe, in the middle there, there’s two welds that need to be done. W: Uh, ok… The joiner’s verbal instructions had to be interpreted by the welder, and this process took time. In addition, the joiner would sometimes have to provide more than one round of description before the welder found the correct location. In other cases, the problem was not incorrect interpretation, but incorrect direction: J: Six is uh, down, to the right… W: J: Um, the very edge, there’s one sticking down which is not welded W: J: Uh, at the bottom? J: See that? W: No J: Uh, oh- I mean, sorry, to the left, sorry W: Oh, ok The radar view, in contrast, allowed people to use a much more effective strategy. The follow-rectangle strategy meant that the welder could find the right location simply by following the joiner’s view rectangle. The visual indication of the joiner’s location transformed the task from a series of complicated verbal exchanges to a relatively simple perceptual task of aligning rectangles on the screen. The follow-rectangle strategy 204
provides specific and accurate information about where to go, regardless of where the next location is in the workspace. In addition, it allows the joiner to communicate simply by going about their job: they need not spend extra time thinking about how to best indicate the location. The overview condition did in fact allow a limited kind of visual communication, but it was not as obvious as the follow-rectangle strategy, and it was not used very often. In the show-by-move strategy, the joiner would navigate to the next location, and then move a pipe section back and forth, knowing that each move would show up on the welder’s overview. Although this strategy could provide a good indication of location, it could not be used consistently because there was not always a convenient section of pipe to move back and forth. In particular, where all the pipe sections in the area were connected into large structures, moving a structure would not provide an accurate indication of the joiner’s location. The transformation of the task from a verbal to a visual activity also explains why groups used significantly fewer words in the Follow task when they used the radar view. Groups using the follow-rectangle strategy had the necessary location information available in the radar, and so they did not need to communicate locations verbally. In the audio record, the follow-rectangle strategy is characterized by few words, and almost none of the complicated and lengthy descriptions seen in the overview condition. However, the radar condition was never completely silent. In particular, joiners would often make general statements about the location of the next weld: J: ok, we’re going over to the left…that’s getting welded J: OK, now, way over here…ok, that needs to be welded J: OK, and just over left, same height, weld this together… Since these directions are too unspecific to fully indicate a location, the joiners must have been providing general directions but leaving the specifics up to the radar. In a few cases, when the joiner’s directions became more specific, welders would remind them that specific directions were unnecessary since the radar view provided the required information. 205
Visual information and strategy in the Direct task The Direct task also asked one person (the director) to communicate a series of successive workspace locations to the other person (the actor). Again, the director had a workspace map, and the actor had no map. In this task, the director was not allowed to move around in the workspace, so radar users could not employ the follow-rectangle strategy. However, even though the director in both conditions had to indicate locations verbally, the information in the radar view allowed them to use more effective strategies. As in the Follow task, workspace locations were not particularly easy to describe. Directors in the overview condition used several techniques to indicate locations, but still had some difficulty in indicating the right place to the actor, even though the actor could drop a piece to show their location: D: Next, I need a small piece, from the bottom left A: ok D: and you want it right in the centre, in that open space, there’s a little pipe that sticks out A: centre in the open space… D: in the top…you see one little pipe that sticks out, on the left? A: ok, I’m here. Where do you want me to go? D: ok, uh, up, to go to the top A: the top right corner or the top left corner? D: top left. A: here? D: yeah. Now go exactly right, from there. And you see, there’s a T, with a pipe, straight? A: There? D: I can’t see where you are. Directors in the radar condition used many of the same strategies for indicating the next location (e.g. describe-location, left-right-top-bottom, relative-to-previous) as seen in the overview condition. However, when these strategies failed, location information in the radar view gave directors a fallback strategy that worked well even when locations were difficult to describe. Since directors could see exactly where the actor’s view rectangle and telepointer were, they could provide relative directions (go up, go down, go left, go
206
right) based on the actor’s current location. Relative directions are simple to construct, and are much less prone to misinterpretation. For example: D: ok, move to the left, stop, stop. Move up, move straight up, move straight up, stop. Go a little bit to the left, stop, stop. Ok, now you see there are two T sections… The relative-to-you strategy was not generally the first strategy chosen by a director, but it was often the one that they used when they ran into difficulty. In one session, the director started to describe the location, but after making a few attempts, resorted to relative directions: D: Okay, number five. If you look at…there’s some pipes to the…where, they’re kind of…um… D: Go down. The difference between descriptive or relative directions can also partly explain why the radar did not lead to fewer words spoken in the Direct task. Even though these two methods of giving directions differ greatly, nothing about giving relative directions implies that fewer words will be needed. For example, the first of the two utterances (D1) below might be harder to plan and to understand, but both utterances contain the same number of words. It may be that word counts are an insufficient measure of verbal efficiency, and that other metrics like utterance length or vocabulary size may have been more appropriate. D1: ok, near the very bottom you’ll notice that there’s a vertical line right in the middle in the bottom of the pipeline, ok there is a T, a T, under that corner piece… D2: ok, move to the left, stop, stop. Move up, move straight up, move straight up, stop. Go a little bit to the left, stop, stop. Ok, now you see there are two T sections… In summary, the location information presented in the radar view allowed people to communicate required information visually in the Follow and Direct tasks. The visual information allowed different strategies for carrying out the tasks, and allowed simplification of verbal utterances. In the Follow task, the view rectangle was of primary importance in helping people complete the task more quickly; in the Direct task, both the view rectangle and the telepointer were important. This difference can be ascribed to the fact that pairs in the Follow task could use their main view to negotiate local directions, 207
and so the radar view was most useful in aligning views. In contrast, directors in the Direct task could only gather information about their partner through the miniature, and so had to provide both large-scale and small-scale directions using the miniature.
9.3.2 Continuous feedback and feedthrough The radar view provided continuous feedback about location and piece position, feedback that allowed groups to complete the Follow and Direct tasks more quickly. In particular, this feedback gave people visual evidence of understanding (Brennan 1990), which was more effective and less error-prone than verbal evidence. Visual evidence was introduced in Section 3.5.1. In the Direct task, the director guides the actor’s movement by giving her an instruction. With each instruction, the director requires evidence that he has succeeded in conveying the correct meaning to the actor, and that the actor has successfully moved where she is supposed to go. In addition, the director often cannot give the next instruction until he knows that the actor has successfully completed the current one. The information differences between the radar view and the overview provided directors with different kinds of evidence, and afforded different means for establishing that instructions have been understood and carried out. The overview lets the actor give evidence in two ways: verbal acknowledgment (e.g. “ok, I’m there”) or the “here-I-am” strategy of dropping an object to indicate their location (e.g. “ok, can you see my piece?”). In both of these methods, the evidence is given at the end of an action: that is, the director gives the instruction, and the actor carries it out to the best of their ability before acknowledging. The problem with this form of interaction is that the director may give poor descriptions and the actor may go the wrong way. Providing evidence only at the end of the action means that time is wasted when the actor makes a mistake: D: …go up to that part that’s jetting across the middle… A: A: this part right here? 208
D: Uh, on the left side actually, on the left side… In addition, both the verbal and the “here-I-am” methods of acknowledgment have other drawbacks. If the actor believes that they have followed the instruction correctly, but really haven’t, they will mislead the director with their acknowledgment. The director has little chance to detect the error, and so may continue, piling error upon error. The “here-Iam” strategy at least gives the director concrete information about the actor’s location, but this information can be out of date. Actors would often drop objects, then pick them up and keep moving. The director, however, saw only the out-of-date picture of the dropped piece. If they assumed that the location of the piece was also the location of the actor, errors could ensue. The awareness information in the radar provided different kinds of evidence. Verbal acknowledgment was still possible, but the radar also showed up-to-the-moment object movement and viewport location. In the Direct task, these representations could be used as immediate visual evidence of the actor’s understanding and intentions. If the actor started moving the wrong way, the director would see the misunderstanding immediately: D: ok, just above where you were working before… A: D: oh, not too far…yep, right…nope, up, up, up, higher, yeah, right there. The availability of continuous evidence also made it possible for people to give continuous instructions. This is a strategy with far fewer verbal turns, and where the actor acknowledges implicitly through their actions. Clark (1996) summarizes the difference between verbal and visual acknowledgment for on-going “installment” utterances like instructions: “in installment utterances, speakers seek acknowledgments of understanding (e.g. ‘yeah’) after each installment and formulate the next installment contingent on that acknowledgment.
With
visual
evidence,
[the
speaker]
gets
confirmation
or
disconfirmation while he is producing the current installment” (p. 326). In summary, evidence of understanding and action in the radar was accurate, easy to get, and timely. The director was able to determine more quickly whether the instruction was going to succeed, and could reduce the cost of errors. 209
9.3.3 Perceived effort Measures of perceived effort in the between-participants analysis showed no differences between the two conditions for any task. This runs contrary to both my expectations and my observations. I observed groups having more difficulty discussing the task, and making more errors, when they used the overview. It is possible that the questionnaire was a poor measure of effort. The main problem was that people had nothing to compare their experience to, and may have been unable to accurately indicate their effort on the scales given. This problem seems more likely considering that once participants had seen both interfaces, questionnaire responses showed greater differences (see Figure 8). In addition, the overwhelming preference for the interface with the added awareness information (see Table 2) also suggests that there were real differences in the experience of using the system, but that the effort measures were insensitive to these differences.
9.3.4 Explaining the copy task In the Copy task, the two participants build two identical structures from two stockpiles. The leader had a paper picture of what was to be built, and had to indicate each successive pipe section to the copier, who had no picture. The Copy task showed no effects of View on any measure. There are several reasons why the additional awareness information did not improve performance or efficiency, and the most important of these again concerns strategy. The strategy that a group chose for the Copy task had a large impact on their completion time and their verbal efficiency, regardless of which interface they used. Participants typically used one of two strategies to indicate the next piece to their partners: they could describe the piece verbally (describe-piece), or they could show it to them through the radar or overview (show-by-drag or show-by-drop). Describing pieces was certainly the wordier strategy and was also slower. One underlying reason for the lack of difference is that there were equivalent strategies in both the radar and overview conditions. The show-by-drag and show-by-drop strategies provide almost the same information to the person doing the copying. However, since 210
show-by-drop is a less obvious strategy than show-by-drag, I had expected describe strategies to be more prevalent in the overview condition. However, this was not the case. Even though the radar view allowed people to point out pieces quite easily, the video record suggests that more groups used the describe-piece strategy in the radar condition than in the overview condition. In a few cases, choosing to describe rather than show pieces seemed to be the result of inexperience: during one session, the leader said “oh right—I keep forgetting that we can both see the same radar view,” whereupon she switched from a describe to a show strategy. The combination of an equivalent strategy in the overview condition and a greater use of description in the radar condition account for the lack of speed or efficiency differences between the two conditions for the Copy task.
9.4 Validity and reliability issues There are a number of issues regarding measurement and inferences that must be considered for any study. In this section I will review threats to the reliability and validity of measurements taken in the experiment, and threats to the validity of the inferences drawn from the data. The definitions given below of reliability and validity are all taken from Heiman (1995).
9.4.1 Reliability and validity of measurements Reliability is the degree to which the measures are consistent from one session to the next. There are only minor concerns in this study. First, two experimenters ran pairs through the experiment, and may have emphasized different parts of the standard instructions or differed in minor points of the procedure. Second, the coding-andcounting measures used to assess communication efficiency must be implemented carefully to ensure inter-rater reliability. Although an acceptable degree of agreement was achieved, the accuracy of this measure is not perfect.
211
Validity of measurement is the extent to which a procedure measures what it is intended to measure (Heiman 1995, p. 43). I will consider two types: content validity, the extent to which procedures measure only what they are supposed to; and construct validity, the extent to which a measurement reflects the hypothetical construct under consideration (Heiman 1995, p. 44). Content validity. The three main measures (completion time, communication counts, and perceived effort) had only minor problems with content. First, raw completion times included time required for system failures and off-task time, as well as time required for the collaborative task. To reduce these problems, participants were instructed to concentrate on the task, and time taken by system problems was subtracted after the session. Second, word counts were intended to measure the number of words used for providing directions (Follow and Direct tasks) and for indicating (Copy task). However, it proved difficult to determine a set of rules that would unambiguously place utterances and words in these categories. As a result, the word counts may also measure other aspects of verbal behaviour. For example, when words like “um, uh, well” or “ok” appeared within a directing or indicating utterance, they were counted. Third, the questionnaire was intended to measure only people’s perception of their effort during the task. However, if people were unsure about the categories, or if they felt that they had nothing to compare their experience to (see Section 9.3.3), then their responses may reflect something other than what was intended. Construct validity. The problem here is whether the measures actually assess groupware usability. The connections between the measures and usability were laid out in Section 9.1.4; for this experiment, I believe that they are reasonable indicators of the construct. Since groupware usability is not directly observable, however, there is no guarantee that the measures I used are the best choices. I review the measures used for this study in Section 9.5.
212
9.4.2 Validity of inferences I am also interested in the validity of the inferences that I have drawn from the data. I consider two kinds of validity: internal validity is the degree to which relationships in the data actually reflect relationships in the variables under examination, and external validity is the degree to which the results can be found with other participants and other settings (Heiman 1995, p. 45).
Internal validity Internal validity concerns confounding variables and rival hypotheses. Three types of threats to internal validity seen in this experiment are due to design and procedure, demographic variables, and strategy choice. Design and procedure. The study took certain precautions such as only comparing data from the first interface seen, but there are additional minor concerns regarding task order and the number of tests. First, since there were only 20 pairs in the study and 6 possible orders, two orders were used four times instead of three times. I believe that the effects of this incomplete counterbalancing will be extremely small. Second, I ran several statistical tests on the data. Although alpha levels were maintained at 0.05 within each family of tests (i.e. within each measure), I did not maintain a single cumulative alpha value across all tests. This would not be a problem if the measures were completely independent, but there are likely to be some dependencies between time, effort, efficiency, and preference. However, this problem only slightly reduces confidence in the inferences, since the possibility of one false positive among the 21 tests is 20%. Significant differences were found on six tests, and so even if one of these is due to chance, there is still considerable evidence for the conclusions. Demographic variables. Although sex pairings were balanced across the two conditions, there were other demographic variables that I did not control. In particular, familiarity with partner and familiarity with drawing programs (recorded on the initial questionnaire) suggest rival hypotheses, where greater familiarity may lead to better results. However, 213
since both of these demographic variables ended up roughly equal across conditions, I assume that their effect was equalized. In addition, there was one factor which I did not record: language ability. I asked that people be fluent in spoken English, but the tasks may have also tested abilities in description. Strategy choice. Since pairs were allowed to complete the tasks using whatever strategy they wished, different strategies may have led to differences in completion time, amount of talk, and amount of effort. Although strategy choice was constrained by the information available in the system, it was not completely controlled. Lack of experience with the system and the task is a likely reason for groups choosing sub-optimal strategies. In the Copy task, strategy had substantial effects: choosing a “show” strategy almost always led to better results than a “describe” strategy. In other tasks, however, groups tended to choose similar strategies within each condition, and so the variable had less influence.
External validity External validity is the degree to which the results can be found with other participants and other settings, and plays a major role in determining how the results generalize (Heiman 1995, p. 45). The experimental approach sacrifices realism for precision, as discussed in Chapter 6, and this lack of realism limits the generality of my interpretations in certain ways. I consider the similarity of the participants and the tasks to the real-world users and tasks where awareness techniques may be used. Participants. The participants in the study were university students. The target population is a fairly broad group—anyone who will use shared-workspace groupware in a work situation—and so it is difficult to say how similar the participants are to the target. Realworld users will have the opportunity to gain more experience with the system, and will likely be experts in the domain. However, these people will share certain basic characteristics with the participants, including experience with mouse-and-windows
214
software, a range of experience with partners, and a range of experience with similar systems. I can therefore say only that the two populations are generally similar. Tasks. How similar are the experimental tasks to those that will be done in the real world? To begin with, the scenario and setting in the experiment were contrived, and so will not be exactly the same as any in the real world. Therefore, I must look at the particular elements of the test tasks that may be found more generally. As discussed in Section 9.1.2, the tasks were chosen to involve basic kinds of joint activities that can be seen in a variety of shared-workspace tasks. In particular, following, directing, and copying are activities that will appear in many collaborative tasks. In addition, the activities of collaboration will be common across many kinds of tasks, a factor that increases the realism of the situation (McGrath 1984). Assuming that these activities do transfer to other tasks, the next issue is how often they will appear. This issue considers the size of the effect on real-life work. The effect on real-world tasks depends upon what portion of the task can benefit from visual information and continuous feedback. In Follow and Direct, the radar condition was faster by about 25%, a substantial margin. However, these controlled tasks constrained the activity. More realistic tasks will likely include a mix of different activities, some that will benefit from awareness information, and some that will not. Therefore, some realistic tasks may not see a measurable increase in speed. Speed, however, is not the whole story: communication efficiency and preference may also be improved by the presence of awareness information. Even if the individual effects are small in a real-world task, it is reasonable to expect the cumulative benefits of awareness information to be non-trivial. An additional issue that involves both the participants and the task is expertise. If tasks stay consistent, then people will learn better strategies over time. For example, if the Follow task was always carried out in the same workspace, people would find names for locations that were difficult to describe at first (e.g. Krauss and Fussel 1990). Therefore, the degree to which awareness support will be valuable over the long term is related to how often the task’s artifacts and activities change. 215
9.5 Assessment of methods 9.5.1 Performance measures Performance measures consider one of the critical questions of groupware design. A groupware system exists for the completion of some task, and performance measures look at how quickly or how well people can execute that task. However, as discussed earlier, groups can change their behaviour to satisfy a performance goal, even with an inferior system. During preparation for the experiment of Chapter 9, I encountered exactly this phenomenon. In pilot studies with unconstrained tasks, there were no substantial time differences between systems with a radar view, systems with an overview, and systems with no miniature at all. Therefore, for the experiment, I constrained the tasks to require certain types of awareness information, reducing the realism of the setting. What then is the role of performance measures in evaluations of groupware usability? They can still be valuable, but their value is directly related to the external validity of the task situations. Tasks must be chosen carefully to ensure that there is a connection between what people do in the study and what they will do in the real world. Since the use of performance measures is likely to strain the ecological validity of a usability study, additional thought must be given to the connections between aspects of the test situation and the real world.
9.5.2 Process measures Measures of process are less susceptible to group adaptability, since the activities of collaboration are generally not the group’s primary goal. Process measures should therefore be more sensitive in realistic task situations than are performance measures. However, measures of process present other difficulties. Below, I discuss measures of communicative efficiency and perception of effort. The counts of verbal efficiency were useful in showing some of the subtleties of interaction, and provided a way to look more directly at one of the activities of 216
collaboration. However, they required a great deal of time and effort to organize and carry out. Transcribing and coding is tedious and time-consuming, but the larger problem is in determining rules to include or exclude utterances and words in the categories of interest. The primary difficulty lies in exactly the richness and flexibility of communication in shared workspaces that workspace awareness supports. Verbal dialogue in a shared workspace is often fragmentary and highly dependent on the context of location or activity. Thus, an utterance on the transcript may be difficult to categorize properly. Doing the coding while watching the video records helps, but even the videotape does not record the entire context that people use to construct and interpret utterances. A second problem with this measure, as discussed in Section 9.3.1, was that simple word counts may have been too broad a metric to detect some of the process differences between the two experimental conditions. Word counts measure efficiency, but effort may be the more important criteria for judging communication. Number of words only partially reflects the amount of effort needed to communicate, and in some cases, greater effort in planning the utterance may even result in fewer words. Therefore, additional or different measures of the verbal transcripts might have better reflected the system’s usability: for example, measures of information content, vocabulary size, or sentence length. The second process measure I used was perception of effort. Since responses were subjective, this measure is also partly an indication of satisfaction. As mentioned in Section 9.3.3, my experiences suggest that perception of effort should be used only for relative rather than absolute judgments. This follows conventional usability-testing wisdom: users in general are good at comparing, but less skilled at absolute judgment (e.g. Nielsen 1993). Relative judgment questions would ask “in which system was the task easier,” rather than “how hard was the task with this system.” Although the perception-of-effort measures I used did not show differences, I still believe that measures of effort are crucial to evaluation of groupware usability, especially when a performance measure is also used. 217
In contrast to the perception of effort questions, the overall preference questions posed at the end of each session showed substantial differences between the two experimental conditions. The preference measure was based on a comparison, and this likely contributed to the unequivocality of the result. The overwhelming preference for the radar condition suggests, in addition, that there are process and effort differences that I did not look for, differences that are waiting for a more sensitive measure.
9.6 Lessons for groupware designers There are several lessons that groupware designers can take from this study. First, the findings reiterate the value of workspace miniatures, as suggested by the study in Chapter 8. In the present experiment, I regularly observed people using both the radar and the overview to orient themselves in the workspace, to navigate, to keep track of the current global state of the activity, and to carry out individual work that did not fit inside the main view. All shared-workspace groupware systems will benefit from a workspace miniature. Second, the main finding of the study is that adding workspace awareness information to the miniature—visual indications of viewport location, cursor movement, and object movement—can significantly improve speed, efficiency, and satisfaction. These awareness components should be included in shared-workspace applications. As described above, these results do generalize to more realistic tasks, although the size of the effect will depend upon what portion of the task can benefit from visual information and continuous feedback. If a major part of the real-world task involves one person following or directing another, if it is difficult or expensive to construct or communicate the required information verbally, and if artifacts and tasks change over time, then provision of visual location and activity information will have an a substantial effect on the usability of the system. Third, the experience of the Copy task provides a cautionary note, and suggests that the benefits of the radar view do not automatically improve performance. Potential 218
improvements are dependent upon the information requirements of the activity and on the ways that groups choose to carry out the task. Designers should carefully consider what information is available and consider the strategies that will be used to carry out the task.
9.7 Summary The hypothesis tested in this chapter is that interface support for workspace awareness can improve usability. I carried out an experiment to look at the effects of showing viewports, cursors, and object motion in a workspace miniature. I took four measures that look at different aspects of groupware usability: completion time, verbal efficiency, perceived effort, and overall preference. For some tasks, the additional awareness information allowed groups to finish the task significantly faster, and allowed them to use significantly fewer words. In addition, when participants had seen both interfaces, they overwhelmingly preferred the system with extra awareness information. The improvements in speed and verbal efficiency can be explained in terms of visual communication and continuous feedback. Visual information about location allows groups to use more effective and more robust strategies for carrying out the Follow and Direct tasks. Continuous feedback on people’s movement through the workspace allows people to recognize and correct navigational errors quickly. The study shows that support for workspace awareness can improve the usability of groupware systems. It adds quantitative evidence to the qualitative findings of the investigation in Chapter 8, and begins to put intuitions about awareness onto an empirical footing. This chapter also closes the evaluation phase of the research process. In the next chapter, I step back from the process and review the research from a higher level. I take the results of this and other chapters and look for underlying principles and connections between the findings and larger issues in the design of highly usable groupware.
219
Chapter 10
Connections
In this chapter, I step back from the specific results discussed in the past few chapters, and look for higher-level conclusions that can be drawn. I am interested in how my findings are connected to larger issues in the design of highly usable groupware systems and the design of shared workspaces that support rich interaction between group members. I look at four connections in particular: the role that workspace awareness plays in groupware usability, the value of redundancy in the information landscape, the way that workspace awareness assists rich interaction, and the tradeoff between design for individuals and design for groups. These discussions also contribute to understanding of when and where support for workspace awareness is needed in groupware.
10.1 The role of workspace awareness in groupware usability Workspace awareness information does affect the usability of real-time distributed groupware systems. Provision of awareness information can lower completion times and allow verbal communication to be more efficient (Chapter 9); in addition, systems with awareness information are greatly preferred by participants (Chapters 8 and 9). What then is the relationship between awareness support and groupware usability? I defined WA as up-to-the-moment understanding of another person’s interaction with the shared workspace, and I defined groupware usability as the extent to which a system supports the activities of collaboration. Therefore, if workspace awareness support is to improve usability, then it must improve one or more of the activities of collaboration. I described some of these connections in Chapter 3 and Chapter 9: increased efficiency of communication, reduced error rate in monitoring, increased sensitivity in coordination. If workspace awareness provides some of the information that people need to collaborate, then we must consider the question of when awareness support will be valuable. I propose that the need for any mechanism that maintains workspace awareness is influenced by 220
two factors: interaction and information content. First, need increases as the amount of expected interaction between group members increases. If the group never interacts, there is little need to stay aware. Second, need increases as the information content of another person’s interaction with the workspace increases. That is, the degree to which their behaviour is unpredictable determines the need for a means of staying up-to-date with that behaviour. Consider the Follow task of Chapter 9. If the participants had been welding the same ten locations every day for years, then there would be no need to present any kind of awareness information. The information content of each person’s interaction with the workspace would decrease over time, and the information necessary for coordinating the task would have been embedded into the task itself. It is still true that the welder needs to know where to go next, but if that information never changes, then there is no need for visual (or verbal) means of communicating locations. In Figure 86, need for a means of maintaining WA increases along both axes.
high interaction
high interaction
low information content
high information content
low interaction
low interaction
low information content
high information content
Interaction
Information Content
Figure 86. Need for a means of maintaining WA Once the need for any mechanisms has been determined, the question of which mechanism must be addressed. This research has also shown that there are many potential ways to supply awareness information, and that some are better than others. For example, Chapter 9 compared verbal and visual mechanisms of gathering information about location, and found that visual presentation is better for some kinds of tasks. Four criteria on which different mechanisms can be compared are the cost of acquiring the information, the cost of interpreting it, the quality of the resulting knowledge, and the 221
redundancy value that the knowledge provides. Each of these could be seen in the experiment of Chapter 9: •
the cost of acquiring location information was lower with the radar view than with verbal communication, because locations were often difficult to describe (note that acquisition costs should be considered as the cost to the group, rather than to the individual);
•
acquisition costs, however, were not lower with the radar view in the Copy task, since the overview provided the necessary information just as easily;
•
the cost of interpreting the radar’s view rectangle was lower than that of interpreting a verbal utterance, again since descriptions were sometimes unclear;
•
the quality of the information provided by the radar view was higher in some cases, as it did not lead to misunderstandings or errors;
•
the presence of the visual indicators in the radar view sometimes provided a redundant source of information that alerted a participant to incorrect verbal instructions (discussed in more detail below).
These factors must be compared with others that detract from the value of a display: the amount of screen space it requires, its potential for distracting people from individual work, and the additional demands it places on computational resources. In sum, support for workspace awareness affects groupware usability by providing some of the information that people need to carry out the activities of collaboration. The degree to which WA support will affect usability can be (roughly) determined by considering the need for any mechanism, and then considering the value of a particular support technique in relation to existing mechanisms such as verbal communication.
10.2 Redundancy and robustness Redundancy plays an important part in the value of workspace awareness. There are two ways that the idea underlies awareness support in groupware systems: first, multiplicity of information sources, and second, pattern-matching in information streams. 222
Redundant information sources. People in face-to-face collaboration settings use multiple sources of information to keep track of any particular element of workspace awareness. Movement, sound, and verbal communication can all indicate and reinforce perception of an action. As Segal (1995) says, “perception and redundancy are intimately linked; perceptual systems—that is, living organisms—learn to capitalize on the redundancy of information available in their environment” (p. 396). Providing awareness information in a groupware interface provides similar redundancy, in that it makes possible multiple mechanisms for obtaining the information needed for collaboration. For example, visual presentation of awareness information provided an additional way for people to coordinate the Follow task of Chapter 9, and emphasized different aspects of the information than would a verbal exchange. The presence of multiple mechanisms allows collaborators to capitalize on the format that best suits their capabilities and the demands of the task. Although verbal communication can provide all the awareness necessary to complete a task (as it must when we collaborate over the telephone), multiple redundant sources for the same information can help to make a group more robust. When a situation arises that does not fit well with the current means of gathering information, a group that has multiple mechanisms available to them can switch to a more appropriate mechanism. The more mechanisms they have, the more flexible they can be. Redundancy in pattern-matching. When information is presented over time, people can learn to recognize and exploit patterns in the stream of events: “organisms learn to capitalize on redundancy itself as a source of higher level information, on the patterning or predictability of particular events within a larger aggregate of events” (Segal 1995, p. 396). This is redundancy in the information-theoretic sense—regularity in the temporal dimension of an information stream. This kind of redundancy is also applicable to the actions and behaviour of other people in a workspace. For example, recognition of patterns was the basis for one kind of anticipation introduced in Section 3.5.3. That humans exploit redundancy in event streams is nothing new: the important point for the 223
design of groupware is that identification and exploitation of patterns can only happen when there are information channels to perceive. This helps to explain why the principle of continuous presentation (Chapter 4) is useful. In addition, this kind of redundancy is an argument for providing WA information even when there is no specific requirement in the task for it. Designers have often falsely assumed that when the usefulness of a particular information stream is not immediately apparent, it is useless and should be removed (e.g. Norman 1993). In reality, people use a wide variety of information in subtle and non-obvious ways: for example, “listening to the chatter of air traffic controllers turns out to keep pilots informed about all the other airplanes along the route” (p. 145). The information-landscape approach recognizes this. It attempts instead to provide an environment that has some of the richness of face-to-face settings, where people can use the available information in ways that are apparent to them and suitable for the task. As Norman says: Natural, smooth, efficient interaction should be the goal of all work situations. Alas, natural interaction is often invisible, unnoticed interaction: we don’t know it is there until we remove it, and then it may be too late… New technologies can clearly provide improvements over old methods…The problem is, it isn’t always obvious just which parts are critical to the social, distributed nature of the task, which are irrelevant or detrimental. Until we understand these aspects better, it is best to be cautious.” (p. 145)
10.3 Workspace awareness and rich interaction This research suggests that workspace awareness is one of the factors that allow the rich interaction observed in physical shared workspaces (e.g. Clark 1996; Tatar et al 1991; Tang 1991), and has explicated some of the mechanisms through which that interaction is possible. This connection revolves around the primary role of communication in collaboration, and around people’s communicative resourcefulness in an information-rich environment. People use a whole range of mechanisms for communicating in an environment like a shared workspace—and are experts at choosing mechanisms that 224
minimize effort but still allow subtle, nuanced communication. I look at two aspects of the relationship: first, the connection between workspace awareness and conversational awareness, and second, the connection between workspace awareness and conversational common ground. Workspace and conversational awareness. My introduction of conversational awareness in Chapter 2 tacitly assumes that conversation is a verbal phenomenon, with non-verbal information used primarily to manage the organization of the joint verbal behaviour. However, this research has shown that conversation is not just verbal. When a task takes place in a shared workspace, almost every interaction with the environment can be considered an explicit or implicit act of communication. This is strongly supported by other work (e.g. Clark 1996, Segal 1995). The rich variety of communication modes leads to non-standard organizations for conversations. For example, the visual evidence given in the Direct task allowed people to use a highly flexible turn-taking structure, one person using verbal turns, and the other using visual (implicit) turns. This means that conversation can be more variable than a standard verbal exchange, and that workspace awareness is needed to organize workspace conversations. Therefore, when conversation (either verbal or nonverbal) takes place in a shared workspace (and is about the shared workspace), the distinction between conversational awareness and workspace awareness is blurred. Workspace awareness and common ground. Workspace awareness is needed to interpret certain kinds of communication like deictic reference or demonstration. However, workspace awareness also contributes to a phenomena that allows communication to be both rich and efficient. This phenomena is common ground: when both parties realize what the other person is aware of, workspace awareness knowledge becomes conversational common ground (Clark and Brennan 1991). The idea of common ground was introduced in Chapter 3; in essence, common ground entails that people recognize what information is available to their audience, and take advantage of it when communicating. When communication involves the activities going on in a shared 225
workspace, knowledge about other people’s interactions with that space can be used as common ground. Furthermore, it is not just existing WA knowledge that becomes part of common ground, but knowledge about what other people will track and how they will do it. As discussed in Section 3.5.1, people use common ground to make their communication more efficient, following the principle of least collaborative effort. In Chapter 9, workspace awareness as common ground was obvious in the Follow task: once both participants realized that the other person’s location was available in the radar view, the amount and specificity of verbal communication decreased substantially. However, people can use workspace awareness to make their communication even more subtle. People can also hold common knowledge about the mechanisms that people are likely to use to gather workspace awareness. Once these mechanisms are part of common ground, people can begin to use ‘unintentional’ communication channels for intentional messages. For example, once I recognize that another person is using consequential communication as a mechanism to maintain awareness, I can begin to construct intentional messages that are transmitted through the consequential channel. These “indirect productions” (Heath and Luff 1992) can occur through verbal utterances, consequential communication, or feedthrough. Verbal shadowing (Section 3.4.1) is one form of indirect production through the verbal channel. Verbal shadowing can be thought of as bending the (unintentional) vehicle of overhearing for indirect intentional communication. Consequential communication and feedthrough can also be used to send intentional messages. For example, controllers in the London Underground control room have been observed “successively glancing at the hard line display and the station monitor, attempting to delicately have his colleague notice, independently, that a problem may be emerging" (Heath and Luff 1992, p. 75). This example uses consequential communication for an intentional message. To use feedthrough as communication, a person might perform some operation on an object,
226
intending that the feedthrough produced will attract the attention of another group member. Both the use of visual information to organize conversation and the use of the workspace in common ground depend on workspace awareness. These are just two of the ways that providing people with information about their environment can enrich interaction; there are undoubtedly many others.
10.4 Design for individuals, design for groups One of the key factors affecting workspace awareness support is the tension between designing for the benefit of a single user and designing for the benefit of a group. Two issues in the design of groupware systems confront this tension. First, when there are limited display resources available, whom should they serve—the individual or the group? Second, should interaction techniques be designed to enhance the activities and capabilities of the individual or to enhance teamwork? The classic example of the resource tradeoff involves the evolution of WYSIWIS and relaxed-WYSIWIS view sharing. Researchers noticed that the control given to individuals in a multi-user system has consequences for the way the group works together. Early groupware systems provided only serial access to systems (that is, floor control), and it was soon recognized that “serial access to problem-solving technology obstructs the kind of equal participation that ideally characterizes collaboration” (Stefik et al 1987a, p. 44). However, it was also noted that this constraint also had benefits for group work: “the fact that a [system] allows only one person to enter text at a time enforces a kind of shared focus that maintains a common context for the group…What is being done to the text is transparent in the actions of whomever controls the writing technology” (p. 44). In most cases, however, the group focus provided by turn-taking systems imposes too high a price on individual activity—few face-to-face activities in shared workspaces use serial control. WYSIWIS interfaces like Colab (Stefik 1987a) allowed simultaneous access, but immediately a tradeoff between individual control and awareness (in 227
particular) became apparent: “the possibility of simultaneous writing activity…brings new demands on participants to stay informed about what others are doing” (p. 44). WYSIWIS allows parallel action, but still enforces serial navigation, in that only one person at a time can choose the workspace location. This also presents problems for individual work: for example, the designers of Colab observed “scroll wars” when two people wanted to work on objects at opposite sides of the viewport. Moving finally to relaxed-WYSIWIS view sharing solves this problem, but creates an additional awareness burden, as discussed in Chapter 4. Less Turn-taking systems Greater
Degree of individual control in the system Strict WYSIWIS view sharing
Relaxed WYSIWIS (location)
More Relaxed WYSIWIS (location & representation)
Implied group focus
Lesser
Figure 87. More individual control implies less group focus The second problem involves interaction techniques, and was encountered in Section 5.1.2 as the invisibility of actions. Symbolic command and indirect manipulation benefit individual users, and are often a good idea in single user systems (“shortcuts for experts!” say the usability gurus). However, these techniques can drastically reduce people’s ability to maintain awareness. In addition, it appears that there is no going back: designers can’t remove all symbolic actions and replace them with direct-manipulation equivalents. Sometimes there is no equivalent (what is the direct-manipulation equivalent of “convert colour map to greyscale”?), and sometimes the direct-manipulation equivalent is simply too time-consuming or difficult (especially for an expert). The tension between individuals and groups is real: problems in allocating resources or in designing interaction will not find a happy medium that supports both sides well. Although the tradeoffs must be faced, there are strategies that can help to minimize its negative effects. For example, Section 5.2 showed several techniques that allow individual control of navigation and still maintain visibility of others in the workspace. Section 5.1.2 discussed strategies for increasing the perceptibility of symbolic actions and indirect manipulation. These techniques and strategies accept that people will be 228
unwilling to give up individual control and capability just for the good of the group; much of the work in overcoming these tradeoffs will involve finding ways to improve teamwork aspects without detracting from usefulness to the individual. As Segal (1995) concludes, “designers may consider the need to compensate for consequential information that is lost through the convergence and flexibility of displays and controls, perhaps by providing enhanced feedback from the system indicating what specific actions each operator is performing” (p. 411).
10.5 Summary The connections raised above show some of the ways that workspace awareness benefits collaboration, and show some of the principles underlying successful awareness support in groupware. Based on these principles and on others discussed in previous chapters, I have summarized the major steps in planning and designing support for workspace awareness (see Figure 88). From the top of the diagram, designers must first consider the overall need for any means of maintaining workspace awareness. Next, they must look at what WA information is needed in the situation, and what mechanisms already exist (such as verbal communication) to convey that information. Third, they must consider the specific qualities of WA information that is to be supported, and look at the tradeoffs that the system will impose between individual and group capabilities. Finally, they can assess specific techniques for conveying awareness information by considering how they compare to existing mechanisms on a number of criteria such as acquisition cost, quality, and screen space. Of course, there are many factors driving the design of any system, but this process will help to organize the task of supporting workspace awareness in groupware, and will remove some of the surprises down the road.
229
Overall need for a WA mechanism • interaction between participants • information content of activities
Existing awareness mechanisms
What WA information to provide
• how difficult is verbal communication?
• WA information required by the task
• what characteristic actions are evident?
• usefulness of general WA information • constraints on activities of collaboration
Design for individuals vs. groups • how will actions be perceived by others?
Information qualities • granularity, latency, sampling demands
• where do individual capabilities hinder the gathering of information?
Assess the value of techniques acquisition cost interpretation cost
screen space
information quality
distraction
redundancy value
computational cost
Figure 88. Steps in designing awareness support This brings the three main parts of the research process to a close. The final chapter will summarize the work that I have done, and revisit the objectives set out in Chapter 1. Also, it will state the major and minor contributions of the research, and suggest new directions for research based on this work.
230
Chapter 11
Conclusion
This dissertation has explored the concept of workspace awareness as a design requirement for real-time distributed groupware. The research was motivated by the general problem that working together in a shared computational workspace is awkward and clumsy compared to collaboration in face-to-face settings. Furthermore, I observed that current groupware systems make it difficult for people to maintain awareness of others in a shared workspace. My perspective in the research has been that of the computer scientist and designer, and I have considered workspace awareness with the goal of improving groupware. This chapter concludes the dissertation, and has three parts. First, I revisit the research hypothesis and the three research objectives set out in Chapter 1, summarize how those objectives were met, and assess my progress on each objective. Second, I summarize the major and minor original contributions that this research has made to HCI and CSCW research. Third, I describe directions for future work based on the research done here.
11.1 Research objectives and summary My research hypothesis was that support for the maintenance of workspace awareness improves the usability of real-time distributed groupware systems. This hypothesis implied three objectives: Objective 1: to frame the concept of workspace awareness in operational terms that are useful in groupware design. Objective 2: to show that the concept of workspace awareness can be applied in the design of groupware interfaces. Objective 3: to show that adding awareness information to a groupware system can significantly improve aspects of groupware usability.
231
I met these objectives through a three-stage research process of operationalization, application, and evaluation. Before undertaking these steps, however, I defined workspace awareness as up-to-the-moment understanding of another person’s interaction with the shared workspace. The setting for workspace awareness is the shared workspace, a bounded setting for joint action that forms an external representation of the joint activity. I characterized workspace awareness as a subtype of situation awareness, and identified its unique characteristics. Operationalization. I translated the concept of workspace awareness into operational terms useful for groupware design. This process involved two steps. First, I constructed a conceptual framework that sets out what information needs to be part of the groupware interface, what mechanisms of maintenance should be supported, and what collaborative activities will use the awareness information. Groupware interfaces should supply information to answer who, where, what, when, and how questions. I refined these categories into a set of ten elements of knowledge that deal with the present (presence, identity, authorship, action, intention, artifact in use, location, gaze, view, and reach) and five elements that deal with the past (history of actions, artifacts, events, presence, and locations). A groupware interface must also support the maintenance of awareness through the perception-action cycle. In particular, three primary mechanisms should be supported: consequential communication, feedthrough, and intentional communication (both verbal and non-verbal). There are several types of activities where the benefits of awareness are evident: in reducing the effort needed for verbal communication, in simplifying coordination, in providing context for assistance and anticipation, and in helping people to recognize opportunities for closer coupling. The framework structures thinking about workspace awareness, provides a starting point for analysis of collaborative work situations, and allows the description and comparison of support techniques. The second step in operationalizing workspace awareness is in moving from the conceptual framework to design principles for groupware interfaces. Workspace 232
awareness is more difficult to maintain in groupware than in face-to-face settings because groupware systems reduce perception of the workspace and reduce the expressiveness of bodies and artifacts. To redress these problems, the groupware designer must step in and artificially collect, distribute, and display WA information. Each of these activities has a number of issues that must be addressed; in many cases, the designer must match collection or display techniques to qualities of the information (e.g. importance, latency requirements). I proposed a general approach to supporting WA that presents awareness information in a synthetic information landscape. The landscape approach attempts to mimic the qualities of physical workspaces, and allows people to maintain awareness in the same ways that they do in a face-to-face setting. Application. I constructed several displays and display techniques for presenting awareness information, and collected others from previous literature. The design space of awareness displays can be organized using the principles of placement and presentation: information placement can be either situated in the workspace or separate from it, and the presentation can either be literal or symbolic. The situated approach attempts to use workspace embodiment, representations of actions, and expressive artifacts to help people maintain awareness using mechanisms that they already know. Since the situated approach displays information where it happens, it depends on the visibility of the relevant part of the workspace. Separate and symbolic techniques, in contrast, display awareness information outside the workspace, and as an abstract rather than a literal process. Symbolic information requires less screen space and does not depend on workspace visibility, but provides much less detail about actions and artifacts, and does not present information within a spatial and temporal context. I also looked more closely at one display called the radar view, a display that presents workspace awareness information on a workspace miniature. It combines visibility of the entire workspace with information about identities, locations, and actions of participants in the groupware conference. Through three design iterations, the radar view evolved
233
from a basic overview to an interactive display that shows a wide variety of information about participants. Evaluation. I examined the research hypothesis in two studies: an exploratory usability study, and a laboratory experiment. The exploratory study looked at several awareness displays in a groupware page-layout system. I looked particularly at three aspects of the awareness displays: whether they provided appropriate information, whether they were valuable in completion of the task, and whether they distracted participants from their individual work. This study showed that overviews are useful both for individual activities and for helping people maintain workspace awareness. In addition, the results suggested that interpretation costs can be lowered if displays present awareness information in a familiar context, and that displays should allow people to act on the information provided. The laboratory experiment tested the research hypothesis more formally. I examined the effects of showing viewports, cursors, and object motion on four measures of groupware usability: completion time, verbal efficiency, perceived effort, and overall preference. For some tasks, the additional awareness information allowed groups to finish significantly faster, and allowed them to use significantly fewer words. In addition, when participants had seen both interfaces, they overwhelmingly preferred the system with extra awareness information. These improvements can be partially explained in terms of visual communication and continuous feedback.
11.2 Progress on objectives In Chapter 1, I gave criteria for judging each of the three objectives described above. First, I determined that the operationalization work would be successful if it could organize the design space of awareness support and could explain evaluation results in terms of workspace awareness. I have done both of these. The displays described in Chapter 5 are organized at a high level by principles identified as part of the support process of Chapter 4 (placement and presentation level), and at a lower level by the 234
mechanisms of maintenance identified in the conceptual framework. In addition, I was able to summarize several of the techniques in terms of the elements of workspace awareness that they present. The conceptual framework has also been valuable in explaining the results of the studies in Chapter 8 and 9. Many of the ideas raised in interpreting results, such as perception-action, workspace context, visual evidence of understanding, and visual communication are all part of the knowledge gathered in Chapter 3. Second, I determined that application work would be complete when I could demonstrate techniques in each area where groupware requires awareness support, and when I could organize the displays in terms of the conceptual framework. I consider nearly thirty techniques in Chapters 5 and 6, and these techniques do cover each of the areas in which groupware hinders maintenance of workspace awareness (see Chapter 4). Reduced perception of the workspace was explored through visibility techniques like the radar view. Limited expressiveness of bodies was explored through embodiment techniques and strategies for making actions more expressive. Limited expressiveness of artifacts was explored through techniques for providing more information through workspace artifacts. I was also able to organize the display techniques in terms of the conceptual framework, as described above. Third, I determined that the evaluation would be successful if the studies I carried out were reliable, valid, generalizable, and showed statistically significant results. Significant results were found in Chapter 9, and within the methodological boundaries discussed in Chapter 7, I consider both studies to be reliable and valid for the contexts in which they were carried out. I also discussed ways that both studies generalize, and I provide several guidelines in the research for when and where workspace awareness support is likely to be effective. Finally, I have made progress on the overall research hypothesis. Since it is an overall claim, it cannot be completely decided for all situations in this dissertation. However, I
235
provide evidence that begins to put workspace awareness on an empirical footing, and I have begun the process of determining how awareness works in groupware usability.
11.3 Main contributions There are three main original contributions to HCI and CSCW research, all of which have to do with the use of workspace awareness as a tool for improving real-time distributed groupware systems. First, I identified and defined workspace awareness as a design requirement for real-time distributed groupware. Workspace awareness is an integral part of shared-workspace collaboration in face-to-face settings, and although CSCW research has previously recognized that awareness is important, the nature and mechanics of workspace awareness have not been articulated before. Second, I constructed operational descriptions of workspace awareness that can be used in designing and building groupware systems. These descriptions bring together a wide variety of information from my own observational studies and from previous literature. Until now, designers have had few resources to help them organize the problem of awareness support, assess work situations, or compare design and interface techniques. The conceptual framework of Chapter 3 and the more specific principles of Chapter 4 provide some of these tools. Third, I showed that support for workspace awareness can significantly improve the usability of groupware systems. Despite known difficulties in finding differences between groupware systems, I showed in Chapter 9 that the addition of information about location and actions can have major effects on a group’s speed, efficiency, and satisfaction, and can also change the way that they carry out a task. I also identified reasons why awareness information improves usability, and identified general characteristics of situations where awareness support will be effective.
236
11.4 Minor contributions There are also several minor contributions made by this research; these contributions range over a wide variety of application areas. 1. I designed and built a set of novel techniques for presenting workspace awareness information. In particular, several of the workspace visibility techniques have not been seen before in groupware systems, including the over-the-shoulder view, the cursor’s-eye view, the structure radar, and later versions of the radar view. The prototypes and systems that demonstrate these techniques have been included in the standard GroupKit distribution, and are therefore available for others to use and adapt. 2. I have increased understanding of groupware usability. I defined groupware usability as the degree to which a groupware system supports collaborators in carrying out the activities of collaboration, and set out several of those activities and the criteria on which they can be judged. I also assessed the strengths and weaknesses of several measures for measuring groupware usability, assessments that can be used in planning further evaluations. 3. I gathered experimental evidence that replicates and reinforces earlier observations about the role of an information-rich workspace in affording interaction between collaborators (e.g. Tang 1991, Tatar et al 1991, Clark 1996, Brennan 1990). In particular, I showed how additional modes of information about location and activity change the way that groups can perform tasks. In addition, I articulated some of the principles underlying this role, such as information redundancy and workspace awareness as common ground. 4. I investigated the tradeoff between designing interfaces for individual flexibility and control, and for designing them to help groups maintain workspace awareness. I identified areas in groupware interfaces that must address this tradeoff, and suggested several techniques that can lessen its impact.
237
5. During exploration of techniques for providing workspace visibility, I used several existing visualization techniques as representations for groupware workspaces. These included fisheye views, DragMag views, and transparent overlays. My investigation is one of the first uses of these techniques either as interactive displays or as groupware workspaces.
11.5 Extending the findings Although the results presented in this dissertation were obtained by carefully constraining the situation under investigation, there are several ways in which the findings can be generalized and extended. Below, I collect and summarize ideas about three ways in particular that have been discussed in previous chapters. These three are: the extension of the experimental results to other tasks and other situations, the applicability of the research process to other HCI and CSCW research, and the distillation of general lessons for practitioners and designers of real-time distributed groupware.
11.5.1 The experimental results A key question in extending the experimental results of Chapter 9 is the degree to which support for workspace awareness will improve the usability of other groupware systems that involve other tasks and other work situations. There are two issues to consider: how well the experimental tasks transfer to other domains, and how useful workspace awareness support will be in more realistic tasks. First, I believe that the experimental results do extend to other domains, and my reasons revolve around the fact that the tasks used in the experiment are common to many kinds of collaboration. That is, the activities of following, copying, and directing are not tied to construction tasks, but are general to many kinds of shared-workspace activities. For example, the three tasks in the experiment could just as easily have taken place in a concept-mapping system as in a pipeline construction system. The underlying theme is that certain aspects of collaboration in shared workspaces are invariant regardless of the 238
task: in particular, the activities of collaboration (such as communication, coordination, coupling) that I discussed in Chapter 7. This claim remains to be tested by replicating the experimental tasks in other domains. If certain collaborative activities such as following, copying, and directing are in fact general to many shared-workspace tasks, the second issue concerns whether awareness support will be as successful in other domains as it was in the experiment. This issue cannot be decided without knowledge of the work situation and the users of the groupware system. As I discuss in Section 10.1, the value of having workspace awareness information in the interface depends on the amount of interaction that the task demands between the group members, and the information content of others’ interaction with the workspace. In addition, and as exemplified by the Copy task, the existing channels and mechanisms for maintaining workspace awareness must be considered during the design of additional support. In sum, the experiment of Chapter 9 shows not so much that workspace awareness support will improve usability in all systems, but that there are general characteristics of systems where it can improve usability.
11.5.2 The research process The findings in this research can be extended to more general situations in part because of the nature of the research process used. In particular, the construction of a theoretical and practical infrastructure in the first parts of the dissertation allowed me to trace the experimental results back to well-documented knowledge about awareness and workspace awareness. The theoretical basis provided some generative power in designing workspace awareness displays, but its real contribution lay in organizing and comparing designs, and in helping to explain the results of trials and evaluations. For example, the perception-action cycle introduced in Chapter 2 served as a valuable tool in explaining the results of the usability study, and previous work on communication in shared spaces (Section 3.5.1) served as principles to account for the results of the controlled experiment. The approach of tying design research to existing theory, and the three-stage cycle of
239
operationalization, application, and evaluation, can and should be used in other areas of HCI and CSCW.
11.5.3 Lessons for practitioners In previous chapters, I have given several several principles and guidelines for improving the design of real-time groupware systems. However, a few general lessons can be distilled from the work to act as keys for designers. First and foremost of these is that workspace awareness is a real design requirement of groupware, and designers must think about what people need to know about one another when working in a shared workspace. In many cases, current groupware systems completely ignore the issue of workspace awareness, and do not provide even basic support techniques like telepointers; in these systems, a little extra design thought would go a long way in improving usability. The second lesson is that there are a number of simple starting points for thinking about workspace awareness support. The three parts of the conceptual framework deal with three basic questions—what information is needed, how is it obtained, and how is it used—that can be considered in any groupware design project. The third lesson is that although basic support for workspace awareness can make a large difference in a system with no support, designers must be careful not to assume too much about how human interaction will work. Collaboration in shared workspaces is rich and complex, and providing more comprehensive awareness support will often require considerable work.
11.6 Future work This research raises many new questions. I describe four general areas below that show promise for further research based on what I have done so far: further exploration of workspace awareness, further investigation of groupware usability, support for awareness at the toolkit level, and investigation of privacy and awareness.
240
11.6.1 Further exploration of workspace awareness Although I have done considerable design and evaluation work in this dissertation, further research is warranted in both these areas. I outline five natural extensions below. •
The awareness displays, particularly the radar view, should be tested in a wider range of settings to broaden understanding of when and where awareness support is valuable. Other settings include different types of tasks and larger groups (3-5 people). I have informally observed the use of the radar view with a larger group, and it seems clear that there will be differences between pairs and larger groups in both computational performance and display use. For example, as mentioned in Chapter 8, identification and clutter become bigger problems when there are more than two people in the workspace.
•
Workspace awareness should be explored in other more realistic work contexts. For example, a reasonable setting could involve distributed engineering work over technical drawings in an organization with head and field offices. Looking at workspace awareness in an ongoing work situation would require different methods than I used here. In particular, naturalistic techniques for analyzing work activity and evaluating systems are called for, such as ethnography, contextual inquiry, or interaction analysis.
•
I constrained my investigation of workspace awareness by looking primarily at awareness of the present: that is, who, what, and where questions. This leaves open a broad area of research into awareness of change that I explored only briefly (e.g. Section 5.1.3). Providing information about the past is one way that a groupware system can go beyond what is naturally available in a face-to-face workspace. Although physical spaces provide rich information about the present, they do not often store it for later perusal. Information about change could be used to help people bring themselves up to date when they revisit parts of the workspace, or could be used to show how an artifact has been used over time.
241
•
Further work can be done in using visualization techniques to address the visibility problem in groupware workspaces. I have carried out some initial investigations of fisheye views and magnifier views (Section 5.2.3), but further development, other designs, and evaluation are yet to be done. There are a number of usability issues to be considered with these techniques, involving several aspects of collaboration: for example, can two people adequately indicate artifacts to one another when their views of the workspace look different. Working with these issues will also lead into the larger problem of maintaining awareness when each person can change the workspace representation that they see (Section 4.1.1).
•
One of the main obstacles to natural interaction in standard workstation-based groupware is the constraints imposed by current technology (see Section 4.1). The potential for adding information to a groupware environment increases dramatically when novel input devices, display technology, and interaction techniques are considered. In this dissertation, I limited my scope for the most part to standard workstation-based groupware technology. Workspace awareness, however, will also play an important role in systems with more novel input and display devices, and this role should be explored. Although requirements for awareness will not change with the addition of new devices, the designer will have a much wider range of possibility for conveying awareness information. For example, three-dimensional sound could be used to convey direction and proximity information about actions, and advanced input devices such as eye trackers could provide information about gaze direction.
11.6.2 Groupware usability Usability is not a well-understood quality in groupware systems. There has been little work done in defining groupware usability, in determining the characteristics of existing usable systems, or in establishing metrics for assessing the usability of multi-user software. This situation stands in contrast to usability work in single-user systems, where usability engineering and testing practices have made a tremendous impact on the 242
software industry. I believe that a better understanding of groupware usability can have a similar effect on the nascent field of ‘groupware engineering.’ In Chapter 7, I defined groupware usability as the degree to which a groupware system supports people in carrying out the activities of collaboration. Although I identify some of these activities (e.g. communication, coordination, coupling), more work is required to determine the elements of teamwork for shared-workspace groupware. In addition, further research must consider the criteria that determine when the activity is successful and when unsuccessful, and must also determine how these criteria can be translated into appropriate metrics for usability testing. Although research in group dynamics can provide a starting point, not a great deal is known about how groups carry out physical performance tasks (e.g. McGrath 1984). Again, naturalistic studies of work situations (e.g. Heath and Luff 1992; Hutchins 1995) will be helpful.
11.6.3 Toolkit-level facilities for supporting awareness Support for workspace awareness does not come without costs. If the burden of collecting, distributing, or displaying awareness information is too large, either for the developer or for the run-time system, then the benefits of the awareness support will be lost. Therefore, research is needed on ways to free the developer from some of the tasks of managing awareness information, and on ways to make awareness support faster and more efficient. I consider two issues below: reducing development costs, and reducing run-time costs for distribution of information. If an application developer is responsible for gathering, distributing, and displaying workspace awareness information, groupware development will be made more complex. For example, in the pipeline system built for Chapter 9, more than 16% of the code (424 of 2595 lines) was used to manage awareness information; in the newspaper application of Chapter 8, the total is 32% (186 of 587 lines). A possible solution to this problem is to provide structures and abstractions in the groupware toolkit that handle the details of collecting, distributing, and displaying awareness information. For the GroupKit toolkit, 243
the solution could be based upon a system-level shared environment that stores and distributes information about the elements of workspace awareness. The environment would contain entries for each element of awareness, including who, where, and what information, and possibly also how and when information. The environment would provide default services, a standard API, and facilities for extension and customization. The second cost of providing awareness information is the load that it places on the local system through additional interface display and network communication. Since awareness information is generally required for each member of the group, loads will increase linearly as more people join the conference. However, linear increase is non-trivial in the case of small groups: increasing the size of the group from two to three doubles the number of messages each machine must process. There are several possible strategies to prevent machines from being overloaded by awareness information. Three techniques that concentrate on managing communication load are described below: flexible messagepassing, centralized awareness data, and priorization of awareness information. •
Flexible message-passing. Different kinds of data in a groupware system have different characteristics. For example, telepointer messages require low latency, but do not suffer from a few lost or out-of-order messages. Messages about object state data, on the other hand, may allow greater latency but generally must be executed in order. Communication mechanisms in a groupware application could take advantage of these different characteristics to maintain local performance. That is, different means for communicating could be matched to different types of messages. For example, using different protocols (e.g. TCP/IP or UDP) provide different speed and service guarantees, and different message types (e.g. RPC or “raw data”) imply different amounts of send and receive overhead.
•
Centralized awareness environment. In situations where machines cannot keep up with the awareness information produced, it may be necessary to change the data architecture of the awareness environment. For example, the environment could be centralized on one machine, with periodic updates to each machine where the period 244
depends on the machine’s speed. In other cases, machines would request an awareness update when they had time to process the information. •
Priorization of awareness information. Since different kinds of awareness information
have
different
qualities
(e.g.
importance,
granularity,
latency
requirements), they can be priorized in some situations. This implies that the receiving machine can process high-importance messages first, and deal with lowpriority information when it gets time.
11.6.4 Awareness and privacy In this dissertation, I have concentrated on ways to help people be more aware of one another. However, there are work situations where awareness is not always desired, situations where personal or work privacy is compromised. A further area for additional research is in finding ways to manage the risks in the relationship between awareness and privacy. Techniques and displays for gathering, distributing, and displaying information about other people always present issues of personal privacy and control over the information (e.g. Want et al 1992). The feeling of being spied on appeals to no one, but invisible surveillance is becoming more of a problem in the modern workplace. I undertook this research with the assumption that collaboration is carried out by equal peers who participate willingly, operate within social norms, and have no ulterior motives. In these cases, people want others to be aware, since it provides considerable advantages for the collaboration. However, there is no guarantee that the techniques presented in this research will only be used in these situations. In particular, I see two potential threats to privacy: being able to observe someone without their knowledge, and being able to collect and analyze information not normally part of a face-to-face environment. Anonymous observation. In a face-to-face setting, it is generally easy to determine what kind of information a person is gathering about you. The detail with which one person can observe another corresponds to the obviousness of their information-gathering 245
behaviour. For example, watching someone from across the room may be difficult to detect, but also provides only general and high-level information about activities. Standing next to another person and peering down at their work area, in contrast, provides plenty of detail but is also extremely obvious (sly looks notwithstanding). This correspondence is not the case in a groupware environment, however. Just as groupware implies no natural affordances for getting awareness information, it implies no natural means for recognizing people’s information-gathering behaviour. If the system allowed, someone could silently and invisibly call up a detailed display of another person’s actions, and observe them at close range without their knowledge. Extraordinary information displays. Chapter 5 showed a few symbolic displays that extract certain information about a person’s activity, analyze it, and show the results of that analysis (e.g. activity over time). These kinds of displays can cause problems in that they show information that is not generally available in a physical environment. People are used to having their literal actions become public information in a face-to-face environment, but symbolic displays can go far beyond what people are used to. Although displays like an activity-over-time meter can be useful for collaboration, they could also be used to evaluate people unfairly. There are no simple solutions to the tradeoff between privacy and awareness. The blank slate of groupware gives extraordinary freedom in the use of available information, and along with benefit comes the possibility of misuse. Research is needed both in ways to prevent invasions of privacy, and in underlying structures (e.g. at the toolkit level) that make provision of that protection simple. One potential technique that follows naturally from the ideas presented in this dissertation is to provide (meta)awareness information about people’s information-gathering behaviour.
11.7 Conclusion The research in this dissertation moves the design of multi-user systems another step down a long path. In particular, helping people maintain workspace awareness can 246
improve the usability of groupware, and can make possible richer interaction than was possible before. Although collaboration in real-time distributed groupware is still a long way from what can be seen in face-to-face settings, I have increased understanding of how to support rich interaction over distance. Groupware and the people who use it will benefit as a result.
247
References
Abel, M., Experiences in an Exploratory Distributed Organization, in Intellectual Teamwork: Social and Technological Foundations of Cooperative Work, J. Galegher, R. Kraut and C. Egido ed., 489-510, Lawrence Erlbaum, Hillsdale, NJ, 1990. Ackerman, M., and Starr, B., Social Activity Indicators: Interface Components for CSCW Systems, Proceedings of the ACM Symposium on User Interface Software and Technology, 1995, 159-168. Adams, M., Tenney, Y., and Pew, R., Situation Awareness and the Cognitive Management of Complex Systems, Human Factors, 37(1), 85-104, 1995. Aldus Corporation, Aldus SuperPaint, Aldus Corporation, 1990. Baecker, R., Readings in Groupware and Computer-Supported Cooperative Work, Morgan Kaufmann, San Mateo, CA, 1993. Baecker, R., Grudin, J., Buxton, W., and Greenberg, S., Design and Evaluation (Introduction), in Readings in Human-Computer Interaction: Toward the Year 2000, R. Baecker, J. Grudin, W. Buxton and S. Greenberg ed., 73-92, Morgan Kaufmann, San Fransisco, 1995. Baecker, R., Grudin, J., Buxton, W., and Greenberg, S., Readings in Human-Computer Interaction: Toward the Year 2000, Morgan Kaufmann, San Fransisco, 1995. Baecker, R., Nastos, D., Posner, I., and Mawby, K., The User-Centred Iterative Design of Collaborative Writing Software, Proceedings of the Conference on Human Factors in Computing Systems, Amsterdam, 1993, 399-405. Beaudouin-Lafon, M., and Karsenty, A., Transparency and Awareness in a Real-Time Groupware System, Proceedings of the Conference on User Interface and Software Technology, Monterey, CA, 1992, 171-180. Bederson, B., and Hollan, J., Pad++: A Zooming Graphical Interface for Exploring Alternate Interface Physics, Proceedings of the ACM Symposium on User Interface Software and Technology, 1994, 17-26. Benford, S., Bowers, J., Fahlen, L., Greenhalgh, C., and Snowdon, D., User Embodiment in Collaborative Virtual Environments, Proceedings of the Conference on Human Factors in Computing Systems (CHI'95), 1995, 242-249. Bier, E., Stone, M., Fishkin, K., Buxton, W., and Baudel, T., A Taxonomy of SeeThrough Tools, Proceedings of the Conference on Human Factors in Computing Systems, 1994, 358-364. 248
Blattner, M., Sumikawa, D., and Greenberg, R., Earcons and Icons: Their Structure and Common Design Principles, Human-Computer Interaction, 4(1), 11-44, 1989. Bly, S., Harrison, S., and Irwin, S., Media Spaces: Bringing People Together in a Video, Audio, and Computing Environment, Communications of the ACM, 36(1), 29-34, 1992. Borenstein, N., and Thyberg, A., Cooperative Work in the Andrew Message System, Proceedings of the Conference on Computer-Supported Cooperative Work, Portland, OR, 1988, 26-28. Borning, A., and Travers, M., Two Approaches to Casual Interaction over Computer and Video Networks, Proceedings of the Conference on Human Factors in Computing Systems, New Orleans, LA, 1991, 13-19. Brennan, S., Seeking and Providing Evidence for Mutual Understanding, Ph.D. thesis, Stanford University, Stanford, CA, 1990. Brinck, T., and Gomez, L. M., A collaborative medium for the support of conversational props, Proceedings of Proceedings of the ACM Conference on Computer Supported Cooperative Work (CSCW'92), Toronto, Ontario, 1992, 171-178. Byrne, M., Wood, S., Sukaviriya, P., Foley, J., and Kieras, D., Automating Interface Evaluation, Proceedings of the Conference on Human Factors in Computing Systems, Boston, 1994, 232-237. Calgary Herald. Calgary Herald, Calgary, 1997. Chapanis, A., Interactive Human Communication, Scientific American, 232(3), 36-42, 1975. Clark, H., Using Language, Cambridge University Press, Cambridge, 1996. Clark, H. H., and Brennan, S. E., Grounding in Communication, in Readings in Groupware and Computer Supported Cooperative Work: Assisting HumanHuman Collaboration, R. M. Baecker ed., 222-233, Morgan-Kaufmann Publishers, Mountain View, CA, 1991. Crowley, T., and Forsdick, T., MMConf: The Diamond Multimedia Conferencing System, Proceedings of Groupware Technology Workshop, Palo Alto, California, 1989 Dewan, P., and Choudhary, R., Primitives for Programming Multi-User Interfaces, in Readings in Groupware and Computer Supported Cooperative Work: Assisting Human-Human Collaboration, R. M. Baecker ed., 681-690, Morgan-Kaufmann Publishers, Mountain View, CA, 1991. Dix, A., Finlay, J., Abowd, G., and Beale, R., Human-Computer Interaction, Prentice Hall, 1993.
249
Doerry, E., An Empirical Comparison of Copresent and Technologically-Mediated Interaction Based on Communicative Breakdown. Ph.D. Thesis, Department of Computer and Information Science, University of Oregon. Dourish, P., and Bellotti, V., Awareness and Coordination in Shared Workspaces, Proceedings of the Conference on Computer-Supported Cooperative Work, Toronto, 1992, 107-114. Dourish, P., and Bly, S., Portholes: Supporting Awareness in a Distributed Work Group, Proceedings of the Conference on Human Factors in Computing Systems, Monterey, CA, 1992, 541-547. Egido, C., Teleconferencing as a Technology to Support Cooperative Work: Its Possibilities and Limitations, in Intellectual Teamwork: Social and Technological Foundations of Cooperative Work, J. Galegher, R. Kraut and C. Egido ed., 351372, Lawrence Erlbaum, Hillsdale, NJ, 1990. Ellis, C., Gibbs, S., and Rein, G., Groupware: Some Issues and Experiences, Communications of the ACM, 34(1), 38-58, 1991. Endsley, M., Measurement of Situation Awareness in Dynamic Systems, Human Factors, 37(1), 65-84, 1995. Endsley, M., Toward a Theory of Situation Awareness in Dynamic Systems, Human Factors, 37(1), 32-64, 1995. Engelbart, D., and English, W., A research center for augmenting human intellect, Proceedings of Proceedings of the Fall Joint Computing Conference, Montvale, NY, 1968, 395-410. Flach, J., Situation Awareness: Proceed With Caution, Human Factors, 37(1), 149-157, 1995. Forsyth, D., An Introduction to Group Dynamics, Brooks-Cole, Monterey, CA, 1983. Fracker, M., Attention Allocation in Situation Awareness, Proceedings of the Human Factors Society 33rd Annual Meeting (Visual Performance: Spatial Awareness), 1989, 1396-1400. Furnas, G., Generalized Fisheye Views, Proceedings of the Conference on Human Factors in Computing Systems, 1986, 16-23. Gaba, D., Howard, S., and Small, S., Situation Awareness in Anesthesiology, Human Factors, 37(1), 20-31, 1995. Gaines, B., and Shaw, M., Concept Maps as Hypermedia Components, International Journal of Human-Computer Studies, 43(5), 323-361, 1995. Galegher, J., Kraut, R., and Egido, C., Intellectual Teamwork: Social and Technological Foundations of Cooperative Work, Lawrence Erlbaum, Hillsdale, NJ, 1990.
250
Gaver, W., Everyday Listening and Auditory Icons, Ph.D. thesis, University of California, San Diego, 1988. Gaver, W., Sound Support for Collaboration, Proceedings of the Second European Conference on Computer Supported Cooperative Work, 1991, 293-308. Gaver, W., Moran, T., MacLean, A., Lovstrand, L., Dourish, P., Carter, K., and Buxton, W., Realizing a Video Environment: EuroPARC's RAVE System, Proceedings of the Conference on Human Factors in Computing Systems, Monterey, CA, 1992, 27-35. Gaver, W., Smith, R., and O'Shea, T., Effective Sounds in Complex Systems: The ARKola Simulation, Proceedings of the Conference on Human Factors in Computing Systems, New Orleans, 1991, 85-90. Gilson, R. D., Introduction to the Special Issue on Situation Awareness, Human Factors, 37(1), 3-4, 1995. Goodwin, C., Conversational Organization: Interaction Between Speakers and Hearers, Academic Press, New York, 1981. Greenberg, S., Sharing views and interactions with single-user applications, Proceedings of Proceedings of the ACM/IEEE Conference on Office Information Systems, Cambridge, Massachusetts, 1990, 227-237. Greenberg, S., Computer-Supported Cooperative Work and Groupware, Academic Press, London, 1991. Greenberg, S., Peepholes: Low Cost Awareness of One's Community, Proceedings of the Conference on Human Factors in Computing Systems (Conference Companion), Vancouver, 1996, 206-207. Greenberg, S., and Bohnet, R., GroupSketch: A multi-user sketchpad for geographicallydistributed small groups, Proceedings of Proceedings of Graphics Interface '91, Calgary, Alberta, 1991 Greenberg, S., Gutwin, C., Cockburn, A., and Roseman, M., Applying DistortionOriented Displays to Groupware (Videotape), Proceedings of the Conference on Computer-Supported Cooperative Work (Video Proceedings), Boston, 1996 Greenberg, S., Gutwin, C., and Roseman, M., Semantic Telepointers for Groupware, Proceedings of the Australasian Conference on Computer-Human Interaction, Hamilton NZ, 1996, in press. Greenberg, S., and Marwood, D., Real Time Groupware as a Distributed System: Concurrency Control and its Effect on the Interface, Proceedings of the Conference on Computer-Supported Cooperative Work, Chapel Hill NC, 1994, 207-217.
251
Greenberg, S., and Roseman, M., GroupWeb: A WWW Browser as Real Time Groupware, Proceedings of the Conference on Human Factors in Computing Systems (Conference Companion), Vancouver, 1996, 271-272. Greenberg, S., Roseman, M., Webster, D., and Bohnet, R., Issues and Experiences Designing and Implementing Two Group Drawing Tools, in Readings in Groupware and Computer Supported Cooperative Work: Assisting HumanHuman Collaboration, R. M. Baecker ed., 609-620, Morgan-Kaufmann Publishers, Mountain View, CA, 1992. Grudin, J., Groupware and Cooperative Work: Problems and Prospects, in The Art of Human-Computer Interface Design, B. Laurel ed., 171-185, Addison-Wesley, Reading, Mass., 1990. Gutwin, C., and Greenberg, S., Workspace Awareness for Groupware, Proceedings of the Conference on Human Factors in Computing Systems, Vancouver, 1996a, 208209. Gutwin, C., and Greenberg, S., Workspace Awareness Support with Radar Views, Proceedings of the Conference on Human Factors in Computing Systems, Vancouver, 1996b, 210-211. Gutwin, C., Greenberg, S., and Cockburn, A., Using Distortion-Oriented Displays to Support Workspace Awareness, Proceedings of People and Computers XI (BCSHCI'96), London, 1996, 299-314. Gutwin, C., Greenberg, S., and Roseman, M., Supporting Workspace Awareness in Groupware (Videotape), Proceedings of the Conference on Computer-Supported Cooperative Work (Video Proceedings), Boston, 1996 Gutwin, C., Roseman, M., and Greenberg, S., A Usability Study of Awareness Widgets in a Shared Workspace Groupware System, Proceedings of the Conference on Computer-Supported Cooperative Work, Boston, 1996, 258-267. Harrison, S., and Minneman, S., The Media Space: A Research Project into the Use of Video as a Design Medium, in Readings in Groupware and Computer Supported Cooperative Work: Assisting Human-Human Collaboration, R. M. Baecker ed., 785-791, Morgan-Kaufmann Publishers, Mountain View, CA, 1990. Heath, C., Disembodied conduct: Communication through video in a multi-media environment, Proceedings of ACM SIGCHI Conference on Human Factors in Computing Systems, New Orleans, 1991, 99-104. Heath, C., Jirotka, M., Luff, P., and Hindmarsh, J., Unpacking Collaboration: the Interactional Organisation of Trading in a City Dealing Room, Computer Supported Cooperative Work, 3(2), 147-165, 1995. Heath, C., and Luff, P., Collaboration and Control: Crisis Management and Multimedia Technology in London Underground Line Control Rooms., Computer-Supported Cooperative Work, 1(1-2), 69-94, 1992. 252
Heiman, G., Research Methods in Psychology, Houghton Mifflin, Boston, 1995. Hill, W., Hollan, J., Wroblewski, D., and McCandless, T., Edit Wear and Read Wear, Proceedings of the Conference on Human Factors in Computing Systems, New Orleans, 1991, 3-9. Hopkins, D., SimCityNet, Proceedings of the Conference on Human Factors in Computing Systems (Adjunct Proceedings), 1993, 225. Hubbell, S., Tabloids: They Came From Outer Space!, Smithsonian, 24(3), 70-96, 1993. Hudson, S., and Smith, I., Techniques for Addressing Fundamental Privacy and Disruption Tradeoffs in Awareness Support Systems, Proceedings of the Conference on Computer-Supported Cooperative Work, Boston, 1996, 248-257. Hughes, J., King, V., Rodden, T., and Andersen, H., Moving Out from the Control Room: Ethnography in System Design, Proceedings of the Conference on ComputerSupported Cooperative Work (CSCW'94), Chapel Hill NC, 1994, 429-439. Hutchins, E., The Technology of Team Navigation, in Intellectual Teamwork: Social and Technological Foundations of Cooperative Work, J. Galegher, R. Kraut and C. Egido ed., 191-220, Lawrence Erlbaum, Hillsdale, NJ, 1990. Hutchins, E., Cognition in the Wild, MIT Press, Cambridge, MA, 1995. Ishii, H., and Kobayashi, M., ClearBoard: A Seamless Medium for Shared Drawing and Conversation with Eye Contact, Proceedings of the Conference on Human Factors in Computing Systems, Monterey, CA, 1992, 525-532. Ishii, H., Kobayashi, M., and Grudin, J., Integration of inter-personal space and shared workspace: ClearBoard design and experiments, Proceedings of Proceedings of the ACM Conference on Computer Supported Cooperative Work (CSCW'92), Toronto, Ontario, 1992, 33-42. Jackendoff, R., Consciousness and the Computational Mind, MIT Press, Cambridge, Mass., 1989. Jager Adams, M., Tenney, Y., and Pew, R., Situation Awareness and the Cognitive Management of Complex Systems, Human Factors, 37(1), 85-104, 1995. James, W., The Principles of Psychology, Harvard University Press, Cambridge, Mass., 1981. Krauss, R., and Fussell, S., Mutual Knowledge and Communicative Effectiveness, in Intellectual Teamwork: Social and Technological Foundations of Cooperative Work, J. Galegher, R. Kraut and C. Egido ed., 111-145, Lawrence Erlbaum, Hillsdale, NJ, 1990. Kraut, R., Egido, C., and Galegher, J., Patterns of Contact and Communication in Scientific Research Collaboration, in Intellectual Teamwork: Social and
253
Technological Foundations of Cooperative Work, J. Galegher, R. Kraut and C. Egido ed., 149-171, Lawrence Erlbaum, Hillsdale, NJ, 1990. Lauwers, J. C., Joseph, T. A., Lantz, K. A., and Romanow, A. L., Replicated Architectures for Shared Window Systems: A Critique, in Readings in Groupware and Computer Supported Cooperative Work: Assisting Human-Human Collaboration, R. M. Baecker ed., 651-662, Morgan-Kaufmann Publishers, Mountain View, CA, 1990. Lauwers, J. C., and Lantz, K. A., Collaboration Awareness in Support of Collaboration Transparency: Requirements for the Next Generation of Shared Window Systems, in Readings in Groupware and Computer Supported Cooperative Work: Assisting Human-Human Collaboration, R. M. Baecker ed., 663-671, Morgan-Kaufmann Publishers, Mountain View, CA, 1990. Leland, M. D. P., Fish, R. S., and Kraut, R. E., Collaborative document production using Quilt, Proceedings of Proceedings of the Conference on Computer-Supported Cooperative Work (CSCW '88), Portland, Oregon, 1988, 206-215. Linde, C., Who's in charge here? Cooperative work and authority negotiation in police helicopter missions, Proceedings of Proceedings of the Conference on ComputerSupported Cooperative Work (CSCW '88), Portland, Oregon, 1988, 52-64. Malone, T. W., Grant, K. R., Lai, K.-Y., Rao, R., and Rosenblitt, D. A., The Information Lens: An Intelligent System for Information Sharing and Coordination, in Readings in Groupware and Computer Supported Cooperative Work: Assisting Human-Human Collaboration, R. M. Baecker ed., 461-473, Morgan-Kaufmann Publishers, Mountain View, CA, 1989. McGrath, J., Groups: Interaction and Performance, Prentice-Hall, Englewood Cliffs NJ, 1984. McGrath, J., Methodology Matters: Doing Research in the Social and Behavioural Sciences, in Readings in Human-Computer Interaction: Toward the Year 2000, R. Baecker, J. Grudin, W. Buxton and S. Greenberg ed., 152-169, Morgan Kaufmann, San Fransisco, 1994. McLaughlin, M., Conversation: How Talk is Organized, Sage, Beverly Hills, 1984. Microsoft Corporation, Microsoft NetMeeting, Microsoft Corporation, 1997. Mitchell, A., Communication and Shared Understanding in Collaborative Writing, M.Sc. thesis, University of Toronto, Toronto, 1996. Miyake, N., Constructive Interaction and the Iterative Process of Understanding, Cognitive Science, 10, 151-177, 1986. Monk, A., McCarthy, J., Watts, L., and Daly-Jones, O., Measures of Process, in CSCW Requirements and Evaluation, P. Thomas ed., 125-139, Springer-Verlag, London, 1996. 254
Neisser, U., Cognition and Reality, W.H. Freeman, San Fransisco, 1976. Netscape Corporation, Netscape Communicator, Netscape Communications, 1997. Nielsen, J., Usability Engineering, , Boston, 1993. Norman, D., Things That Make Us Smart, Addison-Wesley, Reading, Mass., 1993. O'Grady, T., Flexible Data Sharing in a Groupware Toolkit, M.Sc. thesis, University of Calgary, Calgary, 1996. Olson, J., Olson, G., and Meader, D., What Mix of Video and Audio is Useful for Small Groups Doing Remote Real-Time Design Work?, Proceedings of the Conference on Human Factors in Computing Systems (CHI'95), 1995, 362-368. Olson, J. S., Olson, G. M., Storrosten, M., and Carter, M., How a group-editor changes the character of a design meeting as well as its outcome, Proceedings of Proceedings of the ACM Conference on Computer Supported Cooperative Work (CSCW'92), Toronto, Ontario, 1992, 91-98. Ousterhout, J., Tcl and the Tk Toolkit, Addison-Wesley, 1996. Pinsonneault, A., and Kraemer, K. L., The Impact of Technological Support on Groups: An Assessment of the Empirical Research, in Readings in Groupware and Computer Supported Cooperative Work: Assisting Human-Human Collaboration, R. M. Baecker ed., 754-773, Morgan-Kaufmann Publishers, Mountain View, CA, 1989. Robinson, M., Computer-Supported Cooperative Work: Cases and Concepts, Proceedings of Groupware '91, 1991, 59-75. Rohall, S., Patterson, J., and Hill, R., Go Fish! A Multi-User Game in the Rendezvous System (Videotape), Proceedings of the Conference on Human Factors in Computing Systems, 1992, 647. Root, W. R., Design of a multi-media vehicle for social browsing, Proceedings of Proceedings of the Conference on Computer-Supported Cooperative Work (CSCW '88), Portland, Oregon, 1988, 25-38. Roseman, M., and Greenberg, S., GROUPKIT: A Groupware Toolkit for Building RealTime Conferencing Applications, Proceedings of the Conference on ComputerSupported Cooperative Work (CSCW'92), Toronto, 1992, 43-50. Roseman, M., and Greenberg, S., Building Real-Time Groupware with GroupKit, a Groupware Toolkit, Transactions on Computer-Human Interaction, 3(1), 66-106, 1996. Roseman, M., and Greenberg, S., TeamRooms: Network Places for Collaboration, Proceedings of the Conference on Computer-Supported Cooperative Work, Boston, 1996
255
Sacks, H., Schegloff, E., and Jefferson, G., A Simplest Semantics for the Organization of Turn-Taking for Conversation, Language, 50, 696-735, 1974. Salas, E., Prince, C., Baker, D., and Shrestha, L., Situation Awareness in Team Performance: Implications for Measurement and Training, Human Factors, 37(1), 123-136, 1995. Salvador, T., Scholtz, J., and Larson, J., The Denver Model for Groupware Design, SIGCHI Bulletin, 28(1), 52-58, 1996. Sarin, S., and Greif, I., Computer-based real-time conferencing systems, IEEE Computer, 18(10), 33-45, 1985. Sarkar, M., and Brown, M., Graphical Fisheye Views of Graphs, Proceedings of the Conference on Human Factors in Computing Systems, 1992, 83-91. Sarter, N., and Woods, D., How in the World Did We Ever Get into That Mode? Mode Error and Awareness in Supervisory Control, Human Factors, 37(1), 5-19, 1995. Seely Brown, J., Collins, A., and Duguid, P., Situated Cognition and the Culture of Learning, Educational Researcher(January-February), 32-42, 1989. Segal, L., Effects of Checklist Interface on Non-Verbal Crew Communications, NASA Ames Research Center, Contractor Report 177639, 1994. Segal, L., Designing Team Workstations: The Choreography of Teamwork, in Local Applications of the Ecological Approach to Human-Machine Systems, P. Hancock, J. Flach, J. Caird and K. Vicente ed., 392-415, Lawrence Erlbaum, Hillsdale, NJ, 1995. Short, J., Williams, E., and Christie, B., Communication Modes and Task Performance, in Readings in Groupware and Computer Supported Cooperative Work: Assisting Human-Human Collaboration, R. M. Baecker ed., 169-176, Morgan-Kaufmann Publishers, Mountain View, CA, 1976. Simon, H., The Sciences of the Artificial, MIT Press, Cambridge, MS, 1969. Smith, K., and Hancock, P., Situation Awareness is Adaptive, Externally Directed Consciousness, Human Factors, 37(1), 137-148, 1995. Smith, R., What You See Is What I Think You See, SIGCUE Outlook, 21(3), 18-23, 1992. Smith, R. B., O'Shea, T., O'Malley, C., Scanlon, E., and Taylor, J., Preliminary experiences with a distributed, multi-media, problem environment, Proceedings of Proceedings of the 1st European Conference on Computer Supported Cooperative Work (EC-CSCW '89), Gatwick, U.K., 1989 Stefik, M., Foster, G., Bobrow, D., Kahn, K., Lanning, S., and Suchman, L., Beyond the Chalkboard: Computer Support for Collaboration and Problem Solving in Meetings, Communications of the ACM, 30(1), 32-47, 1987a. 256
Stefik, M., Bobrow, D., Foster, G., Lanning, S., and Tatar, D., WYSIWIS Revised: Early Experiences with Multiuser Interfaces, ACM Transactions on Office Information Systems, 5(2), 147-167, 1987b. Tang, J., Listing, Drawing, and Gesturing in Design: A Study of the Use of Shared Workspaces by Design Teams, Ph.D. thesis, Stanford University, Stanford, CA, 1989. Tang, J., Findings from Observational Studies of Collaborative Work, International Journal of Man-Machine Studies, 34(2), 143-160, 1991. Tang, J. C., and Minneman, S. L., Videodraw: A video interface for collaborative drawing, Proceedings of ACM SIGCHI Conference on Human Factors in Computing Systems, Seattle Washington, 1990, 313-320. Tang, J. C., and Minneman, S. L., VideoWhiteboard: Video shadows to support remote collaboration, Proceedings of ACM SIGCHI Conference on Human Factors in Computing Systems, New Orleans, 1991, 315-322. Tatar, D., Foster, G., and Bobrow, D., Design for Conversation: Lessons from Cognoter, International Journal of Man-Machine Studies, 34(2), 185-210, 1991. Underwood, G., Awareness and Self-Awareness, Academic Press, London, 1982. Valacich, J. S., Dennis, A. R., and Nunamaker Jr, J. F., Electronic meeting support: The GroupSystems concept, International Journal of Man Machine Studies, 34(2), 262-282, 1991. Want, R., Hopper, A., Falcao, V., and Gibbons, J., The Active Badge Location System, ACM Transactions on Information Systems, 10(1), 91-102, 1992. Wickens, C., Engineering Psychology and Human Performance, Harper Collins, 1992. Williams Electronics, Defender, Williams Electronics Corporation, 1980.
257
Appendix A: Usability study materials
A.1 Consent form Awareness Widgets Study The study will test several ‘awareness widgets’ in a groupware system. The experimenters are Carl Gutwin and Mark Roseman. Data collected will be questionnaires, video and audiotape. I consent to act as a subject in the awareness widgets study. I understand that at any time during the study, I may stop participating for any reason, and that all data collected up to that point will be discarded. I agree to let the resulting data from the study be used for analysis and presentation, including presentation to general audiences such as at technical conferences. I understand that this data includes videotape and audiotape recordings that will be made of the session. Name: Date: Signature :
A.2 Questionnaire (radar version) Usability Study—Questionnaire The following questions ask you to consider how well the system supported you and your partner as you completed the layout task. In particular, they look at the ways that the system and various displays within it provided you with information about your partner’s work. Some of the questions are framed as statements that you may agree or disagree with. Note that some of these questions have a positive slant, and some have a negative slant. Other questions ask you to write a short response or choose from a few alternatives. Strongly Disagree Neutral Disagree
258
Agree
Strongly Agree
Information content The system provided the right amount of information about my partner The system did not provide the right kind of information about my partner The information about the other person shown in the radar display was accurate Was any necessary information missing or inaccurate? Other comments Accuracy and appropriateness The radar display adequately showed my partner's location in the workspace The radar display adequately showed what my partner was doing The radar display was precise enough for the task Other comments Availability of information When I needed information about my partner, it was difficult to find It was easy to determine where my partner was working It was difficult to determine what my partner was doing It was easy to determine what my partner was going to do next It was easy to get the information that I needed from the radar display The radar display distracted me from my own work Other comments Methods of gathering information When you needed to know what was going on with your partner, how did you gather that information? How did you determine where your partner was working? [Asked them] [I just knew] [Used radar] [Looked for their telepointer] Other: Effectiveness The system allowed us to complete the task in the way we wanted The system allowed me to collaborate effectively with my partner The system allowed us to complete the task efficiently The radar display made it harder to complete the task The radar display improved the quality of what we produced The radar display slowed down the completion of the task Other comments Results I was happy with the quality of what we produced using the
259
system The radar display improved the quality of what we produced Other comments Value The radar display was a valuable addition to the system The radar display was not worth the screen space it used The screen space used for the radar display could have been better used to increase the area of the main display
260
Appendix B: Experiment materials
B.1 Consent form [University Letterhead] Research Project Title: Effects of radar view on group performance in distributed groupware Investigators: Carl Gutwin Dr. Saul Greenberg (supervisor) Krista McIntosh (Human Factors) Jase Chugh (Human Factors) This consent form, a copy of which has been given to you, is only part of the process of informed consent. It should give you the basic idea of what the research is about and what your participation will involve. If you would like more detail about something mentioned here, or information not included here, please ask. Please take the time to read this form carefully and to understand any accompanying information. Experiment purpose: The aim of this project is to evaluate the usefulness of a computer display called a radar view, for groups working in a shared workspace through different computers (that is, groupware). Participant recruitment and selection: Participants are being recruited from the general University of Calgary student population. Your group has been randomly assigned to one of two experimental conditions. Procedure: This session will require about 1 ½ hours of your time, and will include the following activities: 1. Introduction to the computer system and the task area 2. Practice with the functions of the system 3. Seven collaborative tasks 4. A questionnaire regarding the usability of the system 5. A short interview Data collection: Verbal discussions during the timed task will be audiotaped, and a third computer monitor will be videotaped. The computer will also log actions performed in the system. Permission to use audio and video: As audio and video tapes will be recorded during the session, this consent form also requests explicit permission to use unidentified verbatim transcripts and video sequences in future presentations and reports. In cases where transcripts or video are used, participant names and other identifying information will be removed. Confidentiality: Confidentiality and participant anonymity will be strictly maintained. Reports and presentations will refer to participants and groups using only an assigned number. Audio and videotapes, computer records stored on
261
floppy disk, questionnaires, and interview responses will all be stored by the primary investigator in a locked file cabinet. The four investigators above are the only persons who will have access to the raw data.
Remuneration: Each participant will receive $10.00 for their involvement in the study. Likelihood of discomfort: There is no likelihood of discomfort or risk associated with participation. Primary researchers: Carl Gutwin is a Ph.D. student in the department of Computer Science at the University of Calgary; this study is part of his thesis research. His supervisor is Dr. Saul Greenberg, Associate Professor in the department of Computer Science. Finding out about results: Participants can find out the results of the study by contacting the primary researcher after May 31, 1997, or by looking at the WWW page http://www.cpsc.ucalgary.ca/~gutwin/research/results.html after May 31, 1997.
Your signature on this form indicates that you have understood to your satisfaction the information regarding participation in the research project and agree to participate as a participant. In no way does this waive your legal rights nor release the investigators, sponsors, or involved institutions from their legal and professional responsibilities. You are free to not answer specific items or questions in interviews or on questionnaires. You are free to withdraw from the study at any time without penalty. Your continued participation should be as informed as your initial consent, so you should feel free to ask for clarification or new information throughout your participation. If you have further questions concerning matters related to this research, please contact: Carl Gutwin (220-3532) or Dr. Saul Greenberg (220-6087) If you have any questions concerning your participation in this project, you may also contact the Office of the Vice-President (Research) and ask for Karen McDermid, 220-3381.
________________________________ Participant
___________________________ Date
________________________________ Investigator/Witness
___________________________ Date
A copy of this consent form has been given to you to keep for your records and reference.
262
B.2 Instructions and protocol There are several things that you can do with this system.
Radar View Study Procedure and Instructions
New pieces
Carl Gutwin March 5, 1997
The first thing is how to get a new piece of pipe. Once you’ve scrolled to one of the stacks, you can just drag the top piece off the pile. To drag pieces around, you click and drag with the left mouse button.
1. Setup: 2. Preamble: •
Hello and welcome
•
Overview of the session
•
Sign consent forms
•
Demographics information
Drag-scrolling
3. System Intro:
If you want to drag a piece a long way, drag it outside the main window and the view will scroll along with you. You’ll notice that the system leaves some junk behind - don’t worry about it, it will go away when you come back into the window.
Scenario
Rotating
In this session, we’re going to get you two to complete a couple of tasks using these two computers, which are linked together. The system that you’ll use to do the task is a groupware system, so you’ll both be working on the same objects even though you’re sitting at different workstations.
The right mouse button rotates pieces, just by clicking on the piece.
The scenario is that you two are engineers in the city works department, and this system is a pipeline simulator. System overview The system has a large workspace where you’ll be building the pipeline. This is the main view onto the workspace, where you’ll do the work. The screen isn’t big enough to show the whole workspace, but you can scroll around by holding down button 1 and dragging outside the window in the direction that you want to go. In the top left corner, there is a second window called the radar view. It shows the whole workspace in miniature, and you can use it to keep track of what’s happening overall. In the radar, you’ll notice these rectangles with different shapes in them. Those are the piles of pipe that you’ll use to build the network. There are four kinds of pipe: straight sections, elbows, t-sections, and caps for capping dead ends System functions
Joining To put pieces of pipe together, there are two steps. First, you put one section right beside another one. If it’s close enough, then the system will snap them together and blink the outline of the second piece in yellow. That tells you that the pieces are together and ready to be welded, but you can still move them individually. If you’re lining up a section that already has welds in it, it will only snap to pieces next to the one that you’re touching . Welding To weld them together, take the welder, this grey diamond, and drop it on the joint that you want to weld. Welds are marked with a yellow spot, and once they’re welded, you can move the whole thing with the left button. To unweld, just drop it again. Remember, just drop the welder, don’t click it. Welding problems If the welder blinks red, then the pieces aren’t lined up correctly. If they look lined up, just click one of the pieces that you want to weld, and see if it blinks yellow.
263
Radar view / Overview The [radar/over] view shows all of the pieces in the workspace, and shows them as they move around. It also shows welds and the welder - basically everything that happens in the main workspace is shown here. Also, the [green] rectangle shows what your main view contains. As we scroll around, the green rectangle moves as well. [Radar view] The mouse cursor is also duplicated in the radar by a green triangle. The grey corner taken out of the blue rectangle stands for the radar view - so if something’s in the grey corner, then it will be behind your radar view, and so you won’t be able to see it. [Overview only] The overview is updated whenever you let go of a piece or the welder.
The radar view also shows some things about the other person. Their view rectangle is shown in pink. So, what is contained in the pink rectangle is what they can see. Second, their mouse cursor is always visible in the radar, even when they’re somewhere else in the workspace. You can also gesture inside the radar; when I move my mouse cursor inside the radar, the other person can see it. [Overview only] The overview also shows the actions of the other person. The display updates whenever they finish moving a piece. •
Practice system functions
•
Test basic skills
•
Test audio levels
•
Video ready to record
4. Practice task
Groupware features
Task goals:
There are also several things that the system does as groupware. [Krista] has just joined us from the other machine, and our display will show us a few things about what she’s doing.
Your goal is to complete build the pipeline network shown in the diagram as quickly and accurately as possible. You may discuss the task and do whatever you need to do to complete it, but please stay focused on the task and work quickly.
Telepointers
Completion criteria:
First, when she’s looking at the same part of the workspace as we are, we can see her mouse cursor in [pink].
There are a few things that we will check in your pipeline to make sure that you are done:
Movement When she grabs a piece of pipe, we can see its outline change to her colour, and we can see it move as she drags it around. Locks Whenver someone does something to a piece, it’s locked, so the other person can’t do anything to it. If you try to do something to a piece that’s locked, your machine will beep at you.
All of the lines, corners, and junctions shown in the diagram should be in your network. Don’t spend time making it exact; just make sure all of the basic components are there. Don’t put extra bends or junctions into straight sections. All of the pieces in the network must be welded.
Radar view
As soon as you think that you’re done, let us know, and we’ll stop the clock and check. If there are things left to do, we’ll note them on the diagrams, restart the clock, and then let you finish.
[Full radar]
Collaboration:
264
you can talk as much as you want with your partner; we encourage you to discuss things;
•
run the task
•
stop the video
both of you working at the same time is likely to be faster than just having one of you do the work;
•
questionnaire B
•
load next task
remember that there’s only one welder, so you’ll have to share. •
Synchronize the time
•
Start the video & clock
•
Run the task
•
Stop video
•
Record time
•
Save the system state
Copy task In the next task, you’re each going to build a structure out of the pieces that are supplied at the bottom of the workspace. [Person 1], you’re going to build from the pieces at the right, and you’ll build in the rectangle at the right. [Person 2], you’ll build on the left. [Person 2] will have the map of what you’re both supposed to build, so [Person 1], you’ll have to watch what he does and do whatever he does. Again, you can talk as much as you want.
5. Questionnaire A
Here’s what I want you to build. Don’t worry about welding it, and you’re allowed to go outside the box - it’s just a guide. For practice, [Person 2] do this piece ; [Person 1], you do your piece as well.
6. Tasks Now I’d like you to do three different kinds of tasks. These are more specialized, but they still use the pipeline system.
Follow task
make sure they’re in the correct parts of the workspace (in the piece storehouses below their respective boxes)
The object of the first task is to complete a set of welds as quickly as possible. You’ll each play a different role : [Person 1], you’ll be the one who does the welding, and that’s all. You can’t move pieces, you just do the welding. [Person 2], you’re the one with the list of things to weld, and you have to go to each place and make sure that the pieces are in position. You also have to make sure that the welder can find the right place. You can talk as much as you want. Here is the set of welds that I want you to do. Please do them in order from 1 to 10, and don’t do any out of order. For practice, please do the one marked “P”. •
any questions?
•
make sure they’re in the centre of the workspace
•
make sure Person 1 has the welder
•
start the video
•
start the clock
any questions?
•
start the video
•
start the clock
•
run the task
•
stop the video
•
questionnaire B
•
load next task
Director task In the next task, one of you is going to talk the other through a set of things that have to be done to a pipeline. [Person 1], you’re going to do the instructing, and [Person 2], you’re going to do the work. [Person 1], you’ll notice that you only have the radar view, and . Here is what I want you to end up with; the lightgrey pieces are the ones that you should get [Person
265
2] to add to the pipeline. Please do them in order from 1 to 6. Again, don’t worry about welding. To practice, [Person 1], get [Person 2] to put his/her cursor on this piece here . [Person 2], please go to the centre of the workspace to start. •
any questions?
•
make sure they’re in the correct parts of the workspace
•
start the video
•
start the clock
•
run the task
•
stop the video
•
questionnaire B
•
load next task
7. Tasks (other condition) Explain the second condition. Repeat the three contrived tasks, with the alternate scenarios, and with the second condition. 8. Questionnaire C 9. Interview 10. Debriefing Purpose and expectations The purpose of the experiment is to determine whether information about what another person is doing and where they are working can improve a groupware system. We’re looking at whether seeing the other person’s view rectangle and telepointer make tasks like these easier. Finding out more When the experiment is finished at the end of March, you can find out what your group’s time was and what the results of the study were. There are a couple of ways to find out more, listed on your copy of the consent form. Questions •
Thanks again
•
Payment
•
Participants sign the payment sheet
266
B.3 Questionnaire (radar version) Questionnaire Part A The following questions ask you to consider how well the system supported your collaboration. Some of the questions are statements that you may agree or disagree with; others ask you to select a point along a scale. Collaboration: Strongly Disagree Neutral Agree Disagree
Strongly Agree
The group was able to collaborate efficiently It was easy to obtain the information I needed about my partner It was difficult to talk about particular objects in the task I always knew what my partner was talking about
Awareness: How often were you aware of where your partner was working? How precisely did you know where they were? How often were you aware of what your partner was doing? How precisely did you know what they were doing?
never
•
•
•
always
vaguely
•
•
•
precisely
never
•
•
•
always
vaguely
•
•
•
precisely
Radar view: How often did you use the radar view?
rarely
•
•
•
Strongly Disagree Neutral Agree Disagree
The radar view distracted me from my own work The radar view was too large The radar view was easy to understand The radar view showed me useful information about my partner It was difficult to make use of information that I got from the radar view I often forgot that the radar view was there It was hard to determine who was who in the radar view I would have rather had the extra screen space than the radar view It was easy to determine where my partner was in the radar view It was hard to tell what my partner was doing in the radar view
267
very often Strongly Agree
The radar view was a valuable part of the system
Questionnaire Part B How difficult was it to complete this task?
difficult
•
•
•
easy
little effort
•
•
•
a lot of effort
How hard did you have to concentrate to do this task? not hard
•
•
•
very hard
How difficult was it to discuss things during the task?
•
•
•
difficult
How much effort did this task require?
easy
Questionnaire Part C
Version 1
Version 2
Which version of the system better supported your collaboration? Which version of the system was easier to use for group work? Which version of the system did you prefer?
268
version 1
version 2
•
•
version 1
version 2
•
•
version 1
version 2
•
•
B.4 Additional task diagrams
10
5 1
3
2 4 9
8 6 7
Figure 89. Initial state and map for Follow 2 task
Figure 90. Goal diagram for Copy 2 task
269
2 5
6 1
4
3
Figure 91. Initial state and six additions for Direct 2 task
B.4 Summary of completion time data Group Cond. Order Practice
F1
C1
D1
F2
C2
D2
1
R
DFC
16.17
2.62 4.15 3.62 2.53 3.17 3.18
2
R
CFD
23.00
3.30 2.63 2.70 2.83 2.18 3.27
3
O
CDF
21.33
3.90 4.45 4.38 3.92 3.28 3.27
4
O
DFC
5
O
FCD
9.75
4.28 3.07 4.00 3.35 2.67 2.85
6
R
CDF
11.13
2.05 2.73 2.38 2.50 2.25 3.15
7
O
DFC
7.20
2.93 1.70 3.02 2.40 1.58 2.10
8
R
DCF
11.68
2.60 2.20 2.82 2.27 3.00 3.15
9
R
DFC
10
O
DCF
9.67
2.22 2.40 3.47 2.38 1.98 2.22
11
R
CFD
16.03
4.20 3.33 3.60 5.45 4.37 3.83
12
O
FDC
18.35
5.38 3.57 3.90 4.03 2.48 2.97
13
O
CDF
25.32
5.55 4.52 5.87
14
O
DCF
10.92
4.38 2.60 5.40 2.68 2.35 3.42
15
O
FDC
15.40
4.27 2.80 3.03 2.25 2.37 2.77
16
R
DCF
12.25
2.90 4.28 3.28 3.70 2.92 4.02
17
R
CFD
7.85
2.78 2.23 2.70 2.23 2.22 2.55
18
R
FDC
12.22
4.00 4.77 4.20 8.48
5.08 2.62 5.08 3.00 2.30 3.90
4.73 3.17 3.95 4.13 4.68 5.48
270
19
O
FCD
17.63
7.82 3.50 5.70 3.27 3.07 5.20
20
R
FCD
26.23
2.88 4.07 2.60 4.75 2.78 3.27
B.5 Summary of questionnaire data Group Cond’n
1 2 3 4 5 6 7 8 9 10 11 12 13 14 15 16 17 18
R R R R O O O O O O R R O O R R R R O O R R O O O O O O O O R R R R R
1 4 4 4 5 3 4 4 5 4 4 4 5 5 4 2 5 5 4 5 5 4 4 4 2 5 5 2 3 3 5 5 5 5 4 4
F1 2 3 1 1 2 4 2 1 2 2 3 3 2 2 2 3 2 2 2 1 2 2 1 2 2 2 2 4 2 3 4 4 1 2 2 3 2 3 4 2 3 3 4 4 2 3 2 1 4 3 1 1 2 4 4 4 3 3 4 4 4 3 1 2 2 3 1 1 2 3 3 3
4 1 3 1 1 3 2 2 2 1 1 2 1 3 3 4 2 2 2 2 2 2 2 1 1 1 1 5 2 3 2 1 2 1 1 1
1 3 3 5 4 4 4 4 5 5 5 5 5 5 3 2 4 5 4 5 5 4 4 5 4 5 5 5 5 5 5 4 5 5 5 3
W1 2 3 2 1 4 4 1 2 2 2 2 3 2 2 2 2 1 1 1 1 1 1 2 1 1 2 1 3 3 2 4 4 4 4 1 2 2 2 1 3 2 2 2 3 2 3 2 2 3 3 1 4 1 4 1 3 2 3 2 2 1 1 2 2 2 2 1 1 2 2 4 3
4 2 4 2 3 2 3 2 1 1 1 1 1 3 2 4 3 3 2 1 2 2 3 1 1 1 1 1 2 1 1 2 1 1 1 4
1 3 4 4 4 4 4 4 4 3 2 5 4 4 4 4 5 5 4 4 5 3 4 5 5 4 5 4 2 4 5 5 4 5 4 5
Task and Question D1 F2 2 3 4 1 2 3 3 2 2 2 3 4 2 3 2 3 2 3 2 2 3 4 2 2 3 3 3 4 3 2 3 2 3 4 2 2 2 3 3 4 2 2 2 2 1 5 2 2 2 3 4 5 1 1 3 3 2 5 1 1 4 4 4 5 1 1 1 1 1 3 4 3 3 3 4 3 3 4 4 4 5 5 2 3 2 1 3 5 2 1 4 3 2 5 2 2 1 2 1 3 4 4 2 2 3 5 1 2 2 2 2 3 3 3 2 2 2 4 4 2 2 1 2 5 1 2 3 4 3 3 4 4 2 2 2 3 4 4 3 2 1 5 1 1 1 2 1 2 3 2 2 3 3 2 4 1 3 3 4 4 2 4 4 5 4 5 1 2 3 3 2 5 1 2 1 3 1 5 1 1 1 1 2 3 3 4 2 3 4 4 4 4 1 1 1 4 1 1 3 2 2 4 2 2 2 3 1 2 4 5
271
4 3 3 2 2 2 2 1 1 1 1 2 2 1 2 1 2 1 3 2 1 2 4 1 1
1 2 4 4 5 4 4 5 5 5 4 4 5 5 5 3 3 4 3 5 5 4 4 5 5
W2 2 3 3 3 2 2 2 2 2 2 2 2 2 2 1 2 1 1 2 1 1 2 4 2 2 3 1 3 1 1 3 2 3 4 2 3 2 2 1 2 2 1 3 3 4 4 1 1 1 1
1 1 1 1 4 3 1 1 5
5 5 4 4 4 4 5 3
1 3 2 2 2 2 1 2
1 3 1 1 2 1 1 2
4 3 2 1 1 2 2 1 1 1 1 2 2 1 1 2 2 3 3 1 1 3 3 1 1
1 3 1 2 1 2 1 2
1 2 2 3 3 2 4 4 4 5 5 3 2 5 4 1 1 4 3 3 4 3 3 3 5
D2 2 3 3 3 4 4 3 3 3 4 4 3 3 2 1 1 2 2 1 1 1 2 3 3 4 4 3 2 3 2 5 5 4 4 3 3 3 3 3 2 3 3 3 4 4 4 4 3 1 1
4 4 4 3 3 4 3 1 1 1 2 3 4 2 2 5 4 4 2 2 3 3 3 3 1
5 3 3 4 3 2 4 4
2 3 4 1 3 5 1 2
5 4 3 2 3 4 1 2
2 2 4 1 3 5 2 3
19 20
R O O R R
4 4 2 5
3 3 4 3
3 4 3 3
1 2 4 1
3 5 5 4
3 1 1 3
4 3 1 3
2 2 1 1
4 3 2 4
4 3 3 3
4 3 3 3
3 4 4 1
1 5 5 2. 5 5 1 2 3 5 2 1 1 2 4 4 2 3
4 2 1 3
5 3 1 3
4 1 5 2 2 1 3 4 4 3 1 5 1 1 1 3 2 3 4 1 4 3 3 1 2 4 3 2
4 3 4 5 1 1 1 2 4 4 2
B.4 Summary of verbal count data Group Cond'n 1 R 2 R 3 O 4 O 5 O 6 R 7 O 8 R 9 R 10 O 11 R 12 O 13 O 14 O 15 O 16 R 17 R 18 R 19 O 20 R
F1 64 83 129 205 210 121 160 82
C1 224 4 124 11 29 149 1 185
D1 289 345 405 316 239 118 177 242
224 111 103 262 307 265 123 116
95 0 52 94 133 132 166 101
198 104 138 337 427 234 252 200
348 89
62 203
338 238
272