Evaluation of Different Vibration Visualization Modes for Line Tracking Yuan Wang
Martin J. Turner
W. Terry Hewitt
Computer Science School University of Manchester M13 9PL, Manchester, UK
Manchester Computing University of Manchester M13 9PL, Manchester, UK
Manchester Computing University of Manchester M13 9PL, Manchester, UK
[email protected]
[email protected]
[email protected]
ABSTRACT Using a vibration magnitude model [Wan06] established for the PHANToM haptic device, we have investigated the usability of different modes within a line tracking task. Three key questions were evaluated: (1) does vibration aid in tracking visible lines? (2) Which of the key vibration modes is preferred, either the vibration online mode where the vibration decreases with the distance from the line, or the vibration offline mode where the vibration increases away from the line? (3) And is linear or model constrained mapping more beneficial to the task? The experiment results show that although the vibration mode implemented on visible lines is actually more time-consuming than the mode without vibration, the time ratios spent in high accuracy areas with vibration are enhanced. In comparison with the online vibration, the vibration offline mode provides the more accurate performance to both visible and invisible lines. In certain cases, the vibration magnitude model mapping mode is shown to give superior results, however generally it has the similar usability with the linear mapping mode.
Keywords Haptic visualization, line tracking, vibration magnitude model, linear vibration mapping, model vibration mapping, vibration online mode, vibration offline mode.
1. INTRODUCTION 1.1 Visualization Visualization is a process of presenting data and information that conveys data’s meaning, increases information’s clarity, and aids user’s comprehension through their perception abilities. Geometries are very common in graphical visualization, such as hotspots, flow lines, orthoslices, isosurfaces and so on. These geometries highlight local pattern and global structure features of data fields, and thereby how to effectively represent them becomes critically essential to visualization. Touch sensation has been increasingly applied into the visualization field, which is normally referred to as haptic visualization. The word “haptic” comes Permission to make digital or hard copies of all or part of this work for personal or classroom use is granted without fee provided that copies are not made or distributed for profit or commercial advantage and that copies bear this notice and the full citation on the first page. To copy otherwise, or republish, to post on servers or to redistribute to lists, requires prior specific permission and/or a fee. Copyright UNION Agency – Science Press, Plzen, Czech Republic.
from the Greek haptesthai meaning “to touch”, and it can be divided into two types of sensations: kinaesthetic (force, torque) and tactile feedback. Basically kinesthetic feedback is stimulated by bodily movements and tension; while tactile sensation is primarily conveyed by pressure or vibration on the skin (thus here tactile sensation is characterised with vibration). Haptic visualization displays data and information with these haptic sensations. Tactile sensation has already shown great capability in information display, such as Braille document, however in the haptic visualization field, the research to date has tended to focus more on force and torque, due to their unique characteristics of bidirectional interaction [Bro90] [Iwa93] [Avi96] [Pao98] [Law04]. Owing to its natural characteristics of steering, force has been applied in various pattern recognition schemes, such as special points, lines, and surfaces [Dur98] [Rei03]. So far there has been little discussion about vibration application in visualization, and even less research has addressed how to represent geometries using vibration. The following section reviews recent research into haptic visualization methods pertaining to line geometry.
1.2 Line Visualization Lines have drawn much attention of visualization researchers, because of their simple but useful presentation ability for data and information. For instance, in information visualization, we could map month-long temperature data onto a line graph, with the x-axis representing date and the y-axis temperature, and then plot temperatures in different regions using various colourful or textured lines, in order to facilitate comparisons. In scientific visualization, lines are often used as, for example, streamlines portraying vectors in a flow field. Moreover other attributes, such as vector magnitude, can be mapped via colour on the line. However, many lines presented at the same time can result in visual clutter, and cause serious confusion. Under this circumstance, is there any other way to aid in displaying these lines? Haptic sensation has been revealed as an alternative. In this section, haptic line visualization methods are introduced, according to two main categories: implicit line mapping and explicit line mapping.
1.2.1 Implicit Line Implicit line mapping is used to refer to the method, with which no pre-integrated line exists, but the movement of the user intuitively follows a line. Durbeck et al. [Dur98] first engaged in highlighting flow lines with haptic display, by directly mapping vectors to forces. This method is incredibly effective and straightforward, as the stylus instinctively drags the user along the lines. The “Relative Drag” method proposed by Pao et al [Pao98] is very similar to Durbeck’s method, although the user’s velocity was also encoded into the force rendering. A few years later, Lawrence and Pao et al. [Law04] developed different implicit line mapping methods for several applications. They recreated the implicit physical phenomenon in a magnetic field, by simulating Lorentz force. In a vortex field, they r r r applied a force F = gω × vr ( g is a gain parameter, ω is local vorticity vector and defined as the curl of r velocity v ) to the stylus, and this force tended to pull the user towards the vortex core. Nonetheless it is evident that only force, owing to its navigation characteristics, can function in implicit mapping.
1.2.2 Explicit Line Several other studies investigating line visualization have been carried out on pre-generated lines, which fall within the scope of explicit line mapping. Torque, damping force [Pao98], and gravity force weighted by several lines [Rei03] have been used to constrain the user to the line. Fritz and Barner [Fritz96] designed a weighting function, which
allows a snap-to-grid force that pulls the stylus to the cylinder axis (which is the graph line) and then enables the user to move freely along the line. In addition to forces and torques, tactile sensation has also demonstrated its usability for explicit line graph display. In 2002, Roberts et al. [Rob02] published a paper, in which they turned a graph with lines into a greyscale image, and then mapped different grey-values to heights of the surface for exploration with a point. Since there was no other information in the graph besides the lines, a haptic bump-map with bumps and ridges was generated. Friction and noise texture were proposed to be added to provide additional information, of say another variable. In an attempt to make partially sighted or blind people easily explore line graphs, Yu et al. [Yu00] [Yu01] constructed V-shaped grooves on the surface to simulate the graphs with the PHANToM device. They [Yu02] also enabled automatic online haptic line construction using a Logitech WingMan Force Feedback Mouse. To avoid the confusion inflicted by having multiple lines, different frictions were applied to each of them. When line graphs become complex, they may cross each other. In this situation, the constrained force mapping, with an extra tactile feedback alarm to inform the user where the intersection points are [Rob02], would be more suitable than using an exclusive tactile display. The assistance of force and torque to line tracking are well documented, and friction, texture and other tactile sensations have also been widely applied. The effects of vibration solely to this task, however, are less well understood. Does vibration have a positive influence on line tracking task? Are there alternative ways to apply vibration to this task?
1.3 Paper Outline In this research, we will mainly discuss vibration sensation, and examine whether vibration can help the user in the line tracking task. The main areas investigated are: (1) Does vibration, as an extra information channel, assist the user in tracking the visible line? (2) Which vibration mode is more helpful, VibOnline mode (the strongest vibration on the line, and the farther the distance to the line, the weaker the vibration) or VibOffline mode (no vibration on the line, and the farther the distance from the line, the stronger the vibration)? (3) Which changing pattern of vibration is more suitable, the Linear Vibration mapping (LV) or the mapping according to the Model [Wan06] (MV)?
The model mentioned here was built to provide a magnitude mapping standard associated with both vibration frequency and amplitude parameters. Thus this paper first gives a brief introduction to the vibration magnitude model in Section 2, including the basic psychophysical experiments and the mathematical construction. Section 3 describes the line tracking experiments, with details in stimuli, design and result analysis. Finally concluding remarks are given in Section 4.
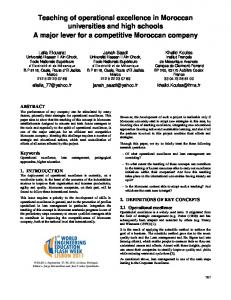
2. VIBRATION MAGNITUDE MODEL The vibration magnitude model [Wan06] provides a basic mapping criterion for haptic visualization, and enables users to extract various vibration mapping tables. A PHANToM Desktop device (Figure 1), made by SensAble Technologies Inc., was adopted in the model construction experiments. As a single pointing handheld device, it allows 6 degree of freedom (DOF) input and provides 3 DOF output.
The first one adopted the magnitude estimation method initially put forward by Stevens [Stevens75]. In the experiment, the subject perceived a series of stimuli, and assigned numbers to match their levels (e.g., intensity). We sampled 16 frequencies from 20 to 200 Hz, and set 6 different amplitudes as testing stimuli for each frequency. A total of 23 subjects took part. All the results obeyed the power law, i.e., the relationship between sensation magnitude and vibration stimuli amplitude is a power function. And therefore 16 power functions with different power exponents, respectively reflecting the relationship between sensation and amplitude for different frequencies, were obtained
2.1.2 Intramodal Matching Experiment The second experiment was an intramodal matching test, which conducted the user to answer the question such as “What amplitude of vibration at 60 Hz feels as strong as a given vibration at 120 Hz?” Thus the user adjusted the parameter of the comparison stimulus to match the standard stimulus, in order to give an appropriate reply. The vibration with 100 Hz frequency, and 0.06 and 0.1 N force amplitude were individually set as standards, and 22 subjects participated. Finally two equal intensity isolines with the frequency range from 20 to 200 Hz were acquired, which manifest the relation between sensation and frequency.
2.2 Vibration Magnitude Model With the results above, a vibration magnitude model was constructed creating a 3D surface. We first standardised all 16 power functions using two isolines, sampled 9 points on each of them, and then fitted a B-Spline surface using these 9×16 control points, shown in Figure 2. Figure 1. PHANToM Desktop Device. Vibration was produced by applying a sinusoidal vertical force along the y-axis, updating at 1K Hz. As a result of the device limitation, the maximum frequency for the test was set as 200 Hz. During the following experiments, the participants were asked to hold the haptic stylus like a pen, and position the probe at the centre of the haptic scene.
2.1 Vibration Experiments This vibration magnitude model was built upon two psychophysical experiments: magnitude estimation and intramodal matching experiments.
2.1.1 Magnitude Estimation Experiment
Figure 2. Vibration Magnitude Model.
Based upon this model surface, we can tabulate any number of points, pick out certain points with consideration of their magnitudes, and create a vibration look-up mapping table. This model laid out the foundation for the vibration mapping in the following line tracking experiment. Figure 2 shows that the model has the lowest valley in the frequency range roughly from 70 Hz to 120 Hz (the valley frequency changes as the amplitude changes). Thus in line tracking, we did not extract the mapping table from the whole frequency range of the model, but specified the frequency varying between 80 and 200 Hz and amplitude increasing from 0.06 to 0.18 N. The reasons and details about the vibration mapping table are given in the next section.
3.2 Stimuli There were four lines in total. And each of them was 2.0 mm wide, 350 mm long, and contained three different rectangular grooves, which can be upward or downward. The two of them were the upsidedown replicas of the other two. Thus the two lines respectively had two narrow grooves (20 mm width) and one wide groove (40 mm width), while each of others had one narrow groove and two wide grooves. Figure 4 gives an illustration of a trial line’s pattern.
3. LINE TRACKING EXPERIMENT In this section, we investigate vibration in the line tracking experiment, therefore only vibration was employed as the haptic guidance.
3.1 Design The study used the PHANToM Desktop device and a 19-inch display monitor with a resolution of 1280× 1024 , respectively for haptic and graphic display. The virtual environment was constructed using the GHOST SDK [Gho06] and the embedded OpenGL package, haptically updated at 1000 Hz and graphically at a rate of 67 frames per second. In the experiment, a 2D line was placed on a vertical background surface. The space close to the line was partitioned into eight-level vibration areas (Figure 3), where vibration changed discretely depending on the distance to the line. The experiment task for the participant was to track the trial line according to the perceived vibration hint and/or visual feedback.
Figure 4. A Trial Line in the Line Tracking Experiment. The vibration varied according to the distance using different mapping methods (LV or MV). Table 1 shows the eight-level stimuli of VibOffline mode for LV and MV. The mappings in the reverse order were used for VibOnline mode. With the consideration of the vibration magnitude model, the frequency range here was chosen from 200 to 80 Hz, which promised the comparatively monotonic sensation variation for even LV mapping. Leve l
Figure 3. The Eight-level Areas around the Line. The experiment had a 2 × 4 within-subjects factorial design. The factors were vibration mode (VibOnline or VibOffline), and type of tracking guidance (Linear mapping Vibration (LV), Model mapping Vibration (MV), Vision only (V), Vision + Model mapping Vibration (V+MV)). How VibOnline and VibOffline modes functioned is explained in Section 1.3.
Distance from line (mm)
LV
MV
Fre (Hz)
Amp (N)
Fre (HZ)
Amp (N)
200
0.0
200
0.0
0
0 ≤ d < 1 .5
1
1 .5 ≤ d < 3
200
0.06
200
0.06
2
3 ≤ d < 4 .5
180
0.08
186.5
0.074
3
4.5 ≤ d < 6
160
0.1
173
0.091
4
6 ≤ d < 7 .5
140
0.12
155
0.091
5
7 .5 ≤ d < 9
120
0.14
137
0.115
100
0.16
114.5
0.165
80
0.18
80
0.18
6 7
9 ≤ d < 10.5
10.5 ≤ d
Table 1. Vibration Offline Levels Table for the Linear and Model Maps
3.3 Procedure Four female and five male subjects, aged between 22 and 35, took part. To start a trial, the participant positioned the cursor (represented by a blue cone) in contact with the left sphere, and pressed the button on the stylus. Then he moved the cursor to track the line through vibration, or vision, or both, until reaching the right sphere. At this time, the participant pressed the button again, and the trial was ended. Each participant completed two practice trials and then 16 test trials. VibOnline and VibOffline modes were mixed during the experiment, but each of them was always applied into two trials in a row, the next two trials adopted the other mode. Except for this limitation, all the trials were presented at random. Participants were explicitly informed which vibration mode (VibOnline, VibOffline) would be used and whether vision would be provided. After each trial, the participant was asked to rate on a seven-level scale how difficult they thought the particular trial was. When all the trials were finished, they were required to answer the last question: “which vibration mode is more comfortable for completing the task? The options are: vibration Online, vibration Offline or both the same.”
3.4 Results During each trial of the experiment, we recorded the total movement time, the percentage of the time (time percent) spent in each level area, and the number of entries (entry number) into each level area (except for 0-level) once moving from the lower level area to the current level one. The latter two items describe the accuracy and error rate during the subject tried to complete the task. To comprehensively assess influences various factors exerted on the task, the comparisons were made from the four aspects:
Figure 5. The Three-level Regions around the Line. And actually for each comparison, we differently analysed the results collected in areas or regions.
3.4.1 All Factor Comparison The mean values of total time under the various modes and tracking guidance conditions are shown in Figure 6. As expected, tracking guidance performs a considerable influence on the total time results ( F3, 24 = 51.992 , p < 0.01), since the vision-based guidance leads to much shorter movement time than the vision-excluded one. Moreover, from the data in Figure 6, under the guidance of only vibration, the model mapping mode aids in accomplishing the task a bit faster than the linear mapping mode does. However unexpectedly, vibration, as an extra guidance hint, fails to speed up tracking the visible lines, but slightly prolongs it instead. More details about these are given in other factor comparisons.
(1) All factor comparison (LV, MV, V, & V+MV; VibOnline & VibOffline) (2) Vision-excluded factor comparison (LV & MV ; VibOnline & VibOffline) (3) Vision-based factor comparison (V & V+MV) (4) Vision-vibration-based factor comparison (VibOnline & VibOffline)
Figure 6. Mean Values of Total Time.
Through the initial observation on the data, we found Areas 0, 1 and 2 were predominantly involved, under vision-based guidance, thus we set the following three regions for further investigation (Figure 5). (1) Accurate region 0: includes Areas 0, 1 and 2
In this comparison, we used the region standard to analyse the result. The movement time percent in each region under different guidance conditions are quite different (see Figure 7). A repeated measure ANOVA confirms this, yielding a significant effect for each region (Region 0: F3, 24 = 48.947 , p < 0.01 ;
(2) Close region 1: includes Areas 3, 4 and 5
Region 1:
(3) Deviation region 2: Areas 6 and 7
F3, 24 = 9.9144 , p < 0.01 ). The results under the
F3, 24 = 74.133 , p < 0.01 ; Region 2:
vision-based guidances are dominantly located in Region 0, while those under the vision-excluded guidances are relatively averagely but decreasingly distributed across Regions 0, 1 to 2. This distinction indicates that vision predominates over haptic vibration. However the online or offline mode does not show a significant effect on performance.
Figure 7. Time Percent Mean Values Spent in Regions 0, 1 and 2. The entry number means in Figure 8 similarly reinforce that vision is an advantage over vibration (Region 0: F3, 24 = 53.61 , p < 0.01 ; Region 1: F3, 24 = 42.70 , p < 0.01 ; Region 2: F3, 24 = 11.51 , p < 0.01 ). In addition, we found that VibOffline mode showed the better performance than VibOnline mode. However since vision only guidance does not take into account vibration, the ANOVA result here may underestimate the effect of Online/Offline. Therefore under the following comparisons, we make a thorough analysis of these modes and conditions.
and this indicates the model mapping’s superiority over linear mapping. However their difference is not significant, probably stemming from the intentionally chosen limited vibration range (80—200 Hz rather than 20—200 Hz). Figure 6 also shows that VibOnline results in faster movement than Vib-Offline. The most likely cause of this distinction is that with the VibOffline mode the subject tried to seek the perfect position without vibration at all, and with the VibOnline mode the subject tended to go along with the hint of a strong vibration. The subconscious perfection seeking under the VibOffline mode, therefore, appears to make it a longer task, although no statistical significance is associated with. The vibration-excluded factor comparison analysed the results collected from regions. VibOffline mode spent a higher time percentage in the accurate region 0, and the lower percent in the other two regions than VibOnline mode (Figure 7). The VibOffline mode’s accuracy advantage over the VibOnline mode has been statistically manifested by the entry number results (Region 0: F1,8 = 10.583, p < 0.025 ). The VibOffline mode proceeded more accurately.
3.4.3 Vision-based Factor Comparison Comparing the data in Figure 6, we can see that any extra vibration condition has the minimal impact on the results of visible line tracking, owing to the preponderance of vision over haptic vibration. However we surprisingly found that vibration protracted the tracking task, instead of shortening the movement time like force did.
Figure 10. Time Percent Mean Values Spent in Areas 0, 1 and 2. Figure 8. Entry Number Mean Values in Regions 0, 1 and 2.
3.4.2 Vision-excluded Factor Comparison Referring to Figure 6, as mentioned before, we can see that ModelVib takes shorter time than LinearVib,
Due to the precise results from vision-based modes, we only compare the results in Areas 0, 1 and 2. Data from Figure 10 reveal that the time percents under V and V+MV guidances in each area are fairly similar, no evident pattern existing, and a repeated measures of ANOVA confirms this. However, referring to
Figure 7, we can see that to the extent of regions, vibration slightly but uniformly augments the percentage of time spent in accurate region, and diminishes the time ratio in the far regions. Thus although vision plus vibration guidance is more time consuming, this multimodal interaction improves the task accuracy, regardless of an absence of significant difference between V and V+MV modes. On the other hand, the entry number result shows some interesting difference (Figure 11). Vibration, as an additional guidance hint, unexpectedly increases the error rate during tracking visible lines (Area 1: F1,8 = 5.53 , p < 0.05 ; Area 2: F1,8 = 11.29, p < 0.05 ). This possibly results from the participant’s subconsciousness of exploring different vibrations under V+MV Online mode and reconfirming whether he is in the accurate area under V+MV Offline mode. However in the far regions, the entry number results under V and V+MV guidances are roughly identifical (see Figure 8).
multimodal line tracking, and even to convey other parameter of line (such as magnitude on streamline) with vibration. 2. In contrast to the VibOnline mode, the VibOffline mode does give rise to more accurate results, no matter whether under vision-excluded guidance or in multimodal interaction. This is consistent with the questionnaire result that 7 out of 9 subjects chose that “VibOffline mode is more comfortable”. Nonetheless it is of great interest to further investigate this issue, especially when the pattern of the line becomes complex, or when the number of the lines increases. Furthermore, although VibOnline mode is not the better way to track line, it is more practically extendable, such as mapping other variable of the line to vibration. However the inferiority of VibOnline mode does give us a potential warning in this extension. 3. In certain cases, the linear mapping of vibration with the appropriate range has similar usability when compared with the model mapping. Regardless of this, the vibration magnitude model will exhibit its superiority if the ranges of both frequency and amplitude are extended. Therefore the vibration mapping based on the magnitude model is strongly recommended.
4. CONCLUSIONS AND FURTURE WORK
Figure 11. Entry Number Mean Values Spent in Areas 1 and 2.
3.4.4 V+VibOnline & V+VibOffline Factor Comparison ANOVA outcomes reveal that the total time results under these two modes make no difference, and no significant distinction existed in time percent either. However Offline mode does have an advantage over Online mode (Area 1: F1,16 = 4.9815 , p < 0.05 ).
3.4.4 Comparison Summary All the comparisons evaluating the vibration-aided line tracking can be summarised from three aspects: 1. Line tracking under the vision only guidance is definitely superior to that exclusively in aid of vibration. However in the multimodal tracking task, vibration, as an extra feature, magnifies some amount of time percentage in the accurate region, This proves the possibility to apply vibration in
This paper aims to examine how to effectively apply vibration in one specific visualization task, line tracking. Based upon the fundamental vibration magnitude model, vibration has been applied in different ways. The implementation of this experiment accumulates the practical experience for our motivation. How to employ vibration in more complicated applications to facilitate the user interaction will be an important direction of the future research. During the experiment, the participants reported some kind of jump or jerk occurred occasionally. This phenomenon is most likely caused by the sudden change of the vibration, and the solution to this problem will be interpolation. Even though we have not addressed this issue in detail here, it is necessary to reasonably implement interpolation to smooth data gaps within real applications.
5. ACKNOWLEDGMENTS The authors would like to thank the colleagues to volunteer themselves to take part in the experiments, and also appreciate James Perrin for his technical support. One of us, Yuan Wang, acknowledges the financial support of the University.
6. REFERENCES [Avi96] Avila R.S. and Sobierajski L.M. A Haptic Interaction Method for Volume Visualization. In Proceedings of the 7th Conference on Visualization ’96, San Francisco, CA, USA, IEEE CS Press, pp.197-204, 1996. [Bro90] Brooks J.F.P, Ouh-Young M., Batter J.J. and Kilpatrick P.J. Project GROPE – Haptic Displays for Scientific Visualization. In Proceedings of the 17th Annual Conference on Computer Graphics and Interactive Techniques, Dallas, TX, USA, ACM Press, pp.177-185, 1990. [Dur98] Durbeck L.J.K., Macias N.J., Weinstein D.M., Johnson C.R. and Hollerbach J.M., SCIRun Haptic Display for Scientific Visualization. In Proceedings of the 3rd Phantom Users Group Workshop (PUG 98), Cambridge, MA, USA, October, 1998. [Fri96] Fritz J.P. and Barner K.E. Design of a Haptic Graphing System, In Proceedings of the 19th Rehabilitation Engineering & Assistive Technology Society of North America Conference, Salt Lake City, UT, USA, pp. 158160, June, 1996. [Gho06] GHOST SDK Software document, at http://www.3dtouch.net/products/phantom_ghost/ ghost.asp [Iwa93] Iwata H. and Noma H. Volume Haptization. In Proceedings of IEEE Virtual Reality Annual International Symposium, Seattle, WA, USA, pp.16-23, September 1993. [Law00] Lawrence D.A., Lee C.D. and Pao L.Y. Shock and Vortex Visualization Using a Combined Visual/Haptic Interface. In Proceedings of IEEE Conference on Visualization and Computer Graphics, Salt Lake City, UT, USA, pp. 131-137, October 2000. [Law04] Lawrence D.A., Pao L.Y., Lee C.D. and Novoselov R.Y. Synergistic Visual/Haptic Rendering Modes for Scientific Visualization. IEEE Computer Graphics and Applications, No.24, pp. 22-30, November/December 2004. [Pao98] Pao L.Y. and Lawrence D.A. Synergistic Visual/Haptic Computer Interfaces. In Proceedings of Japan/USA/Vietnam Workshop
on Research and Education in Systems, Computation, and Control Engineering, Hanoi, Vietnam, pp. 155-162, May 1998. [Rei03] Van Reimersdahl T., Bley F, Kuhlen T. and Bischof C.H. Haptic Rendering Techniques for the Interactive Exploration of CFD Datasets in Virtual Environments. Proceedings of the 7th International Immersive Projection Technologies Workshop and the 9th Eurographics Workshop on Virtual Environments, pp. 241-246, Zurich, Switzerland, May, 2003. [Rob02] Roberts J.C., Franklin K. and Cullinane J. Virtual Haptic Exploratory Visualization of Line Graphs and Charts. In Proceedings of the Engineering Reality of Virtual Reality, pp. 401410, January 2002. [Rob05] Roberts J.C. and Franklin K. Haptic Glyphs (Hlyphs) – Structured Haptic Objects for Haptic Visualization. In Proceedings of WorldHaptics – the 1st Joint EuroHaptics Conference and Symposium on Haptic Interfaces for Virtual Environment and Teleoperator Systems, IEEE CS Press, Pisa, Italy, pp. 369-374, March 2005. [Yu00] Yu W., Ramloll R. and Brewster S. Haptic Graphs for Blind Computer Users. In 1st International Workshop on Haptic HumanComputer Interaction, pp. 102-107, Glasgow, UK, 2000. [Yu01] Yu W., Ramloll R., Brewster S. and Riedel B. Exploring Computer-Generated Line Graphs Through Virtual Touch. In Proceedings of International Symposium on Signal Processing and its Applications (ISSPA), IEEE CS Press, pp. 72-75, Kuala Lumpur, Malaysia, pp. 13-16 August, 2001. [Yu02] Yu W., Cheung K. and Brewster S. Automatic Online Haptic Graph Construction. In Proceedings of EuroHaptics, Edinburgh, UK, pp. 128-133, July, 2002. [Wan06] Wang Y., Turner M.J. and Hewitt W.T. A Haptic Visualization Mapping Model – Magnitude Model of Sinusoidal Vibration. In Proceedings of EuroHaptics, Paris, France, pp. 345-350, July 2006.