A l'échelle de la parcelle deux méthodes peuvent être considérées: ... in kg m-2. From applicative point of view, it is worthwhile to mention another important ...
WUE estimation by using direct and indirect modelling of water losses of sugar beet cropped in a semi-arid environment Ferrara R.M., Introna M., Martinelli N., Rana G. in Santini A. (ed.), Lamaddalena N. (ed.), Severino G. (ed.), Palladino M. (ed.). Irrigation in Mediterranean agriculture: challenges and innovation for the next decades Bari : CIHEAM Options Méditerranéennes : Série A. Séminaires Méditerranéens; n. 84 2008 pages 143-150
Article available on lin e / Article dispon ible en lign e à l’adresse : -------------------------------------------------------------------------------------------------------------------------------------------------------------------------http://om.ciheam.org/article.php?IDPDF=800960 -------------------------------------------------------------------------------------------------------------------------------------------------------------------------To cite th is article / Pou r citer cet article -------------------------------------------------------------------------------------------------------------------------------------------------------------------------Ferrara R.M., Introna M., Martinelli N., Rana G. WUE estimation by u sin g direct an d in direct modellin g of water losses of su gar beet cropped in a semi-arid en viron men t. In : Santini A. (ed.), Lamaddalena N. (ed.), Severino G. (ed.), Palladino M. (ed.). Irrigation in Mediterranean agriculture: challenges and innovation for the next decades. Bari : CIHEAM, 2008. p. 143-150 (Options Méditerranéennes : Série A. Séminaires Méditerranéens; n. 84) --------------------------------------------------------------------------------------------------------------------------------------------------------------------------
http://www.ciheam.org/ http://om.ciheam.org/
WUE estimation by using direct and indirect modelling of water losses of sugar beet cropped in a semi-arid environment R.M. Ferrara, M. Introna, N. Martinelli, G. Rana CRA - Research Unit for agriculture in dry environments, Bari, Italy
Abstract. Many expressions of water use eficiency (WUE) have been proposed in literature, but the most diffuse one is based on the ratio between crop yield and cumulative actual evapotranspiration (ETa). A big error can be made if the water consuming is badly evaluated. The best way to give the ETa is to measure it, but often it is estimated. At plot scale, there are two different methods for estimating ETa: the direct and the indirect method, both based on the Penman-Monteith model. In order to evaluate the errors made on WUE due to the ETa modelling, in this work we evaluate the water use eficiencies in the growth period when LAI is greater or equal to 2. Three methods of ETa estimation is used (direct, single Kc, dual Kc) for a sugar beet crop cultivated in Capitanata Plain (southern Italy) during two experimental ield campaigns. The actual evapotranspiration has been measured directly by eddy covariance or by aerodynamic method. All the measurements have been done at hourly scale, but the estimation are presented at daily and seasonal scales. The results show that for WUE indicators, the direct method of ETa calculation gave better performances with respect to the indirect ones, with worst results for the single crop coeficient approach. Keywords. Actual evapotranspiration – Penman-Monteith – Crop coeficient.
Estimation de l’eficience d’utilisation de l’eau (WUE) par modélisation directe et indirecte des pertes d’eau de la betterave sucrière cultivée en région semi aride. Résumé. Plusieurs expressions de l’eficience d’utilisation de l’eau (WUE) sont disponibles dans la littérature scientiique, mais la plus diffuse est celle basée sur le rapport entre la production d’une culture et l’evapotranspiration réelle cumulée (ETa). Une grossse erreur peut être commise si la consommation en eau d’une culture n’est pas bien déterminée. La façon la plus correcte pour déterminer la WUE est de la mesurer, mais en tout cas elle peut être estimée. A l’échelle de la parcelle deux méthodes peuvent être considérées: l’une directe et l’autre indirecte ; toutes les deux sont basées sur le modèle de Penman-Monteith. Pour évaluer l’erreur sur la WUE provoquée par la modélisation de l’ETa, nous calculons dans cet article l’eficience d’utilisation de l’eau dans la période de croissance d’une culture, quand l’indice foliaire (LAI) est égal ou plus grand de 2. Trois méthodes d’estimation de l’ETa sont analysées (directe, single Kc et dual Kc) pour une culture de betterave à sucre, cultivée en Capitanata (Italie du sud), pendant deux campagnes expérimentales. L’evapotranspiration réelle a été mesurée par deux techniques: eddy covariance et technique aérodynamique. Les mesures ont été faites à l’échelle horaire, tandis que les estimations sont présentées à l’échelle journalière et saisonnière. Les résultats montrent que quand l’ETa est calculée par la méthode directe, les indicateurs de WUE donnent des valeurs beaucoup plus iables de celles obtenues en utilisant les méthodes indirectes, surtout pour l’approche du Kc single. Mots-clés. Evapotranspiration réelle – Penman-Monteith – Coeficient cultural.
I–
Introduction
Since the irst studies, different expressions (water use eficiency, crop water productivity) have been proposed and discussed (among others, Feddes, 1985; Pereira et al., 2002; Zwart and Bastiaanssen, 2004). In general, water use eficiency (WUE) can be written as following: WUE (kg m-3) = yield / water consumption
Options Méditerranéennes, A n° 84, 2008 - Irrigation in Mediterranean Agriculture: challenges and innovation for the next decades
(1)
In Eq. (1), if an agronomic approach is chosen (Katerji et al., 2008), the term “yield”, can indicate two parameters: i) Global dry matter yield expressed in kg m-2; ii) Marketable crop yield expressed in kg m-2. From applicative point of view, it is worthwhile to mention another important index to estimate the path of water productivity in time, given in term of the dry or fresh biomass per water consuming by evapotranspiration (WUEb), evaluated during the whole growing season: WUEb (kg m-3) = biomass / water consumption
(2)
Regarding the water consuming, from the water used by crops during the growing season, 99% is released as water vapour toward the atmosphere. For this reason crop water use is considered approximately equal to actual evapotranspiration (ETa) in mm or in m3. This approximation, discussed by Feddes in 1985 is valid only at full crop canopy, thus when leaf area value is over 2 (Katerji and Perrier, 1985). Above this leaf area value, ETa is nearly similar to crop water use, because evaporation is very low even when soil surface is wet (Ritchie, 1983). On plot scale, ETa can be determined through different approaches; in particular, ETa can be measured directly using weighing or drainage lysimeters or can be measured indirectly through micro-metrological methods (Bowen, aerodynamic). These methods result as the most precise to determine ETa. However, in order to use these methods, precautions are necessary, mainly in the Mediterranean region (Katerji and Rana, 2008). Moreover, ETa can be measured through the calculation of soil water balance. This approach is however based on some hypothesis (the capillary rise, runoff and deep percolation are supposed insigniicant, rainfall are all eficient). However, some hypotheses are not valid mainly under Mediterranean climatic conditions (Katerji and Rana, 2008). By model, ETa can be calculated according to many methods developed in the past decades by different authors (see Katerji and Rana, 2008 for an exhaustive review of the ET models). Finally, in many studies ETa is not measured, but it is replaced in the Eqs. (1) and (2) by the amount of water supplied by irrigation. The overestimation of water necessary for crops is one of the characteristics of irrigation practice in the Mediterranean region, and this makes dificult the understanding of the obtained WUE values (e.g. Shideed et al., 2005). From the applicative point of view, at plot scale, almost in all the scientiic works, ETa in WUE and WUEb is deduced by models. Generally speaking, there are two different methods for estimating ETa: the direct and the indirect methods, both based on the Penman-Monteith model. In particular, in the direct approach the measurements of meteorological variables must be done on the crop, while in the indirect one it is enough to measure the meteorological variables on a reference grass (to obtain the reference evapotranspiration, ET0) and to estimate ETa as product of ET0 and a crop coeficient Kc. This latter can be calculated by means of two approaches: the single and the dual crop coeficient approaches. Considering that an acceptable error of ±20% can be admitted in both numerator and denominator of Eqs. (1) and (2), than a total error of ±40% can be made in the evaluation of WUE of a crop with consequent misestimating of irrigation scheduling and programming. For the reasons above described, in this work ETa is evaluated only when LAI≥2. Thus, here we evaluate the water use eficiency when LAI≥2 (WUE2 and the WUE2b) using the above mentioned methods of ETa estimation (direct, single Kc, dual Kc) for a sugar beet crop cultivated in Capitanata Plain, in order to give indications about the best way to evaluate WUE at plot scale. The site is submitted to Mediterranean semi-arid climate.
144
Options Méditerranéennes A 84
II – Material and methods 1. Theory The analysis of the crop actual evapotranspiration was made on the basis of the Penman-Monteith (PM) model. In this model, which is theoretically applicable only to the hourly time scale (index “h”), the ETa is written as: ETa ,h =
1 ∆A + ρc p D ra λ ∆ + γ (1 + rc ra )
(3)
where A=Rn-G is the available energy (W m-2), is the air density (kg m-3), ∆ is the slope of the saturation pressure deicit versus temperature function (kPa C-1), is the psychrometric constant (kPa C-1), cp is the speciic heat of moist air (J kg-1 C-1), D the vapour pressure deicit of the air (kPa), rc is the bulk canopy resistance (s m-1) and ra is the aerodynamic resistance (s m-1), is the latent heat of evaporation (J kg-1). The aerodynamic resistance ra was calculated between the top of the crop and a reference point z located in the boundary layer above the canopy, following Perrier (1975a; 1975b), as: ln ra =
z−d z−d ln z0 hc − d
(4)
k 2u
where u (m s-1) is the wind speed measured 2 m above the crop; d (m) is the zero plane displacement estimated as d=0.67hc, with hc mean height of the crop (m); k is the von Kármán constant and z0 (m) is the roughness length estimated as z0=0.1hc.
2. The direct method at hourly and daily scale For calculating ETa in the Eq. (3), the canopy resistance rc has to be previously determined. In the present work, the hourly variation of rc is simulated starting from a relationship taking into account the associated effects of solar radiation, air vapour pressure deicit and wind speed. Katerji and Perrier (1983) proposed to simulate the resistance rc by the following relation: c
ra
=a
r* +b ra
(5)
where a and b are empirical calibration coeficients which require experimental determination. r* (s m-1) is given as: r* =
∆ + γ ρc p D ∆γ A
(6)
This resistance r* can be considered as a “climatic” resistance, because it depends only on weather variables. Moreover, r* represents a “critical” value for the evaporative process, because it is a threshold between the situation, rc< r*, for which ETa increases with increasing wind speed, and the situation, rc> r*, in which ETa decreases with wind speed. This model has been used to calculate ETa for different species (alfalfa, rice, grass, lettuce, sweet sorghum, sunlower, grain sorghum, soybean, clementine orchard, sloping grassland) as reported by Katerji and Rana (2006). It has also been adapted to soil water stress conditions, but this subject will not be discussed here.
Irrigation in Mediterranean Agriculture: challenges and innovation for the next decades
145
The daily values of ETa were calculated, considering in this direct method (index “d”) the sum of hourly values in the time interval between 8 a.m. and 6 p.m.: 18
ETa ,d =
∑ ET
a
(7)
h =8
3. The indirect method From the application point of view, the calculation of the crop ETa is usually made by the formulation of Allen et al. (1998). Actually, this method refers to the maximum evapotranspiration, i.e. when the crop is in well watered conditions, which is the present case. The same methodology has been used by many other authors (i.a. Katerji and Rana, 2006; Testi et al., 2004; Amayreh and Al-Abed, 2005). It is an indirect calculation (index “i”), in fact ETa is determined by the following relationship:
ETa ,i = K c ET0
(8)
In this formulation, ET0 is the reference evapotranspiration and Kc is the crop coeficient. The recent FAO no. 56 paper (Allen et al., 1998) well deined the concept of ET0 and adopted the Penman-Monteith equation adapted to a grass crop. Anyway, the authors simpliied the procedure to calculate the resistance rc for the grass. In fact, this was considered constant in all climatic conditions and takes a ixed value in the Penman-Monteith formula. The formula used for the daily values of ET0 in this work is (all the details in Allen et al., 1998): 900 uD T + 273 ∆ + γ (1 + 0.34u )
0.408∆A + γ ET0 =
(9)
The accuracy of the ETa values determined by the Eq. (8) depends on two factors. Firstly, it depends on the accuracy of the determination of ET0 as carried out by the users in different geographical sites; then, on the accuracy of the Kc values used in Eq. (8). These values were given by Allen et al. (1998) for three stages of crop growth cycle (initial, middle and end) for the main cultivated crops. The hypothesis of a constant resistance rc in the determination of ET0 for the grass could be a possible source of error. However, some studies showed that this hypothesis gave acceptable estimation of ET0 in different regions of the world (Smith et al., 1991; Allen et al., 1994a, 1994b). Other studies, mainly carried out in semi-arid and arid regions, showed opposite results: the previously mentioned hypothesis underestimated the values of ET0 as measured by lysimeters, except for a few cases (see the results obtained by Steduto et al., 1996 in Morocco). The underestimation ranged between 2 and 18% (see Katerji and Rana, 2006 for details). Anyway, since the experimental error of the direct measurement of ET0 by the lysimeter is about 15% (Rana and Katerji, 2000), the performance of this method seems to be reasonable. Therefore, the approach proposed by Smith et al., (1991) and Allen et al., (1998) merits the attention of researchers. The second source of possible error concerns the values of Kc, as indicated by Allen et al., (1998). Actually, these values showed more or less important differences with respect to the experimentally determined values of the relationship ETa/ET0. Actually, many papers can be found on this subject in the scientiic literature. Also if we consider only the more recent literature, it is possible to ind differences of ±40% between the Kc values reported by Allen et al., (1998) and the values experimentally obtained, especially during the middle growth cycle (see Katerji and Rana, 2006; 2008). These big differences are mainly due to the complexity of the coeficient Kc, which actually integrates several functions (Testi et al., 2004): aerodynamic factors linked to the height
146
Options Méditerranéennes A 84
of the crop, biological factors linked to the growth and senescence of the surface leaves, physical factors linked to the evaporation from the soil, physiological factors linked to the response of the stomata to the vapour pressure deicit of the air and agronomical factors linked to the crop management (distance between rows, using mulch, irrigation system, etc.). For this reason, Allen et al., (1998) recommended that the evaluation of Kc values in local climatic conditions by observed data using lysimeters is necessary. Nevertheless, the simple local determination of Kc is not enough if general values of Kc are required. Therefore, it is necessary to search for the relationships between Kc and more or less complex parameters, such as the surface area of the leaves, the humidity of the soil surface and the 3D energy balance (Testi et al., 2004 among many others). This last approach was called “dual Kc” in the FAO56 book. In this case the actual evapotranspiration is called ETa,i-dual.
4. Site, crop and measurements This study was carried out at a site of Southern Italy (Capitanata plain) in 2006 and 2007 during two experimental ield campaigns planned for the Italian project AQUATER. The data here presented were acquired in two private farms (“Forte” during 2006 and “De Lucretis” during 2007), on a very large ield (5 hectares) of sugar beet (Beta vulgaris L.) maintained in well watered conditions; the irrigation was supplied by the “Consorzio di Boniica della Capitanata (Foggia)”, by aspersion method, following the local usage tending to maximize yield. The climate is semi-arid Mediterranean. The actual evapotranspiration of the crop was measured by the eddy covariance method (EC) (Kaimal e Finnigan, 1994). A three-dimensional sonic anemometer (USA-1, Metek, Germany) was used in these experiments, coupled with an open-path sensor for the fast acquisition of water vapour concentration (LI-7500, Li-Cor, USA). The sensors were connected to an industrial computer and acquired by software (MeteoFlux, Servizi Territorio S.r.l., Cinisello B. (Mi), Italy). In case of failure of the EC technique, the aerodynamic method (Katerji and Rana, 2008) is used for illing the gaps. In this last case wind speed and air temperature at three levels above the crop were measured by commercial sensors after accurate calibration in laboratory. The agrometeorological variables used for the calculation of ETa were measured directly above the crop, by means of standard commercial meteorological sensors, including net radiometers and soil heat lux plates. The same kinds of sensors were used to measure the meteorological variables for calculating ET0 by the indirect method: in this case the sensors were placed above a reference grass in an agrometeorological station a few kilometers far from the experimental ield. For the micrometeorological measurement of variables and luxes the fetch in the directions was large enough for being well below the adjusted internal crop boundary layer. The FAO56 tomato Kc was used in this study (1.15 in the mid- season stage).
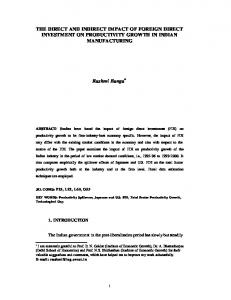
III – Results and discussion The calibration of the model, i.e. the calculation of the coeficients a and b in the Eq. (5) must be made by comparing the ratio rc/ra, with rc deduced by the Eq. (3) once the ETa is measured in the ield above the crop, and the ratio r*/ra, with all the variables measured directly above the crop. The result of the calibration (Fig. 1) for the sugar beet has been made by using the data acquired in 2006 and, of course, they were not used for the validation of the model.
Irrigation in Mediterranean Agriculture: challenges and innovation for the next decades
147
25 y = 0.45x + 4.49 R 2 = 0.551
rc/ra
20 15 10 5 0 0
5
10
15
20
25
30
35
r */r a
Figure 1. Calibration of the direct model (see text Eq. (5)) for sugar beet using the data acquired in 2006, directly above the crop.
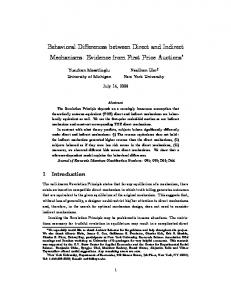
In order to evaluate the performances of the three presented model of ETa (ETa,d direct; ETa,i indirect and ETa,i-dual indirect with dual Kc), irstly we compare the daily evapotranspiration values calculated with evapotranspiration measured by eddy covariance method. In Figure 2, the comparison between ETa,d and evapotranspiration measured are presented at daily scale, using the data acquired in 2007. In this igure, 58 daily values of ETa are reported, these data are relative to the whole crop growth season. The performance of the other two methods are reported in Table 1, by showing the values of the slope and intercept of the linear regression between ETa measured and calculated together with the determination coeficient (r2) and the standard error (STDE). From this table can be argued that the direct model had the best performances, both during 2006 and 2007; in fact, this method is accurate having a slope close to 1 and intercept negligible with a regression coeficient very high. Vice versa, the other two methods had bad performances, with high values of the intercept and low r2. The method based on the dual Kc approach presented better results in both years.
7
y = 1 .0 5 x 2
6
R = 0 .8 4
ET a,d
5
4
3
2
1
0 0
1
2
3
4
5
6
7
ET m e as u r e d
Figure 2. Comparison between daily values of ETa modelled by the direct method and ETa directly measured in the ield by eddy covariance or aerodynamic method on sugar beet during 2007, when LAI≥2.
148
Options Méditerranéennes A 84
Table 1 Statistics of the performances of the ETa presented model, calculated by the regression between measured and modelled values for the two years of experiment on sugar beet (STDE is the standard error; ETa,d is evapotranspiration calculated by direct method, ETa,i is evapotranspiration calculated by indirect method, ETa,i-dual is evapotranspiration calculated by indirect method with dual Kc). Year 2006
Model ETa,d ETa,i ETa,i-dual ETa,d ETa,i ETa,i-dual
2007
slope 1.06 0.98 0.99 1.05 0.94 0.99
r2 0.86 0.75 0.74 0.84 0.74 0.79
intercept 0.1 1.9 1.2 0 2.2 1.8
STDE 0.57 0.72 0.71 0.58 0.89 0.81
In Table 2 the values of the WUE in all the analysed cases is presented for the crop growth season when the sugar beet had a value of LAI≥2. In particular we presented the WUEs (both with yield and fresh biomass as numerator) obtained when ETa is i) measured, ii) calculated by direct method, iii) calculated by indirect method with single Kc, iv) calculated by indirect method with dual Kc. From this table it is clear that the values of WUEs closest to that obtained with measured evapotranspiration are those obtained when ETa is calculated by the direct method. In all other cases, the WUEs are underestimated from -12.9% to -19.5%. Since the two WUEs had different values for the two years of the experiments, an attempt of normalising them, dividing by the water vapour deicit, has been carried out in order to establish a suitable univocal relationship between the crop production and the water losses. The results of this normalization gave ambiguous not clear results, maybe due to the particular structure of this crop (big roots and small epigeous parts), thus they are not presented here. Another comment can be made about the underestimation of ETa with indirect models: this is linked to Kc values used for the estimation, which is lower than the one obtained with local calibration (data not shown).
Table 2. Summary of the WUE (Eqs. (1) and (2) in the text) calculated in the growth season when LAI≥2 up to the harvest of sugar beet (i.e. between 13 April and 28 June 2006; between 1 April and 14 April 2007). Var. is the variation in percentage of the WUE calculated with the cumulated evapotranspiration following the three methods described in the text: ETa,d direct method, ETa,i indirect method, ETa,i-dual indirect method with dual Kc. Year 2006 2007
Indicator
ETmeasured
ETa,d
WUE2 WUE2b WUE2 WUE2b
19.7 33.1 15.1 19.8
19.1 32.0 14.5 19.0
Var. -3.2% -3.9%
ETa,i 16.2 27.2 12.5 15.9
Var. -17.7% -19.5%
ETa,i-dual 17.2 28.8 12.5 16.4
Var. -12.9% -17.2%
IV – Conclusions In semi-arid environments the ETa evaluation poses big problems (Katerji and Rana, 2008) that can be relected in the evaluation of WUE at plot scale. In this work, we analysed the performances of three methods to calculate ETa by using data acquired directly in the ield (ETa direct model) and data acquired in a reference grass (indirect single Kc and indirect dual Kc models) by using the Kc approach as tabulated in the Allen et al (1998) FAO56 book for sugar beet. The results showed that a very small error is found in the calculation of WUEs (both when marketable yield and fresh biomass is used) when the direct ETa model is used. The other two ETa models produced big (around 15-20%) errors in the quantiication of WUE.
Irrigation in Mediterranean Agriculture: challenges and innovation for the next decades
149
Acknowledgements This work was supported by the Italian Ministry of Agriculture, Food and Forestry Policies (AQUATER project, contract nr. 209/7303/05).
References Allen, R.G., Smith, M., Perrier, A., Pereira, L.S., 1994a. An update for the deinition of reference evapotranspiration. ICID Bull, 43, 2. pp. 1-34. Allen, R.G., Smith, M., Pereira, L.S., Perrier, A., 1994b. An update for the deinition of reference evapotranspiration. ICID Bull, 43, 2. pp. 35-92. Allen, R.G., Pereira, L.S., Raes, D., Smith, M., 1998. Crop evapotranspiration. Guidelines for computing crop water requirements. Rome: FAO. 300 pp. (Irrigation and drainage paper, 56). Amayreh, J., Al-Abed, N., 2005. Developing crop coeficients for ield-grown tomato (Lycopersicon esculentum Mill.) under drip irrigation with plastic mulch. Agric Water Manage, 73. pp. 247-254. Feddes, R.A., 1985. Crop water use and dry matter production: state of the art. In: Les besoins en eau des cultures. Conference internationale, Paris, September 11–14, 1984. pp. 221–234. Hanson, B.R., May, D.M., 2005. Crop coeficients for drip-irrigated processing tomato. Agric Water Manage, 81. pp. 381-399. Kaimal, J.C., Finnigan, J.J., 1994. Atmospheric boundary layer lows –their structure and measurements. Oxford: Oxford University Press. Katerji, N., Perrier, A., 1983. Modélisation de l’évapotranspiration réelle d’une parcelle de luzerne: rôle d’un coeficient cultural. Agronomie, 3, 6. pp. 513-521. Katerji, N., Perrier, A., 1985. Détermination de la résistance globale d’un couvert végétal à la diffusion de vapeur d’eau et de ses différentes composantes. Approche théorique et vériication expérimentale sur une culture de luzerne. Agric Meteorol, 34. pp. 105-120. Katerji, N., Rana, G., 2006. Modelling evapotranspiration of six irrigated crops under Mediterranean climate conditions. Agr Forest Meteor, 138. pp. 142-155. Katerji, N., Mastrorilli, M., Rana, G., 2008. Water use eficiency of crops cultivated in Mediterranean region: review and analysis. Eur J Agron, 28. pp. 493-507. Katerji, N., Rana, G., 2008. Crop evapotranspiration measurements and estimation in the Mediterranean region. INRA-CRA. 173 pp. Pereira, L.S., Oweis, T., Zairi, A., 2002. Irrigation management under water scarcity. Agric Water Manage, 57. pp. 175–206. Perrier, A., 1975a. Etude physique de l’évapotranspiration dans les conditions naturelles. I. Evaporation et bilan d’énergie des surfaces naturelles. Ann Agron, 26. pp. 1-18. Perrier, A. ,1975b. Etude physique de l’évapotranspiration dans les conditions naturelles. III. Evapotranspiration réelle et potentielle des couverts végétaux. Ann Agron, 26. pp. 229-243. Rana, G., Katerji, N., 2000. Measurements and estimation of actual evapotranspiration in the ield under Mediterranean climate: a review. Eur J Agron, 13. pp. 125-153. Ritchie, J.T., 1983. Eficient water use in crop production: discussion on the generality of relations between biomass production and evapotranspiration. In: Taylor, H.M., Jordan, W.R., Sinclair, T.R. (eds.). Limitations to eficient water use in crop production. Madison: ASA–CSSA–SSSA. pp. 29–43. Shideed, K., Oweis, T., Gabr, M., Osman, M., 2005. Assessing on-farm water-use eficiency: a new approach. ICARDA-ESCWA editions. 86 pp. Smith, M., Allen, R.G., Monteith, J.L., Perrier, A., Pereira, L.S., Segeren, A., 1991. Report on the expert consultation on revision of FAO methodologies for crop water requirements. Rome: FAO, Land and Water Development Division. Steduto, P., Caliandro, A., Rubino, P., Ben Mechlia, N., Masmoudi, M., Martinez-Cob, A., Jose Faci, M., Rana, G., Mastrorilli, M., El Mourid, M., Karrou, M., Kanber, R., Kirda, C., El-Quosy, D., El-Askari, K., Ait Ali, M., Zareb, D., Snyder, R.L., 1996. Penman-Monteith reference evapotranspiration estimates in the Mediterranean region. In: Camp, C.R., Sadler, E.J., Yoder, R.E. (eds.). Evapotranspiration and irrigation scheduling, proceedings of the international conference, November 3-6, San Antonio, TX. pp. 357-364. Testi, L., Villalobos, F.J., Orgaz, F., 2004. Evapotranspiration of a young irrigated olive orchard in southern Spain. Agric Forest Metorol, 121. pp. 1-18. Zwart, S.J., Bastiaanssen, W.G.M., 2004. Review of measured crop water productivity values for irrigated wheat, rice, cotton, and maize. Agric Water Manage, 69. pp. 115–133.
150
Options Méditerranéennes A 84