www.ijres.net Computerized Adaptive Test (CAT) Applications and Item Response Theory Models for Polytomous Items Eren Can Aybek1, R. Nukhet Demirtasli2 1 Eskişehir Osmangazi University 2 Ankara University
ISSN: 2148-9955
To cite this article: Aybek, E.C. & Demirtasli, R.N. (2017). Computerized adaptive test (CAT) applications and item response theory models for polytomous items. International Journal of Research in Education and Science (IJRES), 3(2), 475-487. DOI: 10.21890/ijres.327907
This article may be used for research, teaching, and private study purposes. Any substantial or systematic reproduction, redistribution, reselling, loan, sub-licensing, systematic supply, or distribution in any form to anyone is expressly forbidden. Authors alone are responsible for the contents of their articles. The journal owns the copyright of the articles. The publisher shall not be liable for any loss, actions, claims, proceedings, demand, or costs or damages whatsoever or howsoever caused arising directly or indirectly in connection with or arising out of the use of the research material.
International Journal of Research in Education and Science Volume 3, Issue 2, Summer 2017
ISSN: 2148-9955
Computerized Adaptive Test (CAT) Applications and Item Response Theory Models for Polytomous Items Eren Can Aybek, R. Nukhet Demirtasli
Article Info
Abstract
Article History
This article aims to provide a theoretical framework for computerized adaptive tests (CAT) and item response theory models for polytomous items. Besides that, it aims to introduce the simulation and live CAT software to the related researchers. Computerized adaptive test algorithm, assumptions of item response theory models, nominal response model, partial credit and generalized partial credit models and graded response model are described carefully to reach that aim. Likewise, item selection methods, such as maximum Fisher information, maximum expected information, minimum expected posterior variance, maximum expected posterior weighted-information, and ability prediction methods, such as expected a posteriori and maximum a posteriori, are expounded as well as stopping rules for the computerized adaptive tests.
Received: 04 January 2017 Accepted: 26 February 2017
Keywords Item response theory Computerized adaptive test Polytomous items
Introduction Measurement tools in education and psychology can be applied in computerized form as well as in paper-pencil form. It is not usually intended to adapt the test to the individual in the measuring instruments applied in the form of paper-pencil, so the individuals take all the items in the same number and order. In applications called Computerized Adaptive Test (CAT), the item to which the individual response is determined by individual‟s measured ability/trait (θ) level. In the maximum performance tests, individuals with higher skill levels receive more difficult items, while those with lower ability level receive easier items and a tailored test form is formed for each individual (Bartram & Hambleton, 2006; De Ayala, 2009; DeMars, 2010). The basic rationale behind adaptive tests is to avoid items that are too difficult or too easy for the individual who take the test and to select the most appropriate items for the individual's characteristics (Davey, 2010; Weiss & Kingsbury, 1984). The individual can carelessly make mistakes when he/she receives a very easy test according to his/her skill level (Linacre, 2000), they can try to guess items that they cannot answer, or they can give answers according to certain patterns. In this case, in the traditional paper-pencil test, the test will give less information about the individual; It is difficult to determine, for example, the differences between a group of individuals who respond correctly to all the items. However, with the CAT applications, individuals receive items which provide more information about their own ability level, so that differences between individuals can be more clearly defined (Lord, 1980; Wainer & Dorans, 2000; Weiss, 2004; Van der Linden & Glas, 2010). A CAT application is basically carried out as in Figure 1.
Figure 1. A CAT process (Davey, 2011). CAT has a cycle in which taking the individual‟s previous responses into account, selecting the next item from an item pool, estimating the individual's ability according to the response of the individual, and stopping the test (Weiss & Kingsbury, 1984). The first traces of this process are seen by Alfred Binet in his intelligent test developed in 1905. When applying the Binet intelligence test, an item pool is used and each individual is given items that match his/her ability level. In addition, when starting the test, the test administrator starts to apply it
476
Aybek & Demirtasli
with an item with difficulty according to the age of the individual and uses a pre-defined scoring, item selection method and stopping rule; In this regard, the traditionally applied Binet intelligence test carries an adaptive test feature (Binet & Simon, 1905; as cited in Weiss, 2004). Given that the Binet intelligence test is applied individually, it is clear that it would not be possible to make such an adaptation with traditional paper-pencil applications for group assessment applications. While psychologist who adapts in the Binet intelligence test; The adapters in the CAT applications are the computer. Considering computer technology, it is quite easy for a computer used as a server to carry out the adaptation process for many people at the same time. Although the advantages of CAT applications are often used for measuring maximum performance, it has been started to be used in the measurement of affective characteristics such as personality, interest, perception, and attitude. When considering individual adaptations made by the computer, it is necessary to estimate the ability/trait level according to the responses given by the individual and select a new item according to this ability/trait level (Linden & Glas, 2002). In this context, it is necessary to be able to estimate the response of an individual to an item within a certain probability, if the individual's ability/trait level is comparable to properties of the item (Wainer & Dorans, 2000). It is possible to compare the ability/trait of the individual with the properties of the item and to estimate the probability that the individual‟s response to it with Item Response Theory (IRT) (Hambleton & Swaminathan, 1985; Linden & Hambleton, 1997). The main reasons for this are the following characteristics of the IRT (Hambleton & Swaminathan, 1985): 1. Item parameters are independent of the ability level of the group. 2. The individual's ability is independent of the item sample taken. 3. The error estimate is made according to the ability/trait level of the individual. 4. Item scores are defined on a scale. 5. Distinctive tests may be developed for all ability levels. 6. The probability that an individual will response correctly to an item can be estimated. Contrary to the Classical Test Theory (CTT), the fact that the item parameters are independent of the ability/trait level measured by the test of the group and that the individual ability/trait estimates are independent of the item sample taken by the individual cause the development of the CAT applications on the basis of the IRT. Different IRT models are used in CAT applications according to the characteristics of the trait measured by the test and the properties of the items in the measurement tool.
Item Response Theory (IRT) Models When unidimensional IRT models are examined, it can be seen that a classification has been made for dichotomous and polytomous items. Models developed for the dichotomous items vary depending on the difficulty of item (b), item discrimination (a), and pseudo-guess (c) parameters (DeMars, 2010). In the 1 Parameter Logistic (1 PL) model only item difficulty parameter, b is used. The b parameter for an item indicates the probability that the likelihood of correct answer at the level of the ability/trait is 0.5 (Hambleton & Swaminathan, 1985). In other words, it is assumed in this model that the probability of an individual responding correctly to an item is only affected by the difficulty level of that item. With 2 Parameter Logistic (2 PL) model, the likelihood of correctly responding to an item depends on the b parameter as well as the parameter a, which is item discrimination. In the 3-parameter logistic (3 PL) model, the probability of correct answer is taken into account along with the parameters a and b, and the parameter c is included (Embretson & Reise, 2000). The dichotomous items scored are true - false; 1 – 0 while polytomous items can be scored partly or in grades like 1 - 2 - 3 - 4 - 5. When these items are used to measure affective traits, it is not possible that the individual responds correctly to the item; so the probability of category endorsement is calculated. Partial Credit Model (Masters, 1982), Graded Response Model (GRM) (Samejima, 1996), Nominal Response Model (NRM) and the Generalized Partial Credit Model (GPCM) (Muraki, 1992) are developed for these type of items.
Assumptions of Item Response Theory Some assumptions need to be met in order to obtain valid results with the IRT models developed for both dichotomous and polytomous items. These assumptions are unidimensionality, local independence and model data fit.
Int J Res Educ Sci
477
The assumption of unidimensionality is an assumption that must be satisfied when working with unidimensional IRT models. Accordingly, each of the items in the test must have come together to measure a single latent trait. Factor analytic approaches are the most frequently used approaches to testing this assumption and can be tested with exploratory or confirmatory factor analysis techniques (Revicki, Chen, & Tucker, 2015). The assumption of local independence can be summarized as the response to an item does not affect the response to another item. In addition, the provision of the assumption of unidimensionality also provides evidence for local independence (Hambleton, Swaminathan, & Rogers, 1991). The model data compatibility is that the observed data are consistent with the item characteristic curve (De Ayala, 2009).
Nominal Response Model (NRM) This model, developed by Bock (1972), does not require that the categories be at the ordinal level. In this respect, it also provides for the inclusion of distracters to the model (Embretson & Reise, 2000). There is an option characteristic curve for each category (Hambleton & Swaminathan, 1985). Bock (1972) described the probability of an individual choosing the kth category in item j for the nominal response model as in Formula 1. (
)
∑ : intercept parameter for option k of item j : slope (discrimination) parameter for option k of item j The intercept parameter is expressed as γ = -αb and reflects a tendency to select a category relative to the other. Although it is dependent on the location parameter b, it is not the same parameter (Hambleton et al., 1991). Two methods can be followed when the α and γ parameters are used in the model. These routes are summarized below (De Ayala, 2009, pp. 237-245). In order to be able to define the nominal response model, it is necessary to refer to the parameters of a category and to define the αj and γj parameters of the other categories according to this reference. For this reason, the parameters αj and γj to be referenced are assumed to be zero (α1 = 0, γ1 = 0). (m - 1) number of parameters for different categories are produced in this count. However, if it is desired to assign parameters that may be different from zero for each category, the parameters αj and γj need to be transformed. The transformation matrix for this is used as follows. αj= αj*T and γj= γj*T
(2)
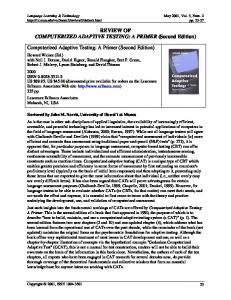
Detailed information on how the transformation matrix is constructed and how the matrix is multiplied can be found in Appendix A of De Ayala's (2009) Theory and Practice of Item Response Theory. Software such as MULTILOG gives the transformed parameters in the output files. If it is desired to calculate the location parameters from the intercept parameters, the b parameter can be calculated for each category with the help of the equation γ = -αb. Sample item parameters (transformed) and option characteristic curve for the nominal response model are given in Table 1 and Figure 2. Table 1. Sample item parameters for the nominal response model Categories β Don‟t agree -1.00 -1.00 Neutral 0.00 0.00 Agree 1.00 0.50 The option characteristic curves are similar to the item characteristic curves, and a characteristic curve is presented for each category. Figure 2 shows the option characteristic curve for four categories. Also, when the item has two categories, the nominal response model produces the same result as the 2 PL model.
478
Aybek & Demirtasli
*I like to solve arithmetic problems
Figure 2. Option characteristic curve for nominal response model
Partial Credit Model (PCM) Developed by Masters (1982), the Partial Credit Model (PCM) is suitable for items with partial scoring. It is a model used for situations where the items are scored as 0, 1, 2, ... m rather than just 0 and 1. Unlike NRM, the categories for PCM must be ordinal level in which they are to be measured. PCM was developed on the basis of the Rasch model, and the mathematical expression of the probability that an individual with θ has an x response to item j is given in Formula 3 (Masters, 1982). ∑
(
(
)
)
∑ ( ) ∑ : transition location parameter from option (h – 1) to option h
For ease of notation, ∑ ( ) . , also takes the name of the transition parameter since it indicates the transition position from the category (h - 1) to the category h. There are three (m - 1) transition parameters , and for a four-category item. The transition parameter represents the likelihood of the individual to select the hth option instead of the (h-1)th option (De Ayala, 2009). Software such as PARSCALE, MULTILOG, etc. contain these parameters in the output files. Table 2 and Fig. 3 show transition parameters and characteristic curves according to the parameters. Table 2. Sample item parameters for partial credit model Sample item I like to solve arithmetic problems. -1.00
1.00
The transition parameters are the intersection of Category 1 (I do not agree) with Cateory 2 (I agree partially) and Category 2 (I agree) with Category 3 (I agree). When the individual is at θ = -1, probability of selecting Don‟t agree and Neutral is equal. Similarly, when the individual at θ = 1, the probability of selecting Neutral and Agree is also equal.
Figure 3. Sample option characteristic curves for the partial credit model
Int J Res Educ Sci
479
Generalized Partial Credit Model (GPCM) Since the Partial Credit Model is based on the Rasch Model, it assumes that all items in the measurement tool have equal discrimination. Muraki (1992) allowed the items to be differentiated by generalizing this model. According to this model, the probability of an individual giving response x to item j is expressed as in Formula 4. ∑
(
)
∑
( ∑
) (
)
: slope parameter for item j Similar to the Partial Credit Model, ∑ ( ) in this model is taken as the intersection point transition parameters of the option characteristic curves. Since it is accepted as ; the number of category - 1 transition parameter is available. For an item with four categories, there are 4 - 1 = 3 transition parameters. In Table 3 and Figure 4, the sample transition parameters, discrimination parameter and option characteristic curves corresponding to these parameters are given. Table 3. Sample item parameters for the generalized partial score model I like to solve arithmetic problems.
2
-1.00
1.00
When the discrimination parameter of the item presented in the figure is taken as 1.00, the option characteristic curves are the same as the Partial Credit Model. In other words, when the item discrimination parameter is 1.00, GPCM gives the same result as PCM. Similarly, GPCM for a dichotomous item is transformed into 2 PL Model.
Figure 4. Sample option characteristic curves for the generalized partial credit model
Graded Response Model (GRM) Partial Credit and Generalized Partial Credit Models are based on Rasch and 2 PL Models. Accordingly, the answer to which an individual will respond to an item is the result of comparisons between the category h and the category (h - 1). That is, categories are divided into groups of two, and IRT models are used, which are basically used for dichotomous items. Samejima (1996) makes cumulative comparisons between the categories in the Graded Response Model. That is, unlike the 0 – 1; 1 – 2; 2 – 3 comparisons in PCM and GPCM; 0 - 1, 2, 3; 0, 1 - 2, 3; 0, 1, 2 - 3 are compared in GRM. Accordingly, the probability of the individual choosing xj or greater for item j is expressed as in Formula 5:
: category boundary location for category xj discrimination parameter for item j
480
Aybek & Demirtasli
probability of choosing xj or higher for item j When we look at the mathematical representation of the Graded Response Model, it can be seen that this model is basically a 2 PL model. In the 2 PL model, the probability of an individual responding to an item incorrectly or correctly is calculated, and in the GRM the probability of an individual responding to an item lower than xj or higher than xj is calculated. As it can be understood from this explanation, GRM requires that the categories for the item to be applied are ordinal level in terms of the measured traits (e.g. Likert-type items). When it is known that likelihood to give a response of xj or higher to an item, and the probability of giving a response of xj is wanted to be calculated, the probability of giving an answer of xj or greater is derived from the possibility of the individual responding xj + 1 and greater.
Sample item parameters for GRM are presented in Table 4 and the Option Characteristic Curves (OCCs) obtained using the category boundary curves obtained using Formula 5 and Formula 6 are given in Figures 5 and 6. Table 4. Sample item parameters for the graded response model I like to solve arithmetic problems.
1.5
-1.00
1.00
The category boundary locations are at the intersection of the option characteristic curves. It is -1 and 1 as indicated in Table 4. When category boundary curves in Figure 5 is examined, it is likely that the individual has the possibility to select category 2 or category 3 against category 1 and category 3 against category 1 and category 2.
*I like to solve arithmetic problems
Figure 5. Example category boundary curves for the graded response model When the differences between the probabilities are calculated, the OCC is shown in Fig. 6 is formed.
*I like to solve arithmetic problems
Figure 6. Sample option characteristic curves for the graded response model
Int J Res Educ Sci
481
There are studies that found GRM shows better fit with data (Baker, Rounds, & Zevon, 2000; Demirtaşlı, Yalçın, & Ayan, 2016; Gardner et al., 2004) as well as GPCM (Aybek, 2016a; Haley et al., 2009; Walter et al., 2007). Researchers should investigate to find out which IRT model is applicable most to their data. Comparison for four polytomous IRT models are given Table 5.
NRM PCM GPCM GRM
Table 5. Comparison of four polytomous IRT models Nominal categories Ordinal categories b-parameter X X X X X X X X X
a-parameter X X
When the above-mentioned IRT models and computers with high processing power are employed, it becomes possible to develop applications that most appropriate items are selected by the computer to the characteristics of the individual by going beyond linear testing applications.
Computerized Adaptive Tests (CAT) Based on Item Response Theory With Item Response Theory, it is possible to determine the probability of an individual at the θ level give the correct answer or selects a category for the item. In this case, it is possible to select only items from the item pool which are suitable for the individual according to measured trait. After the item is selected, the θ level is reestimated according to individual‟s response. This process continues until the θ level of the individual is estimated at a certain accuracy or until all of the items in the item pool are applied. In the application of CAT, it is necessary to determine how to select items from the item pool, how to make the estimation and in which cases the application is to be stopped. There should be a sufficient number of items in the item pool used for each level of θ (Wainer & Dorans, 2000). In addition, variables such as the item exposure rate and whether the items are multidimensional or not, should be taken into consideration (Veldkamp & Linden, 2012). Item selection methods in CAT process are given below.
Item Selection Methods It is important to choose the items from the item pool according to a rule. At the beginning of the test, a random item may be selected from the item pool as the first item since there is no information about individual‟s trait level (Cheng, 2008). However, it should not be forgotten that the first item selected may affect the psychological state of the individual receiving the test. For this reason, as the first item, an item should be selected which is neither under nor over for individual‟s trait level. If the selected item is far below from the trait of the individual, he/she may not fill the test seriously, and the level of anxiety of the individual may increase with an item that is selected far above the trait level (Linacre, 2000). Thompson and Weiss (2011) stated that external variables can be used in the selection of the first item. These external variables may be variables such as the individual's motivation for that moment or the socio-economic level of the individual, as well as the individual's scores from previous tests. The simplest method, however, it is to be selected by accepting θ level = 0. After the first item is selected, the future items will be selected according to the answers given by the individual. Item selection methods that can be used in item selection during the CAT process are given below. Maximum Fisher information (MFI) Dodd, De Ayala, and Koch (1995) stated that item selection in CAT applications is mainly performed using the information function. Accordingly, Fisher's information function is defined as follows (Veldkamp, 2003): [∑
(∑
) ]
: the probability that the individual at the θ level selects the category k in item i. m: number of category in the item. k: category number. When it is desired to select the item with Maximum Fisher Information function, the item with the highest value of for current θ level is selected as the next item.
482
Aybek & Demirtasli
Maximum expected information (MEI) In this method, the probability distribution of the answers that an individual will give to each item in the item pool is estimated and the item that is expected to give the most information about the individual in probability distribution is selected. Taking into account the answers given by the individual to the previous items, new θ levels are estimated according to the possible answers to the item to be selected from the item pool. In the Maximum Fisher Information function, the final θ level estimated by the individual is included in the function, while different θ levels that can be estimated by the individual‟s possible answers are taken into account in the Maximum Expected Information function (Van der Linden, 1998).
Minimum expected posterior variance (MEPV) In the Maximum Expected Information method, the posterior information function is used. In the Minimum Expected Posterior Variance method, the information function replaces with the posterior variance of the θ levels to be estimated according to the possible answers (Choi and Swartz, 2009). Van der Linden (1998) stated that the MEPV method is an alternative to MEI for small samples.
Maximum expected posterior weighted-information (MEPWI) In this method, which is similar to the MEI method, the information function is not separately calculated according to the possible answers of the individual to the item, but instead the entire possible answer of the individual is included in the function and the item providing the most information about the individual is selected from the item pool (Van der Linden, 1998). Boyd, Dodd, and Choi (2010) stated that this method is not economical and increases the computational burden especially when the number of items increases.
Other item selection methods Methods such as Kullback-Leibler Information (Chang & Ying, 1996), Maximum Likelihood Weighted Information (MLWI), and Maximum Posterior Weighted Information (MPWI) are also used in CAT applications and simulation studies (Boyd et al., 2010). Choi and Swartz (2009) compared item selection methods of MFI, MEPWI, MEI, MEPWI, and MEPV and found that MFI and MEPWI methods were equally good choices and that item selection method in small pools did not lead to differences in the number of items applied and the estimated θ level. Similarly, Van der Linden (1998) stated that when choosing methods such as MEI, MEPV, and MEPWI as item selection method in CAT applications, a better θ estimation for the individual should not be expected. Boyd et al. (2010) stated that complex item selection methods (e.g. MEI) may not bring practical benefits, except where the item information function provides information for a very small θ interval, where large item pools are being studied. Ability / Trait (θ) Estimation Methods In the CAT applications, after each item is applied, the individual's θ level is re-estimated and a new item is selected from the item pool with the above-described methods according to the latest-estimated θ level. One of the most widely used θ estimation methods in CAT applications is the Maximum Likelihood (ML) method. According to this method, a likelihood function is defined and the value of ̂ which reaches this maximum value, is estimated as the trait level of the individual (Hambleton et al., 1991). Weighted Likelihood (WL) estimation method as an alternative to the ML method has been proposed by Warm (1989). Accordingly, likelihood function is weighted by wk – 1 (θ) function and the value of ̂ giving the greatest value to this weighted function is estimated as ̂ level of the individual. Fox (2010), Van der Linden and Pashley (2012), stated that within the widespread use of Bayesian methods, Lord (1986) and Mislevy (1986) have developed Maximum a Posteriori (MAP) and Bock and Mislevy (1988) have developed Expected a Posteriori (EAP) methods. The ML method does not work when the individual responds incorrectly or correctly to the whole of the items. It is not possible to use the ML method in the estimation of ability, especially in the beginning of the test, or in
Int J Res Educ Sci
483
the instruments where the affective properties are measured, since it is possible that the individual response with a similar pattern to all the items (Hambleton et al., 1991). Van der Linden and Pashley (2012) have proposed four different solutions for this situation. The first one is to set the ability estimation to small (for wrong answers) or big (for correct answers) values until the ML method produces a valid result. The second recommendation is that the ability estimate is held until a larger set of items is answered. The third recommendation is the use of Bayesian methods, and the fourth recommendation is to take into account the information already obtained from the individual at the beginning of the test. Hambleton and Swaminathan (1985) stated that Bayesian methods can be used in situations where the ML method cannot produce a valid value and that a normal distribution for the prior distribution of θ can be defined. However, they have emphasized that researchers who oppose the philosophy of using a priori distribution, they can report the estimated θ level in true score format instead of using Bayes methods. Accordingly, the ML method, transformed to a true score of a θ estimated as + ∞ or -∞, is as follows: ∑ When θ = + ∞,
, so ξ = n. Similarly, when θ = -∞,
(ci for 3 PL model) and ξ = 0.
Stopping Rules With the choice of items from the item pool and the θ is estimated, the CAT application enters a loop. Stopping rules are used to decide when to end the test by computer. Situations, where the test can be stopped, are given below (Babcock & Weiss, 2012; Downing & Haladyna, 2006; Linacre, 2000): 1.
Reaching the maximum test length: The maximum number of items an individual can take can be determined in advance.
2.
Estimating the θ level in sufficient precision: Each response given by the individual gives more information about the individual's measured θ level. This causes the standard error of the measurement to decrease as it increases the precision of the measurement. The test stops when the measurement reaches enough precision. Typical standard error values used are .20 and .30 logit, but the standard error values such as .40, .50 logit are also studied in the researches.
3.
No item to provide more information about the individual: The test is stopped if there is no item in the item pool that will give more information about the individual.
4.
If the ability estimation is too far from the pass/fail criterion: The test is stopped if statistically the individual passes or fails certain in a CAT application in which the overturned decision is made.
5.
If the individual shows inappropriate behaviors to the test: In the CAT application, it can be determined that the individual gives indifferent responses, has a certain response pattern, or responds to the items very quickly, and the test can be stopped.
6.
If a certain amount of time has elapsed: The test taker may wish to restrict the duration of test. In such a case, the test may be stopped after a certain period of time has elapsed since the start of the test.
Also, although not a stopping rule, the application of all items to the test taker, usually in small item pools, can also cause the test to stop. However, a CAT application cannot be stopped without the following conditions: 1.
Without applying a specific number of items: In most cases, individuals who take the test do not believe that their abilities are measured correctly without responding to 10-20 items. It is also very difficult to achieve the standard error of the measurement criteria with a very small number of items.
2.
Without full coverage: A test usually involves a number of subjects. The person who took the test before the test was stopped must have responded to all the subject areas. This is also necessary to ensure that the content validity.
484
Aybek & Demirtasli
Even if the standard error criteria in the stopping rule reduce the measurement error, there are certain disadvantages of it. In order for the standard error to fall below the specified value, the individual has to respond more amount of item. This, in turn, can affect the usefulness which is one of the most important advantages of CAT applications. Another disadvantage is that this stopping rule terminates the test despite the presence of informational items about the individual in the item pool (Gardner et al., 2004). If the test is terminated when there is no item in the item pool that will give sufficient information about the individual, the test may not have performed a measurement with sufficient precision. For this reason, Choi, Grady and Dodd (2011) proposed an alternative to the standard error and information function based methods, Predicted Standard Error Reduction (PSER). In this method, if a new item is applied, it is estimated how much reduction will occur in the standard error, and if the decrease amount is below a predetermined value, the test is stopped. This method is searching for answers for “Is it worth to continue the test?”. It is developed especially for small item pools and situations where it is important to reduce the number of applied-items. As can be seen, there are several item selection and ability/trait estimation methods, stopping rules, and more than one IRT model that can be used in practice for a CAT application. For this reason, when it is desired to develop the CAT application, it is necessary to decide which IRT model is suitable for the measurement tool planned to be applied as CAT, which ability estimation method and item selection method should be used and which stopping rule should be adopted.
CAT Software Before developing the CAT application, the test developer may apply simulation studies to determine the item selection and ability estimation methods and stopping rules to be used in practice. For this reason, below are software that can be used for simulation studies first, followed by software that can be used for live CAT application. This software list has been accessed through the International Computerized and Adaptive Testing Association (IACAT) (IACAT, 2015).
Software for Simulation Studies When the software that can be used in the simulation studies are examined, CATSim which is a commercial software and SimuMCAT, SimulCAT and Firestar software which are offered as freeware are reached. SimulCAT offers ease of use to work with dichotomous items, while Firestar is very useful for polytomous items. Firestar, developed by Choi, produces an R syntax for various scored items depending on various parameters. In other words, the software itself does not perform the simulation operation, but produce the syntax that is required for the simulation to be done with R. The software is free to use, supports GRM and GPCM IRT models, 12 item selection methods, three stopping rules, MAP and EAP θ estimation methods. In addition, users can specify how to select the first item. D, the scaling factor can be set to 1.0 or 1.7. At the same time, the software can generate θ values in accordance with the determined distribution, or it can work with user-supplied θ values and item parameters (Choi, 2009).
Software for Live CAT Applications When we look at the software that can be used in live CAT applications, it seems that commercial software such as FastTest, Pearson VUE, Prometric, McCann, as well as open source and free software such as Concerto, IRTCAT, and OSCATS. Information about commercial software can be accessed from the web pages of the software. Concerto, open source software, is a software developed by the Center for Psychometrics at the University of Cambridge, based on R. Concerto operates in the web environment and forms a framework for the user for CAT applications. The software basically records the R outputs to the MySQL database and then calls the information stored in the database to show the user as a web-based content. Concerto has a test module, an HTML template module, and a table module. In the test module, the users can develop the CAT algorithm with the help of the catR package on the R. In the HTML module, the pages that the test taker receives are designed and in the table module, the databases are created in which the responses generated by the users and the outputs generated by R are recorded.
Int J Res Educ Sci
485
Concerto shows the R output to the user through the database; If the user receives the input, it also transmits it to the R via the database and continues the operation of the test. For this reason, it can be said that Concerto is a bridge between the user, MySQL and R. The great advantage of Concerto's R-based is that it allows the test developer to use the IRT model, item selection, and the θ estimation method, stopping rule as he wants, and improve the CAT application according to his needs. Especially in 4.0 and later versions of the software, test developers can run R code as they wish (Aybek, 2016b).
Conclusion In this article computerized adaptive test (CAT) applications are introduced and the IRT models which can be used especially in the studies in which affective traits are measured is explained. In addition to this, basic information about how to select the item and ability/trait estimation in the CAT applications and how to stop the CAT application is given and simulations and live CAT software which can be used in the researches are introduced. Using these software, models, and methods, researchers can work with polytomous items (eg, Likert-type or partial credit items). Where the item categories are not ordinal, the NRM is the most appropriate model; PCM, GPCM and GRM are the forefront when categories are ordinal as in the Likert-type. However, researchers who want to include the item discrimination parameter in their models should choose the GPCM and GRM models. Rasch-model-based PCM can be used by researchers who want to include only the location parameter in the model. MFI being the most commonly used item selection method but when researchers work with large item pool, they may prefer the item selection method that is most appropriate by comparing methods with simulation studies. As the ML method for ability estimation is insufficient where the same response is given to all items, Bayesian methods, such as MAP and EAP, can be tried. Researchers who want to work with post-hoc CAT simulations or live CAT applications may prefer Firestar and Concerto software because of their ease of use, their functionality and their open source code. When all these models, methods and CAT software are considered, it is inevitable that CAT applications with polytomous items will become widespread in the future.
Acknowledgements This study was derived from a part of the doctoral thesis prepared by Eren Can Aybek under the advisory of Prof. Dr. R. Nükhet Demirtaşlı.
References Aybek, E.C. (2016a). An investigation of applicability of the Self-assessment Inventory as a computerized adaptive test (CAT). (Unpublished PhD thesis). Ankara University, Turkey. Aybek, E.C. (2016b). Concerto: A Framework for Computerized Adaptive Test Applications. Journal of Measurement and Evaluation in Education and Psychology, 7(2), 251-271, doi: 10.21031/epod.267198 Babcock, B., & Weiss, D. (2012). Termination criteria in computerized adaptive tests: Do variable - length CATs provide efficient and effective measurement? Journal of Computerized Adaptive Testing, 1(1), 1– 18. doi:10.7333/1212-0101001 Bartram, D., & Hambleton, R. K. (2006). Computer-based testing and the Internet. Issues and advantages. England: John Wiley and Sons. Baker, J. G., Rounds, J. B. & Zevon, M. A. (2000). A comparison of graded response and rasch partial credit models with subjective well-being. Journal of Educational and Behavioral Statistics, 25, 253–70. Bock, R. D. (1972). Estimating item parameters and latent ability when responses are scored in two or more nominal categories. Psychometrika, 37(1), 29-51. Boyd, A., Dodd, B., & Choi, S. (2010). Polytomous models in computerized adaptive testing. Nering, M. ve Ostini, R. (Ed.). Handbook of polytomous item response theory models. (229-255). New York: Routledge. Chang, H. H., & Ying, Z. (1996). A global information approach to computerized adaptive testing. Applied Psychological Measurement, 20(3), 213-229. Cheng, Y. (2008). Computerized adaptive testing – New developments and applications. (Unpublished PhD thesis). Illionis University, Illionis.
486
Aybek & Demirtasli
Choi, S. W., & Swartz, R. J. (2009). Comparison of CAT item selection criteria for polytomous items. Applied Psychological Measurement, 33(6), 419–440. doi:10.1177/0146621608327801 Choi, S. W. (2009). Firestar: Computerized adaptive testing simulation program for polytomous item response theory models. Applied Psychological Measurement, 33(8), 644–645. doi:10.1177/0146621608329892 Choi, S. W., Grady, M. W., & Dodd, B. G. (2011). A new stopping rule for computerized adaptive testing. Educational Psycholofical Measurement, 70(6), 1–17. doi:10.1177/0013164410387338 Davey, T. (2011). A guide to computer adaptive testing systems. Council of Chief State School Officers. De Ayala, R.J. (2009). The theory and practice of item response theory. New York:The Guilford Press. DeMars, C. (2010). Item response theory. Oxford: Oxford University Press. Demirtaşlı, N., Yalçın, S., & Ayan, C. (2016). The development of IRT based attitude scale towards educational measurement course. Journal of Measurement and Evaluation in Education and Psychology, 7(1), 133144, doi: 10.21031/epod.43804. Dodd, B. G., De Ayala, R. J., & Koch, W. R. (1995). Computerized adaptive testing with polytomous items. Applied Psychological Measurement, 19(1), 5–22. doi: 10.1177/014662169501900103 Downing, S. M., & Haladyna, T. M. (2006). Handbook of test development. New Jersey: Lawrance Erlbaum Assoc. Embretson, S., & Reise, S. (2000). Item response theory for psychologists. New Jersey: Lawrance Erlbaum Associaties. Fox, J.P. (2010). Bayesian Item Response Modeling. New York: Springer. Gardner, W., Shear, K., Kelleher, K. J., Pajer, K. A., Mammen, O., Buysse, D., & Frank, E. (2004). Computerized adaptive measurement of depression: A simulation study. BMC Psychiatry, 4(1). Haley, S. M., Ni, P., Jette, A. M., Tao, W., Moed, R., Meyers, D., & Ludlow, L. H. (2009). Replenishing a computerized adaptive test of patient-reported daily activity functioning. Quality of Life Research, 18(4), 461-471. doi: 10.1007/s11136-009-9463-5 Hambleton, R., & Swaminathan, R. (1985). Fundementals of item response theory. Newbury Park: Sage Pub. Hambleton, R., Swaminathan, R., & Rogers, H.J. (1991). Fundementals of Item Response Theory. California: Sage Pub. International Association for Computerized and Adaptive Testing (IACAT). (2015). CAT software. Accessed at March 10th, 2015: http://iacat.org/content/cat-software Linacre, J. M. (2000). Computer-adaptive testing: A methodology whose time has come. Chae, S.-Kang, U.– Jeon, E.–Linacre, JM (eds.): Development of Computerised Middle School Achievement Tests, MESA Research Memorandum, (69). Linden, W., & Glas, G. (2002). Computerized adaptive testing: Theory and practice. New York: Kluver Academic Pub. Linden, W. & Hambleton, R. (1997). Handbook of modern item response theory. New York: Springer. Lord, F. (1980). Applications of item response theory to practical testing problems. New York: Routledge. Masters, G. N. (1982). A Rasch model for partial credit scoring. Psychometrika, 47(2), 149-174. Muraki, E. (1992). A generalized partial credit model: Application of an EM algorithm. ETS Research Report Series, 1992(1), i-30. Revicki, D.A., Chen, W.H., & Tucker, C. (2015). Developing item banks for patient-reported healty outcomes. Reise, S., Revicki, S. (Ed.). Handbook of item response theory modeling. New York: Routledge. Samejima, F. (1996). Polychotomous responses and the test score. Tennessee: The University of Tennessee. Thompson, N.,ve Weiss, D. (2011). A Framework for the development of computerized adaptive tests. Practical Assessment, Research 16(1). Van der Linden, W. (1998). Bayesian item selection criteria for adaptive testing. Psychometrika, 63(2), 201– 216. Van der Linden, W. J., & Glas, C. A. (2010). Statistical tests of conditional independence between responses and/or response times on test items. Psychometrika, 75(1), 120-139. doi: 10.1007/s11336-009-9129-9 Van der Linden, W. J.,& Pashley, P. J. (2009). Item selection and ability estimation in adaptive testing. Van der Linden, W.J., Glas, C. (Ed.). Elements of adaptive testing (pp. 3-30). New York: Springer. Veldkamp, B. P. (2003). Item selection in polytomous CAT. In New developments in psychometrics (pp. 207214). New York: Springer. Veldkamp, B.P. & Van der Linden, W.J. (2012). Designing item pools for adaptive testing. Van der Linden, W.J., Glas, C. (Ed). Elements of adaptive testing. (pp. 231-247). New York: Springer. Wainer, H. & Dorans, N. (2000). Computerized adaptive testing: A primer. New Jersey: Lawrance Erlbaum Assoc. Walter, O. B., Becker, J., Bjorner, J. B., Fliege, H., Klapp, B. F., & Rose, M. (2007). Development and evaluation of a computer adaptive test for „Anxiety‟(Anxiety-CAT). Quality of Life Research, 16(1), 143-155. doi: 10.1007/s11136-007-9191-7
Int J Res Educ Sci
487
Warm, T. A. (1989). Weighted likelihood estimation of ability in item response theory. Psychometrika, 54(3), 427-450. Weiss, D. J. (2004). Computerized adaptive testing for effective and efficient measurement in counseling and education. Measurement and Evaluation in Counseling and Development, 37(2), 70. Weiss, D. J., & Kingsbury, G. (1984). Application of computerized adaptive testing to educational problems. Journal of Educational Measurement, 21(4), 361-375.
Author Information Eren Can Aybek
R. Nukhet Demirtasli
Eskişehir Osmangazi University Faculty of Education, Odunpazarı, Eskişehir, Turkey Contact e-mail:
[email protected]
Ankara University Faculty of Educational Sciences, Cebeci Ankara, Turkey