V International Conference on Forest Fire Research D. X. Viegas (Ed.), 2006
Burnt Area Mapping using Support Vector Machines Olivier Zammit, Xavier Descombes, Josiane Zerubia INRIA, Ariana joint research group (INRIAI3S), 2004 route des Lucioles, BP 93 , 06902 Sophia Antipolis Cedex France,
[email protected]
Abstract: This paper addresses the problem of burnt area mapping from remote sensing images. Here, the assessment of the burnt land discrimination is only based on a single after-fire satellite image acquired by the SPOT5 satellite. To delineate burnt areas, we use a recent classification method called Support Vector Machines (SVM). This proposed approach is compared with other traditional classifiers like the K-Nearest Neighbours or the K-Means algorithms which are
widely used in pattern recognition as reference classification methods. The results given by the different classifiers are also compared with official burnt area statistics, devised from ground truths. Keywords: Remote sensing, highresolution images, forest fire, burnt area, classification, Support Vector Machines
1. Introduction Forest Fires in Europe are an integral part of the major hazards which endanger environment and life. This hazard affects not only human life and properties, but also the sustainability of the forest (change in the hydrological cycle, erosion, soil loss process...). Each year, several hundred thousand hectares are burnt during the dry season. The mapping of burnt areas is an important step to assess fire impact. Detailed and accurate assessment of the burnt area provides information to insurance companies and authorities to plan rehabilitation and restoration efforts after a fire. As remote sensing is a cheap and an effective mean to collect empirical data, it is a useful tool for providing information after a forest fire (Gonzalez-Alonso et al., 2004). Moreover, vegetation is sensitive to the red and infra-red satellite sensor, that is why remote sensing is very suitable for burnt land discrimination. (Chuvieco et al., 2002)
1
V International Conference on Forest Fire Research D. X. Viegas (Ed.), 2006
In the last decade, several studies have shown the interest of using remote sensing techniques for burnt land mapping by computing the change between pre- and post-fire images (Sunar et al., 2001) or by using thresholding techniques from vegetation indices (Barbosa et al., 2002) such as multitemporal compositing techniques (Chuvieco et al., 2005a). The main objective of this paper is to assess the potential of the SVM classification method for burnt area mapping from after-fire images only. SVM have been developed for the last two decades and have demonstrated excellent performance in pattern recognition problems. They proved to provide higher classification accuracy than other traditional pattern recognition techniques such as the maximum likelihood or the multilayer neural network classifiers (Roli et al., 2001). For instance, they have outperformed conventional classification algorithms in various applications such as biomedical imagery, handwritten digit recognition or 3D object recognition. Recently, SVM proved to be well adapted to deal with high dimension data like images and were introduced to remote sensing problems (Melgani et al., 2004) The paper is organized as follows: first, we start with a brief overview of SVM (see Section II). Then, the proposed method is applied on real remote sensing data for burnt area mapping, results and comparisons with other widely-used classification techniques are given in Section III. Finally, Section IV ends the paper by summarizing the observations and drawing conclusions.
2. Support Vector Machines The goal of a supervised classifier is to use a set of observations which is called the training set to find a decision surface. This surface classifies any new object into a class. It learns how to classify new objects into classes by correctly classifying most of the training set objects. The training of conventional classifiers, such as neural networks and statistical classifiers, is based on the principle of Empirical Risk Minimization (ERM) (Vert, 2001). These classifiers aim at minimizing the error rate on the given training set. The main drawback of these methods is that they do not provide a good generalization. The error rate of the classifiers on all the objects can be much higher than the error rate on the training set. The Support Vector Machines (SVM) method is a supervised pattern recognition technique recently introduced in the framework of the Statistical Learning Theory (Vapnik, 1998). A main important advantage is that SVM are based on the principle of Structural 2
V International Conference on Forest Fire Research D. X. Viegas (Ed.), 2006
Risk Minimization (SRM) (Vert, 2001) rather on the ERM as do many other methods. SVM aim at generalizing well rather than correctly classifying the training set (ie. minimizing the generalization error rather than the training error). Two other reasons related to computational aspects justify the growing interest in SVM : they can be reduced to a convex quadratic programming (QP) problem (which can be solved very easily and quickly) and they seem to be more robust when dealing with high dimension data. Here, we briefly recall the theory of SVM in binary problems. Interested readers may consult Vapnik (1998), Vert (2001) or Samuelides (2004) for more details. Linearly Separable Case m We assume we are given a training set S of points xi ∈ℜ with i = 1,2,.. N. Each
point belongs to one of the 2 classes, one positive, the other one negative, y i =±1 . The principle of SVM is to construct a function f which correctly classifies all of the objects of the training set. In the linearly separable case, SVM find an hyperplane (a linear surface; equivalent to a line if m = 2) which is defined by the following equation : w . x b=0 where w is a vector normal to the hyperplane and b is the bias. Such an hyperplane divides the space into two half-spaces, the positive one and the negative one and the decision function f is defined as :
{
f : ℜm ℜ . x b0 f x = 1 if w −1 if w . x b0 x sign w . x b And for all of the elements of the training set, we must have :
{
w . xi b≥ 0 if y i =1 w . xi b≤ − 0 if y i =−1
equivalent to
{
w . xi b≥1 if y i =1 w . xi b≤−1 if y i =−1
There are an infinity of hyperplanes which fulfil this condition (to correctly classify the training set). Among these hyperplanes, the Statistical Learning Theory chooses the one which maximizes the distance from the closest data points in both classes to the hyperplane (SRM principle). This distance is equal to 1/∣∣w ∣∣ and the geometrical margin between the 2 classes is 2 /∣∣w ∣∣ and this hyperplane is called the Optimal Separating Hyperplane (OSH). The solution is given by the solution of the problem of maximizing the margin subject to the constraints, which is equivalent to the following convex Quadratic Programming Problem (QPP): 3
V International Conference on Forest Fire Research D. X. Viegas (Ed.), 2006
minimize
∣∣w∣∣ 2
2 . xi b≥1, ∀ i ∈ 〈1, N 〉 subject to : y i w w , b
This classical optimization task can be translated to its Lagrangian dual problem : maximize
W = − N
subject to :
∑ i y i
1
N
N
∑ ∑ i j yi y j xi . xj
2 i=1
= 0
N
j=1
,
i=1
∑ i i=1
0≤ i , ∀ i ∈ 〈1, N 〉
Then the OSH is defined by : * w =
N
∑ *i yi xi i=1
* * . xi , and b = y i − w
for i / i ≠0
and the decision function is given by : *
*
f x = w . x b =
N
∑ *i yi xi . x b* i=1
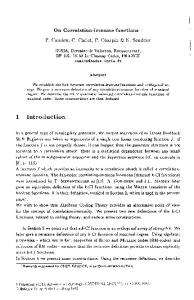
The solution vector w is a linear combination of the samples of the training set * whose Lagrangian coefficients i are non-zeros (these samples are called Support Vectors). This implies several important consequences : – As the number of Support Vectors found in the training phase can be very small compared to the size of the training set (in Figure 1a, there are 3 Support Vectors out of 15 samples in the training set), several algorithms have been developed to find efficiently and quickly the vector * knowing that most of its components are zeros. The number of Support Vectors determines the complexity of the expression of the decision surface, and therefore the time complexity of the classification phase. – Support Vectors lie at a distance equal to 1/∣∣w ∣∣ (which is the minimum distance) from the OSH which is not influenced by the other training samples. It means that these samples can be removed or added to the training set without any change w.r.t. the OSH. Non-linearly Separable Case In most of the cases, the training set is non linearly separable for real data and it is not possible to find a linear classifier which makes no classification error on the training set. The main reasons are : – there might be noise or outliers in the training set, – the two classes might require a more complicated shape to be separated (like a circle for instance). To handle the former reason, the concept of OSH has been generalized as the solution of the following problem : 4
V International Conference on Forest Fire Research D. X. Viegas (Ed.), 2006
∣∣w∣∣ 2
minimize
N
C ∑ i
2 i=1 . xi b1−i , i 0 , ∀ i ∈ 〈1, N 〉 subject to y i w w , b,
where i are slack variables (see Figure 1b) which are introduced to deal with misclassified samples and the constant C is a regularization parameter selected by the user. A larger C corresponds to assigning a higher penalty on the training error.
Figure 1a : Linearly separable case
Figure 1b : Non-linearly separable case
In order to solve this problem, the theory is extended to non-linear separating surface by mapping the input points onto a higher dimensional space where the training set become linearly-separable (Vapnik, 1998). : ℜm F x x And the new training set to be considered is xi , y i , which leads to a new version of the QPP where the dot product is substituted by K x , x ' =x .x ' : maximize
W = − N
subject to :
∑ i y i
1 2
N
N
∑ ∑ i j yi y j K xi , xj i=1 j=1
= 0
,
i=1
N
∑ i i=1
0 ≤ i ≤ C , ∀ i ∈ 〈1, N 〉
The symmetric function K is called “Kernel” and the classification solution is given by : f x =
N
∑ *i yi K xi , x b* i=1
with
*
*
b = yi− w . xi ,
for i / 0 i C
5
V International Conference on Forest Fire Research D. X. Viegas (Ed.), 2006
Hopefully, the important problem consisting in the expensive computation of the mapping Φ is avoided : we just need to know the value of the Kernel for any point of the input space and its computation is often easier than the mapping one. Given a symmetric positive Kernel K, Mercer's theorem (Vert, 2001 and Samuelides, 2004) implies the existence of such a mapping Φ. A kernel corresponds to a dot product in the feature space F. Here are the most frequently used kernels in practice, there are also classical kernels in remote sensing : – the polynomial kernel : K x , x ' = x . x ' 1 q . The more important the degree is, the more complex the resulting shape is. –
the Gaussian kernel : K x , x ' = exp
−∥x −x '∥ 2 2 2
. Almost any shape can be
obtained with this kernel. The smaller the parameter σ is, the more complex the resulting shape is. A third kernel has been tried recently : the wavelet kernel presented in Zhang et al. (2004): K x , x ' =
n
∏h i=1
x i −x ' i a
where h x = cos1.75 x exp−
x2 2
The main drawback of SVM is that the usual way to choose the best kernel and its parameters is to train different kernels and different parameters on the training set, and to test their efficiency on the dataset (using cross-validation technique for instance) in order to select the most suited one.
3. Experiments Data Set In France, the summer 2003 was by far one of the worst fire seasons of the last 20 years. Two southern France regions in which large fires occurred were selected in this study : the “massif des Maures” and the Lucéram area. The first area (about 16000 hectares burnt) was destroyed by forest fires, from mid July to the end of August 2003. SPOT5 satellite images are used in this paper, each of them providing three spectral bands (Green, Red and Near Infra-Red). For the first area, 2 images with a resolution of 2.5 metres were considered and were acquired a few days after the fire extinction.
6
V International Conference on Forest Fire Research D. X. Viegas (Ed.), 2006
For the second area, the 10-metre-resolution image was acquired two months after the fire extinction since clouds prevented the acquisition of good optical data just after the fire. In our experiments, three different algorithms have been tested for each image : the K-Means, the K-Nearest Neighbours and the SVM classifiers. The discrimination between burnt and unburnt areas is based on the spectral signature. As burnt and unburnt areas have different spectral response patterns, they can be clearly identified using remotely sensed data. Below is a brief overview of each technique : –
K-Means classifier : assigns a sample to the class whose center (also called centroid) is the nearest. On the contrary to SVM, it is an automatic algorithm as long as the number of classes is given.
–
K-Nearest Neighbours classifier (K-NN) : assigns a sample to the most represented category among its K nearest samples of the training set. As the SVM classifier, it is a supervised algorithm. The Euclidean distance is used by these two classifiers.
–
SVM classifier : As explained in the previous section, SVM perform the discrimination by finding the hyperplane which maximizes the margin between the positive and negative samples of the training set.
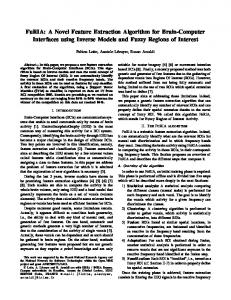
The success of the supervised techniques depends on the choice of the training set. Once the training data are chosen, SVM require the choice of a kernel and the regularization parameter C. As there are no general rules for the choice of the kernel, we consider in this paper three different kernels. Similarly, as there are no rules for the choice of the regularization parameter C and of the kernel parameters, different trials were realized to determine empirically the best parameters. For each case, the classification is based only on the spectral data and the spatial content is not used. The obtained results present some discontinuities. As the burnt areas are characterized by homogeneous and connected pixels, we improve the classification by regularizing it with a classical Markovian model (Potts) or with mathematical morphology. Figure 2 shows the extracted burnt areas given by the different classifiers for the Maures area and Figure 3 presents the ground truth provided by an expert. 7
V International Conference on Forest Fire Research D. X. Viegas (Ed.), 2006
(a)
(b)
(c) (d) Figure 2 : the Maures area (33*27 km) (a) : SPOT5 satellite image ©CNES 2003, Distribution SPOT Image, (b) extracted burnt areas with K-means, (c) extracted burnt areas with K Nearest Neighbours, (d) extracted burnt areas with SVM
Figure 3 : Ground Truth © SERTIT
8
V International Conference on Forest Fire Research D. X. Viegas (Ed.), 2006
(a)
(b)
(c) (d) Figure 4 : Luceram site (2.56*2.56 km) (a) : SPOT5 satellite image ©SILOGIC/CNES 2003, Distribution SPOT Image, (b) extracted burnt areas with K-means, (c) extracted burnt areas with K Nearest Neighbours, (d) extracted burnt areas with SVM
Figure 5 : ground truth © ONF-AM
9
V International Conference on Forest Fire Research D. X. Viegas (Ed.), 2006
SVM show a higher discrimination ability between burnt areas and non-burnt areas. They distinguish more easily lakes from scar fires. K Nearest Neighbours or K means techniques are less sensitive to features with closer spectral characteristic and do not discriminate burnt pixels from lake pixels. The extracted burnt areas are also compared to the official statistics which were derived from an interpretation of aerial images (Maures area) or from field observations (Lucéram site). Table 1 below summarizes the results in terms of classification accuracy and computational time provided by the different classifiers. Maures (1200*1000 pixels)
Ground
K means
KNN
Truth
SVM
SVM
SVM
polynomial
gaussian
wavelet
surface area 1 (ha)
1960
1517
1476
1517
1592
1572
surface area 2 (ha)
924
829
880
850
897
893
surface area 3 (ha)
12390
11001
11019
10837
11221
11207
computing time(s)
185
120
76
100
190
agreement (%)
95.87
96.13
95.91
96.51
96.47
false positives (%)
4.01
3.19
3.35
3.11
3.12
Table 1 : Performances of the different classifiers The areas 1,2 and 3 correspond to the burnt areas in the Maures area image from left to right and top to bottom. The different techniques show a good agreement with ground truths for the Maures area. Nevertheless, the results on the Lucéram site provide a lower agreement with the ground truth generated from field observations. There are severals reasons to explain these differences: – the boundaries were approximately delineated by flying over the area with an helicopter or by field checking. The topography of this area is hilly with steep slopes. – the time lag of two months between the fire extinction and the image acquisition. The burnt area spectral characteristics could have change during this period. (Chuvieco et al. 2005b) – some areas were classified as unburnt by the algorithms although they were marked as burnt on the ground truth. 10
V International Conference on Forest Fire Research D. X. Viegas (Ed.), 2006
This last point can be explained by the great spatial discontinuity of fire which implies small patches of unburnt vegetation within the perimeter and by the different responses of various types of vegetation after fires. Some areas affected by fire are not as damaged as other areas with different vegetation types and can not be discriminate by remote sensing. This explains the surface differences of the first Maures area. As for the areas n° 2 and 3, the surface differences are also caused by the miss-classification at the burnt area boundaries (mainly due to the registration problem between the satellite and ground truth images which do not have the same resolution). 4. Conclusion In this study, satellite-based remote sensing techniques were proposed to assess burnt areas after forest fires. While using a single after-fire image, we try to discriminate the burnt areas thanks to their spectral signature. Three techniques were used to perform the forest fire damage assessment. The obtained results allow to conclude that SVM are effective in terms of accuracy and computational cost. Comparing the experimental results with the ground truth, SVM is well suited for the burnt area mapping and give good results in terms of classification accuracies. The main drawback of the SVM is that they have to be trained several times to find the best parameters. Future works will improve the cartography by supplying other types of crucial information, such as human settlements (buildings, houses, roads) or healthy vegetation.
Acknowledgments The authors would like to thank SILOGIC for partial funding, the French Space Agency (CNES) for providing satellite images, and the SERTIT and the ONF-AM in France for providing ground truths. We also thank Commandant Poppi (fire brigade member and director of the cartography service – SDIS83, Draguignan, France) for interesting discussions.
References Barbosa, P.M., SanMiguel Ayanz J., Martinez B., Schmuck G., 2002. Burnt area mapping 11
V International Conference on Forest Fire Research D. X. Viegas (Ed.), 2006
in southern Europe using irswifs. Forest Fire Research & Wildland Fire Safety, Viegas (ed.). Millpress, Rotterdam Chuvieco E., Martin M.P., Palacios A., 2002, Assessment of different spectral indices in the rednearinfrared spectral domain for burned land discrimination. International Journal of Remote Sensing, vol. 23, n°23, 51035110. Chuvieco E., Ventura G., Martin M.P., 2005a, AVHRR multitemporal compositing techniques for burned land mapping. International Journal of Remote Sensing, vol. 26, n°5, 10131018. Chuvieco E., Ventura G., Martin M.P., Gomez I., 2005b, Assessment of mutitemporal compositing techniques of MODIS and AVHRR images for burned land mapping. Remote Sensing of Environment vol. 94, 450462. GonzalezAlonzo F., MerinodeMiguel S., GarciaGigorro S., RoldanZamarron A., Cueva J.M., Arino O., 2004, Mapping forest fire damage with Envisat. ESA bulletin 120, 2326. Melgani F., Bruzzone L., 2004, Classification of hyperspectral remote sensing images with Support Vector Machine. IEEE Trans. Geoscience and Remote Sensing, vol. 42, n°8, 1778 1790. Roli F., Fumera G., 2001, Support Vector Machines for remotesensing image classification. Image and Signal Processing for Remote Sensing VI, SPIE Proceedings, vol. 4170, 160166. Samuelides M., 2004, Réseaux neuronaux et apprentissage. Course at ENSAE, Toulouse, France. Sunar F., Ozkan C., 2001, Forest fire analysis with remote sensing data. International Journal of Remote Sensing, vol. 22, n°12, 22652277. Vapnik V., 1998, Statistical Learning Theory. John Wiley and sons, inc. Vert J.P., 2001, Introduction to Support Vector Machines and applications to computational biology. Course at ENSM, Paris, France. http://cg.ensmp.fr/~vert/research/semsvm/ Zhang L., Zhou W., Jiao L., 2004, Wavelet Support Vector Machine. IEEE Trans Systems, Man and Cybernetics, vol. 34, n°1, 3439. 12