X-Mem: A Cross-Platform and Extensible Memory Characterization Tool for the Cloud Mark Gottscho1,2 , Sriram Govindan3 , Bikash Sharma3 , Mohammed Shoaib2 , and Puneet Gupta1
[email protected], {srgovin, bsharma, moshoaib}@microsoft.com,
[email protected] 1 Electrical
Engineering Department, University of California, Los Angeles, USA 2 Microsoft Research, Redmond, WA, USA 3 Microsoft, Redmond, WA, USA
Abstract—Effective use of the memory hierarchy is crucial to cloud computing. Platform memory subsystems must be carefully provisioned and configured to minimize overall cost and energy for cloud providers. For cloud subscribers, the diversity of available platforms complicates comparisons and the optimization of performance. To address these needs, we present X-Mem, a new open-source software tool that characterizes the memory hierarchy for cloud computing. X-Mem is designed to be modular, portable, and extensible while surpassing most capabilities of existing utilities. The tool directly measures a number of statistics for throughput, (un)loaded latency, and power for each level of cache and DRAM through flexible stimuli. Its features include multi-threading, awareness of non-uniform memory architecture, and support for different page sizes. X-Mem can exercise memory using many combinations of load/store width, access pattern, and working set size per thread. The accessibility and extensibility of our tool also facilitates other research purposes. We demonstrate the utility of X-Mem through a series of experimental case studies using state-of-the-art platforms. Our results show how cloud subscribers could choose a preferred target platform and better optimize their applications even if the hardware/software stack is opaque. Cloud providers could use X-Mem to fine-tune system configurations and to verify machine performance envelopes before deployment. We envision novel ways that researchers could extend X-Mem for purposes such as the characterization of emerging memory architectures.
I. I NTRODUCTION By 2016, over 80% of enterprises are expected to adopt cloud computing [1], [2] because of its economic advantages. Cloud providers seek to minimize capital (CapEx) and operational (OpEx) expenses while satisfying a service-level agreement. Cloud subscribers want to extract maximum performance from their resources. These complementary objectives influence the entire hardware/software stack. The needs of cloud providers and subscribers particularly pressure the memory subsystem. From the provider’s perspective, memory procurement costs dominate CapEx, with 128 GiB of DRAM costing as much as $2000 per server [3]. In OpEx, up to 30 percent of total server power is consumed by memory [4], [5], [6]. For subscribers, application performance is dependent on the properties of the memory hierarchy, from CPU caches to DRAM [7]. Thus, careful characterization of the memory hierarchy is crucial for both the cloud provider and the subscriber to maximize the performance/cost ratio. However, existing memory characterization tools fail to meet AUTHORS' COPY February 6, 2016 To appear at the IEEE International Symposium on Performance Analysis of Systems and Software (ISPASS) Uppsala, Sweden, April 17-19, 2016
the following four functional requirements driven by cloud platforms. (A) Access pattern diversity. Cloud applications span many domains. They express a broad spectrum of computational behaviors, and access memory in a mix of structured and random patterns. These patterns exhibit a variety of readwrite ratios, spatio-temporal localities, and working-set sizes. Replication of these memory access patterns using controlled micro-benchmarks facilitates the study of their performance. This can be used by cloud providers to create cost-effective hardware configurations for different classes of applications, and by subscribers to optimize their applications. (B) Platform variability. Cloud servers are built from a mix of instruction set architectures (ISAs, e.g., x86-64 [8], [9] and ARM [10], [11]), machine organizations (e.g., memory model and cache configuration), and technology standards (e.g., DDR, PCIe, NVMe, etc.). They also include unique hardware capabilities, such as extended ISAs that feature vectorized loads and stores. Platforms also span a variety of software stacks and operating systems (OSes, e.g., Linux and Windows [8], [9]). The interfaces and semantics of OS-level memory management features such as large pages and non-uniform memory access (NUMA) also vary. In order to objectively cross-evaluate competing platforms and help optimize an application for a particular platform, a memory characterization tool should support as many permutations of these features as possible. (C) Metric flexibility. Both the subscriber’s applicationdefined performance and the provider’s costs depend on memory performance and power. These can be described using statistical distributions of several different metrics. For example, the distribution of DRAM loaded latency might be correlated with the distribution of search query latency in a heavily loaded server. Meanwhile, both the peak and average main memory power consumption are important metrics to the cloud provider, as they impact both CapEx and OpEx respectively. Memory power could also impact application performance indirectly due to a system-level power cap [12]. However, most characterization tools do not expose these flexible statistics or integrate memory power measurement. (D) Tool extensibility. Cloud platforms have changed considerably over the last decade and will continue to evolve in
Gottscho et al.
Tool STREAM v5.10 [13] STREAM2 v0.1 [14] lmbench3 [15] TinyMemBench v0.3.9 [16] mlc v2.3 [17] X-Mem v2.2.3 [18], [19]
X-Mem: A Cross-Platform and Extensible Memory Characterization Tool for the Cloud
Thru- Lat. Loaded Multi- NUMA Lrg. Power Cache & Native Native x86 x86-64 ARM Vector Open put Lat. Thrd. Pages Mem. Linux Win. Inst. Src. X X X X X X
X X X X
m m X X X
X X
X X
X X X
X
m m m X X X
X X X X X X
X X
X X X X X X
m m m m X X
m m m m X
Lang.
X
X X X X
C, FORTRAN FORTRAN C C
X
X
C++
ISPASS'16 (A) (B) (C) (D) Acc. Patt. Platf. Metric Tool Divers. Var. Flex. Extens.
X
X
X
X
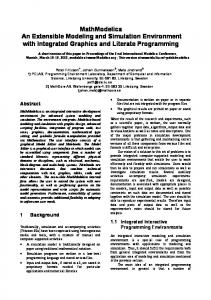
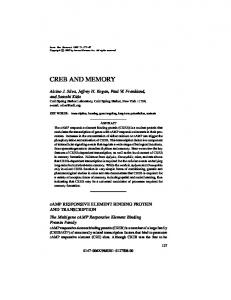
TABLE I: High-level feature comparison of X-Mem with other memory benchmarking tools. m indicates partial feature support. No existing tool provides the same breadth of capability as X-Mem.
With a broad scope that includes the cloud, there have been many studies that optimize memory systems. Memoryaware policies for dynamic voltage/frequency scaling (DVFS) of CPUs have been suggested [29], [30]. Many techniques for improving DRAM energy efficiency via scheduling and alternative hardware organizations [31], [32], [33], [34] have been explored. After Barroso and H¨olzle described the problem of memory energy proportionality [4], [5], other researchers recommended using DVFS for the memory bus as a solution [35], [36], [37], [38], [39]. Recently, researchers have taken a different angle, studying how to improve memory and cache energy by opportunistic exploitation of hardware manufacturing variations [40], [41], [42]. With regard to hardware variability, two studies are of particular interest. Chandrasekar et al. [43] described a novel procedure to optimize DDR3 timing parameters for DRAM modules. However, they did not discuss the application-level benefits of their approach. Adaptive-Latency DRAM (ALDRAM) [44] explored this idea further, evaluating it using a suite of benchmarks on a real system. However, the authors did not study the impact of variation-aware tuning on the memory performance itself. Without this low-level insight, it is unclear why applications benefit. We briefly revisit this question at the end of our third case study; our observations appear to contradict the conclusions in AL-DRAM [44]. Several existing micro-benchmark suites are available to quantify memory system performance. They include STREAM [45], [46], [13], STREAM2 [14], lmbench3 [15], TinyMemBench [16], and mlc [17]. We surveyed their capabilities that relate to the cloud-specific needs described earlier in Sec. I, namely: (A) access pattern diversity; (B) platform variability; (C) metric flexibility; and (D) tool extensibility. A high-level comparison of these tools’ features is shown in Table I. Intel’s Memory Latency Checker (mlc) [17] is the closest tool to XMem in terms of feature support, but like the others, does not address these four important requirements. Some relevant studies used custom micro-benchmarks to study certain aspects of cache and memory performance [47], [48], [49], [50]. Murphy et al. [51] proposed idealized analytical models to examine application sensitivity to memory bandwidth and latency in order to better address system bottlenecks. However, none of these works have described or released a tool suitable for use by others. X-Mem generally surpasses the capabilities of prior tools while being usable by the broader community. To the best of our knowledge, no previous work has created or used a memory characterization tool with the same breadth of features as XMem. We believe that our tool will make characterization and
the future. Emerging non-volatile memories (NVMs), such as phase-change memory (PCM), spin-transfer torque RAM (STTRAM), and resistive RAM (RRAM) [20], [21] introduce new capabilities and challenges that will require special consideration. The metrics of interest may also change with future applications and cloud management techniques. Unfortunately, most existing characterization tools are not easily extensible, hampering their usefulness in these scenarios. To address these four key requirements for both providers and subscribers of cloud services, we present X-Mem: an opensource, cross-platform, and eXtensible Memory characterization software tool written in C++. This paper includes the following contributions: • A description of the design philosophy and implementation details of X-Mem, that promotes the understanding of its functionality and facilitates rapid modifications by the research community. • A characterization of memory hierarchy performance, that demonstrates how cloud subscribers can optimize applications for the memory organization of a particular platform. • A comparison of memory hierarchies across seven different platforms, that shows how cloud subscribers can select the appropriate platform for their application. • An evaluation of system configurations on main memory performance, that helps cloud providers provision and finetune their systems for different applications. X-Mem source code, binaries, user manuals, programmer documentation, selected datasets, and various scripts are available online at https://nanocad-lab.github.io/X-Mem/ [18], [19]. The tool is being actively maintained and extended for ongoing research needs; the contents of this paper are based on “v2.2.3” of the software as documented online. II. R ELATED W ORK In this section, we summarize the pertinent literature on characterization and optimization of cloud platforms and memory systems. We then review current memory benchmarking tools and highlight how X-Mem extends the state-of-the-art. Several studies have evaluated the performance of cloudhosted applications [22], [23], [24]. Ferdman et al. [25] and Kozyrakis et al. [26] derived infrastructure-level insights by analyzing cloud-scale workloads. CloudCmp [27] contrasted the performance and cost of different providers’ platforms. Blem et al. [28] explored differences in CPU energy and performance as a function of the instruction set itself. However, none of these cloud studies focused on memory. 2
Gottscho et al.
X-Mem: A Cross-Platform and Extensible Memory Characterization Tool for the Cloud
evaluation studies easier to conduct in the future, while opening new avenues for exploration through its versatility, portability, and extensibility.
ISPASS'16
X-Mem
main ()
Operating System
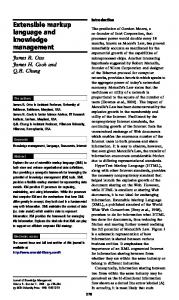
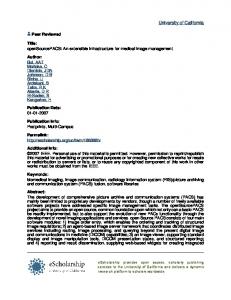
III. X-M EM : D ESIGN AND I MPLEMENTATION We now discuss the important design decisions and implementation details behind X-Mem. These are organized according to the four functional requirements for cloud platforms described in the introduction. The tool extensibility aspect is divided among subsections for access pattern diversity (Sec. III-A), platform variability (Sec. III-B), and metric flexibility (Sec. III-C). Fig. 1 depicts the high-level software organization that will be referred throughout the section.
Configurator
Benchmark Manager
Option Parser
Benchmark
Throughput Benchmark
Function Object Owner/ Function Caller Class Class Inheritance
Latency Benchmark
Delay-Injected Latency Benchmark (E) Thread Runnable
Memory Worker
A. Access Pattern Diversity The diversity of access patterns supported by X-Mem is important for characterizing and designing cloud systems. Even without writing custom extensions, users can often stimulate memory using a specific access pattern that resembles an important phase of application behavior. This can enable cloud subscribers to better optimize their code for the memory organization of their target platform. Cloud providers can use such functionality to evaluate candidate memory configurations for different classes of applications. Computer architects could even use X-Mem to evaluate memory system optimizations early in the design or prototyping phases without running a full application. At a high level, the user input causes a set of unique memory Benchmarks to be constructed by a global BenchmarkManager. The manager object generally allocates a large contiguous array on each NUMA node using a specified page size, and carves up the space as needed for each Benchmark. Benchmarks are run one at a time, where each is multi-threaded. There are two types of Benchmark: ThroughputBenchmark and LatencyBenchmark. Benchmarks can employ LoadWorker threads that measure memory throughput, and LatencyWorker threads to measure either loaded or unloaded latency, depending on whether other LoadWorker threads are running concurrently. Both workers types are descended from the MemoryWorker class. To ensure consistency of results, each benchmark must be primed before execution. To avoid OS interference, MemoryWorkers lock themselves to designated logical CPU cores and elevate their thread scheduling priority. The workers then prime their tests by running them several times before an official timed pass. This helps to accomplish three things: (i) the instruction cache is warmed up with the core benchmark code; (ii) the data cache(s) are warmed up with (part of) the working set; and (iii) the CPU is stressed sufficiently enough that it is likely in a high-performance state when the benchmark begins (e.g., maximum voltage/frequency setting). Each Benchmark gives its MemoryWorkers a pointer to an appropriate benchmark kernel function and a corresponding dummy benchmark kernel function. The dummy is used to quantify the overheads associated with the non-memory access parts of the benchmark kernel function, which may include the function call and sparse branch instructions. During
Load Worker Delay-Injected Benchmark Kernel Functions (E)
Power Reader
Latency Worker
Timers
Windows DRAM Power Reader (E)
Benchmark Kernel Functions
Hardware Fig. 1: The high-level X-Mem software organization facilitates portability through rigid OS/hardware abstractions. Its modular design enables simple prototyping of extended capabilities (E).
a benchmark, each MemoryWorker repeatedly executes its benchmark kernel function until the cumulative elapsed time reaches a target raw duration, Traw , which is configurable at compile-time and defaults to 250 ms. The number of iterations of the benchmark kernel function is recorded; the dummy benchmark kernel function is repeated for same number of times. The execution time for the dummy kernel Tdummy is subtracted from Traw to obtain the worker’s final adjusted time, Tadjusted . Each benchmark kernel accesses exactly 4 KiB of memory before returning. This allows the function caller to measure the throughput/latency distribution of the memory access pattern over many chained iterations, regardless of the thread’s working set size, which might vary from KiBs to GiBs. The decision to use 4 KiB per function call is a compromise between precision, accuracy, flexibility, and overhead. It provides sufficiently fine granularity to benchmark small L1 caches and avoids crossing typical page boundaries. At the same time, it is large enough to keep the function overhead low and to be accurately captured with high resolution timers. X-Mem’s low-level benchmark kernel functions include many different memory access patterns. Each of these global kernel functions implements a unique combination of the following: (i) type, currently pure-load or pure-store; (ii) structure, which currently include sequential, strided, and purely random addressing; and (iii) chunk size, which is the access width for a single memory instruction. X-Mem presently supports strides in both forward and reverse directions, with lengths of ±{1, 2, 4, 8, 16} chunk multiples. We currently include four
3
Gottscho et al.
X-Mem: A Cross-Platform and Extensible Memory Characterization Tool for the Cloud
chunk sizes in the standard release of X-Mem as of v2.2.3: 32, 64, 128, and 256 bits wide. Unsupported chunk sizes for each platform are disabled. The random access benchmark kernel functions (used by the LatencyWorker as well as some LoadWorkers) were implemented as a pointer-chasing scheme that creates a chain of dependent reads to random addresses. This forces only one memory request to be outstanding at a time, ensuring that the average access latency can be accurately measured over many chased pointers. In this work, the chain is constructed by initializing a contiguous array of pointers to all point at themselves and then randomly shuffling the array. An alternative technique is to construct a random Hamiltonian Cycle of pointers. Both techniques are O(N), but the random shuffle approach ran much faster on our machines. However, with the random shuffle method, a series of pointers may occasionally form a small cycle that “traps” the kernel function, effectively shrinking the intended working set size. This can cause incorrect results but can be mitigated by using multiple iterations or by using the Hamiltonian Cycle technique instead. Nevertheless, in most cases, the latency measurements generated using the two methods are indistinguishable. The number of unique micro-benchmarks is many times greater than the 88 currently-included benchmark kernel functions would suggest. For instance, the user may specify the number of worker threads for each micro-benchmark. Each thread can have a different memory region working set size and kernel benchmark function. These working set regions can be allocated in a NUMA-aware fashion with configurable page size and adjustable alignment. It is also possible for groups of worker threads to use overlapped memory regions. Although X-Mem currently implements a diverse set of memory access patterns, the tool may see uses beyond the case studies presented in this paper. Thus, we designed the tool to allow for the addition of new access patterns with minimal modifications. We believe this is a key requirement for cloud providers that host diverse third-party applications and also for the subscribed application developers. Rich functionality can be added by merely writing a few extra specialized benchmark kernel functions. To leverage these, developers can lightly modify existing derivations of the Benchmark and MemoryWorker classes to use their new kernels, or write their own derived classes. A simple extension might support wider vector memory instructions such as AVX-512 [52]. This could be done with a new 512-bit chunk size option and copying and modifying the existing 256-bit benchmark kernels to use the wider instructions and registers. In another example, the standard X-Mem release includes a third derived Benchmark type: the DelayInjectedLatencyBenchmark. This class implements a special version of the multi-threaded loaded LatencyBenchmark, where the LoadWorker use slightly modified benchmark kernel functions with nop instructions interspersed between memory access instructions. This has proven useful for characterizing main memory latency when subjected to a wide range of load traffic. More radical extensions are also possible with relatively little effort. Specialized access patterns for benchmarking translation-
ISPASS'16
lookaside buffer (TLB) performance or measuring inter-cache communication latency with variable load interference can be built on top of the existing codebase. For security research, a small benchmark kernel can be added that performs Rowhammer-like DRAM attacks [53], [54]. A memory power “virus” might be written to test server power capping techniques. Benchmarks for characterizing data dependence of memory power [40] and performance could be crafted. B. Platform Variability To help cloud subscribers gain insight on various platforms, we designed X-Mem to support different combinations of hardware and software. X-Mem currently runs on many cloudrelevant platforms that span different ISAs, hardware features, and OSes. Currently supported architectures include x86, x8664 with optional AVX extensions, ARMv7-A with optional NEON extensions, and ARMv8 (64-bit). GNU/Linux and Windows are currently supported on each architecture. X-Mem abstracts OS and hardware-specific interfaces and semantics wherever possible. Two classic C/C++ language features were used to achieve this: (i) typedef is used to abstract ISA-specific datatypes for vector-based wide memory access, and (ii) pre-processor macros that guard OS or architecturespecific code. In addition to language features, X-Mem wraps OS APIs. For example, generic functions are used to pin worker threads to logical cores and to elevate thread priority. However, X-Mem cannot control the semantics of these OS services. Whenever they cannot be controlled, the tool is clear to the user and programmer about possible sources of deviation in reported results. Each benchmark kernel function and its dummy had to be carefully hand-crafted to stimulate memory in a “correct” manner for characterization on each platform. Whenever possible, the implementations of the benchmark kernel functions use several tricks to defeat compiler optimizations in the important sections of code without resorting to un-portable inline assembly. Two examples include manual loop unrolling to control branching overheads, and the use of the volatile keyword to keep the compiler from pruning away “meaningless” memory reads and writes that are critical to benchmark correctness. The execution time for an unrolled loop of benchmark kernels is measured using X-Mem’s start_timer() and stop_timer() functions. Internally, these functions use a high-resolution timer, whose implementation is specified at compile-time as an OS-based or hardware-based timer. Hardware timers are less portable, even for the same ISA, but they enable finer-grain timing for very short routines. Our testing has shown that for the default Traw = 250ms benchmark duration, there is no measurable difference between hardware and OS timers in X-Mem. OS timers are used by default to aid portability, although this option and Traw can be easily changed at compile time. The tool generates results as fairly as possible to allow for “apples-to-apples” comparisons of memory systems. We use Python-based SCons [55] to simplify the build process and maximize portability. On GNU/Linux builds, we verified that the g++ compiler generates the intended code on each platform 4
Gottscho et al.
X-Mem: A Cross-Platform and Extensible Memory Characterization Tool for the Cloud
ISPASS'16
distribution over time. We consider this a useful feature for evaluating interference effects, as concurrent execution of other applications on the platform can influence the measurement of unloaded latency. In the absence of interference, by the central limit theorem, we expect the per-iteration results to approach a normal distribution. However, if there time-varying interference, the distribution can shift. For example, a second application can begin accessing DRAM heavily halfway through an X-Mem benchmark, which might add noise to XMem’s active measurement of DRAM latency. The transient effects of this interference can be captured up to the resolution of a single benchmark iteration. This is on the order of 10s to 100s of milliseconds. The tool can be easily modified to trade off sampling accuracy for higher iteration sampling rates by adjusting Traw at compile time. Performance metrics are captured as follows. Memory throughput is reported in MiB/s by accumulating the results from all LoadWorker instances that execute concurrently. The unloaded latency metric is reported in ns/access without any other MemoryWorkers executing. For loaded latency, results are reported in ns/access from the LatencyWorker given a concurrent load stimulus driven by LoadWorkers and reported in MiB/s. With regard to power metrics, average and peak numbers are indirectly measured for each benchmark iteration (sample). To achieve this, X-Mem provides the virtual PowerReader class as an interface that needs to be implemented for each a specific system. PowerReader executes a low-overhead background thread that regularly polls the power consumption of the memory during benchmark execution at a fixed sampling rate. The implementation of the PowerReader interface is left as an extended feature, as power instrumentation varies widely between systems and end-user needs often differ. By default, X-Mem includes the WindowsDRAMPowerReader extension, which leverages a generic software power meter exposed by the OS. On our Server platform evaluated later in the paper, this meter relies on architecture-dependent Intel RAPL features to expose total DRAM power per socket. One could also implement PowerReader by using a dedicated hardware multimeter for each DIMM [40], [41], improving measurement accuracy, precision, and granularity. X-Mem can be easily extended to add new metrics of interest. For example, STT-RAM can have data-dependent energy consumption. It might be characterized in a novel way by using new data-based benchmark kernels along with dataaware power book-keeping. Systems with PCM could have their endurance and wear-leveling mechanisms [56] tested with a specialized load generator. Thus, our tool is flexible enough to suit specific needs of cloud providers and subscribers.
by disassembling and inspecting the X-Mem executables. On Windows builds, the Visual C++ compiler cannot generate AVX instructions for our variables that were intentionally tagged with the volatile keyword. On the other hand, it also does not support inline assembly code for an x86-64 target. Thus, on Windows/x86-64/AVX-specific builds, we were forced to implement all SIMD-based benchmark kernels by hand in the assembler. Nevertheless, compiled code and our manual implementations were nearly identical. We also verified the equivalence of benchmark results experimentally. Ports to other OSes and architectures are possible with relatively straightforward extensions to X-Mem’s source code and build toolchain, thanks to its heavy use of abstractions. Many platform-specific features can be enabled or disabled at compile time through the use of included preprocessor switches. C. Metric Flexibility X-Mem can measure performance and power of the memory hierarchy, where a number of statistics can be recorded for each of X-Mem’s diverse access patterns. X-Mem currently reports on several application-visible performance categories such as unloaded latency (no background traffic), loaded latency (variable controlled background traffic) and aggregate throughput. It can also sample memory power during stimulated performance benchmarking. Measurements can be made for each level of the memory hierarchy, from CPU caches all the way to main memory. X-Mem’s metric flexibility is useful to both cloud subscribers and providers in quantifying subtle hardware characteristics. For example, a programmer working on a search application could find that the distribution of DRAM loaded latency is strongly correlated with the distribution of query latency. Such an insight would not be possible to achieve with only the arithmetic mean of memory latency. Specifically for cloud providers, average power can be used for optimizing performance per Watt, and peak power can be used for power provisioning purposes [12]. With regard to performance benchmarking, X-Mem actively stimulates memory and measures the real behavior of the hierarchy as could be seen by an application running on the CPU. The metrics capture the overall impact of the underlying platform architecture and associated configuration settings on performance, but low-level secondary effects are not disaggregated. This is distinct from a passive performance counter-based approach, which is better suited to breaking down individual performance components, but often cannot make end-to-end measurements. We believe the active stimulation method used by X-Mem is a more useful measurement approach for the cloud usage model, which is concerned primarily about ground truth memory hierarchy performance from the application’s point of view. It also has the benefit of being much more flexible and portable than approaches that rely on modelspecific performance counters. Each user-visible benchmark iteration is composed of many passes. For each iteration, X-Mem maintains the arithmetic mean of the relevant metrics. If the benchmark is run for more than one iteration, these extra samples track the metric’s
IV. E XPERIMENTAL P LATFORMS AND VALIDATION In this section, we describe the experimental platforms used in the rest of the paper and validate our tool. We picked seven systems to highlight the applicability of X-Mem to various platforms that may be used in the cloud. The details of each system are shown in the top half of Table II. The systems span different ISAs (x86-64 and ARMv7), OSes (Windows 5
Gottscho et al.
X-Mem: A Cross-Platform and Extensible Memory Characterization Tool for the Cloud
System Name
ISA
CPU
Desktop
x86-64 w/ AVX x86-64 w/ AVX2
Intel Core i7-3820 (Sandy Bridge-E) Dual Intel Xeon E5-2600 v3 series (Haswell-EP) Intel Atom S1240 (Centerton)
Server
Microserver
x86-64
PandaBoard (ES) ARMv7-A w/ NEON AzureVM x86-64 AmazonVM ARMServer
System Name
TI OMAP 4460 (ARM Cortex-A9) AMD Opteron 4171 HE x86-64 Intel Xeon E5-2666 v3 w/ AVX2 (Haswell-EP) ARMv7-A Marvell Armada 370 (ARM Cortex-A9)
Config. Name
Desktop* 1333 MT/s, Nominal Timings 4C Desktop 1333 MT/s, ≈33% Slower Timings 4C 800 MT/s, Nominal Timings 4C Desktop Desktop 800 MT/s, ≈33% Slower Timings 4C 1333 MT/s, Nominal Timings 1C Desktop Desktop 1333 MT/s, ≈33% Slower Timings 1C 800 MT/s, Nominal Timings 1C Desktop Desktop 800 MT/s, ≈33% Slower Timings 1C Server* 1333 MT/s, Nominal Timings Server 1333 MT/s, ≈33% Slower Timings 1600 MT/s, Nominal Timings Server 1600 MT/s, ≈33% Slower Timings Server 1867 MT/s, Nominal Timings Server 1867 MT/s, ≈33% Slower Timings Server
No. Cores CPU Freq. 4
2
1.6 GHz
2
1.2 GHz
4
2.1 GHz
4
2.9 GHz
4
1.2 GHz
Memory Type
No. Channels
DDR3 DDR3 DDR3 DDR3 DDR3 DDR3 DDR3 DDR3 DDR3 DDR3 DDR3 DDR3 DDR3 DDR3
U U U U U U U U R R R R R R
L1$
L2$
L3$
split, private, 32 KiB, 8-way split, private, 32 KiB, 8-way
private, 256 KiB, 8-way private, 256 KiB, 8-way
shared, 10 MiB, 20-way shared, 30 MiB, 20-way
64 B
32 nm
Linux
64 B
22 nm
Win.
split, private, private, 24 KiB 6-way data, 512 KiB, 8-way 32 KiB 8-way inst. split, private, shared, 32 KiB, 4-way 1 MiB split, private, private, shared, 64 KiB, 2-way 512 KiB, 16-way 6 MiB, 48-way split, private, private, shared, 32 KiB, 8-way 256 KiB, 8-way 25 MiB, 20-way split, private, private, 32 KiB, 4/8-way (I/D) 256 KiB, 4-way
64 B
32nm
Win.
32 B
45 nm
Linux
64 B
45 nm
Linux
X
64 B
22 nm
Linux
X
32 B
unk.
Linux
unk.
3.6 GHz*, 1.2 GHz 2.4 GHz
12 per CPU
4 4 4 4 4 4
4 4 4 4 1 1 1 1 per CPU per CPU per CPU per CPU per CPU per CPU
ISPASS'16
DPC RPD 2 2 2 2 2 2 2 2 1 1 1 1 1 1
2 2 2 2 2 2 2 2 2 2 2 2 2 2
DIMM Chan. Capacity MT/s 2 GiB 2 GiB 2 GiB 2 GiB 2 GiB 2 GiB 2 GiB 2 GiB 16 GiB 16 GiB 16 GiB 16 GiB 16 GiB 16 GiB
1333 1333 800 800 1333 1333 800 800 1333 1333 1600 1600 1867 1867
$ Blk. Process
nCAS - clk (tCAS - ns)
nRCD - clk (tRCD - ns)
9 (13.5 ns) 12 (18.0 ns) 7 (17.5 ns) 10 (25.0 ns) 9 (13.5 ns) 12 (18.0 ns) 7 (17.5 ns) 10 (25.0 ns) 9 (13.5 ns) 12 (18.0 ns) 11 (13.75 ns) 15 (18.75 ns) 13 (13.92 ns) 18 (19.28 ns)
9 (13.5 ns) 12 (18.0 ns) 7 (17.5 ns) 10 (25.0 ns) 9 (13.5 ns) 12 (18.0 ns) 7 (17.5 ns) 10 (25.0 ns) 9 (13.5 ns) 12 (18.0 ns) 11 (13.75 ns) 15 (18.75 ns) 13 (13.92 ns) 18 (19.28 ns)
OS
nRP - clk (tRP - ns)
NUMA ECC
X
X
X
nRAS - clk (tRAS - ns)
11 (16.5 ns) 24 (36.0 ns) 15 (22.5 ns) 32 (48.0 ns) 8 (20.0 ns) 16 (40.0 ns) 11 (27.5 ns) 22 (55.0 ns) 11 (16.5 ns) 24 (36.0 ns) 15 (22.5 ns) 32 (48.0 ns) 8 (20.0 ns) 16 (40.0 ns) 11 (27.5 ns) 22 (55.0 ns) 9 (13.5 ns) 24 (36.0 ns) 12 (18.0 ns) 32 (48.0 ns) 11 (13.75 ns) 29 (36.25 ns) 15 (18.75 ns) 38 (47.5 ns) 13 (13.92 ns) 34 (36.42 ns) 18 (19.28 ns) 46 (49.27 ns)
TABLE II: Top: platforms used for X-Mem validation and case studies. Bottom: main memory configurations for the Desktop and Server platforms, where * indicates our default setting. Average DRAM Latency (ns/access)
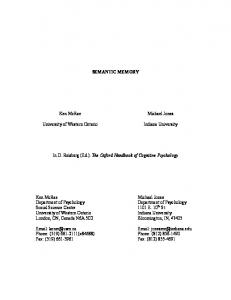
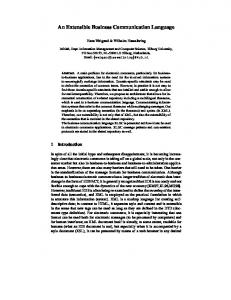
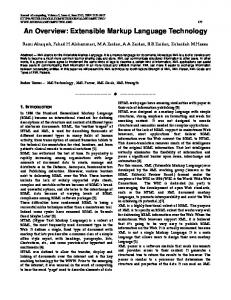
and GNU/Linux), power budgets (wimpy and brawny systems), and virtualization (bare metal and VM). These platforms are: a Desktop workstation; a many-core rack-mountable cloud Server; a low-power x86 Microserver; an ARM PandaBoard ES [57]; an Azure cloud VM (AzureVM) [8]; an Amazon EC2 cloud VM (AmazonVM) [9]; and a Scaleway bare metal ARM cloud microserver (ARMServer) [10]. On Intel-based platforms, HyperThreading (SMT) and TurboBoost (DVFS) were disabled in the BIOS to obtain consistent results across multiple runs of X-Mem. The bottom half of Table II describes the main memory configurations used for the Desktop and Server. They are used to illustrate the impact of tuning various main memory parameters on performance in Case Study 3. We validated X-Mem against a variety of tools on several platforms wher applicable. For instance, we compare against Intel’s Memory Latency Checker (mlc) v2.3 [17] for loaded DRAM latency. We choose mlc because it is a tool that has the most overlap in capabilities (see Table I). We use our Desktop with configuration 1333 MT/s, Nominal Timings 4C* at 3.6 GHz, running both Linux and Windows. The validation results are shown in Fig. 2, which shows the average total main memory latency versus the aggregate read-based memory load. We find close agreement in these results as well as other closely-matched tests that are not depicted. However, mlc is less portable, because it relies on Intel’s proprietary hardware performance counters that may not be available in other systems. No existing tool supports the majority of XMem’s other features that might be validated.
200
X-Mem v2.2.2 (Linux) X-Mem v2.2.2 (Windows, Large Pages) mlc v2.3 (Linux) mlc v2.3 (Windows)
150 100 50 0 0
10000
20000
30000
Average DRAM Read Load Throughput ( MiB/s)
Fig. 2: Validation of X-Mem vs. mlc [17] shows close agreement for total loaded latency measurements from CPU to DRAM on both Windows and Linux.
V. C ASE S TUDY E VALUATIONS In this section, we leverage X-Mem’s four key features – diverse access patterns, platform variability, flexible metrics, and tool extensibility – to present a trio of experimental case studies. The first two cover uses of X-Mem for cloud subscribers, while the last case study addresses cloud providers. A. Case Study 1: Characterization of the Memory Hierarchy for Cloud Subscribers Cloud subscribers would benefit from understanding the memory hierarchy of their platform. X-Mem facilitates this by mapping the memory performance with respect to application parameters such as number of threads, working set size, access patterns/granularity, and OS memory management policies. 6
X-Mem: A Cross-Platform and Extensible Memory Characterization Tool for the Cloud
L3
L2
L1
800
DRAM
(Shared)
Average'Main'Memory'Total' Latency'(ns/access)
Gottscho et al.
Sandy Bridge: 256b loads under-perform 128b in caches but not DRAM 450000
Average Aggregate Read Throughput (MiB/s)
400000
L3 thread sharing effect
350000 300000 250000 200000 150000 100000 50000 0
256 MiB
64 MiB
128 MiB
32 MiB
8 MiB
16 MiB
4 MiB
2 MiB
512 KiB
1 MiB
256 KiB
64 KiB
128 KiB
32 KiB
16 KiB
8 KiB
4 KiB
Average'Read' Throughput'(MiB/s)
256(bit,Loads
120000 100000 80000
Cache read port is 128 bits wide
40000 20000 0 1
2
4
8
400 300 200 100
10000 20000 30000 40000 Average'Main'Memory'Read'Throughput'(MiB/s)
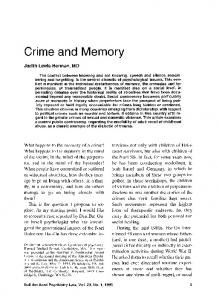
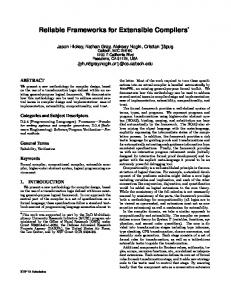
and a working set size of just 4 KiB, we swept the chunk size and stride length (as a multiple of load chunk size). The results are shown in Fig. 3(b). We present three observations. (i) Observing the drops in throughput as a function of chunk and stride reveals the cache block/line size (64 B). (ii) AVX 256-bit reads using the vmovdqa instruction perform no better than the 128-bit version for normal sequential accesses. Unlike the other chunk sizes, the 256-bit accesses maintain their performance as stride length increases. This suggests that a cache port is just 128 bits wide, and 256-bit accesses are simply split into two µ-ops. (iii) L1D bandwidth can only be saturated using vectorized loads. Thus, for workloads that are already cachefriendly, further performance gains might be achieved through explicit SIMD memory-access optimization. X-Mem enables similar observations in the absence of public information on the micro-architecture. In addition to the hardware factors described thus far, OS memory management affects performance. To study this, we use a dual-socket NUMA Server platform running Windows that is typical of a cutting-edge cloud deployment. Fig. 4 shows the interaction of NUMA and page size on the loaded latency trend of main memory. We present three observations. (i) The cross-socket QPI link forms a performance bottleneck for both memory latency and bandwidth. The latency curves stay flat until the load approaches the peak theoretical bandwidth, where queuing and contention begin to dominate delay, resulting in a latency wall. Remote access (triangles) incurs a latency penalty compared to local access (circles) even when there is no bandwidth starvation. (ii) Large 2 MiB pages (pink points) reduce latency overall compared to regular-sized 4 KiB pages (black and gray points) due to reduced thrashing of the TLBs. (iii) For regular-sized pages, the two NUMA nodes have asymmetric local memory access latency. CPU node 0 (black points) has better latency than node 1 (gray points). This suggests that page tables are stored on NUMA node 0 in Windows. For applications running on NUMA systems where large pages are not feasible, this could become a significant performance limitation. These three observations support the push for NUMA-aware cloud platforms [58]. Moreover, subscribers should consider using large page sizes for memory-bound applications. If this is not possible, then it may be preferable to use NUMA node 0
256-bit reads are 2x 128-bit reads, don’t suffer from striding Drops occur at 64 B strides, revealing block size
60000
500
Fig. 4: X-Mem reveals how significant main memory performance asymmetry may arise from the interaction of NUMA and page size. Results shown are for the Windows Server with configuration 1333 MT/s, Nominal Timings*.
(a) Memory hierarchy landscape
128(bit,Loads
600
0
Private Working Set Size Per Thread
64(bit,Loads
1333*MT/s*4C*Bound CPU*Node*0,*Memory*Node*0 CPU*Node*1,*Memory*Node*0 CPU*Node*0,*Memory*Node*1 CPU*Node*1,*Memory*Node*1 Local*Memory*(Large*Pages) Remote*Memory*(Large*Pages) 2x*8*GT/s*QPI*Bound
700
0
12 32 8b 12 b ( (4T 32 8b ( 4T) ) 3T 12 b ( 32 8b 3T ) ) 12 b ( (2T e 32 8b ( 2T) ) Siz ) b ( 1 k ds 1T T ) un rea ) h C Th (#
32(bit,Loads
ISPASS'16
16
Stride'Length'(In'Multiples'of'Load'Width)
(b) Strided L1D cache behavior with 1 thread
Fig. 3: Cache organization insights obtained using X-Mem can help cloud subscribers optimize application performance. The results shown are for the Sandy Bridge-E Desktop with config. 1333 MT/s, Nominal Timings 4C* at 3.6 GHz.
This procedure can reveal the underlying cache and memory hardware organization, allowing the programmer to exploit it. We propose an intuitive visualization technique, the memory landscape, that depicts the aggregate memory throughput or latency as a surface plot over working set size per thread, number of threads, and chunk size. Fig. 3(a) shows the throughput landscape using a forward sequential read access pattern on the Desktop workstation. We make several observations. (i) Throughput falls off with increasing working set size (x axis), leaving a clear demarcation of cache/DRAM boundaries (labeled at the top of the figure). (ii) L1 and L2 throughput scales linearly with the number of threads (y axis). This confirms that the smaller caches are private to each core. In contrast, the sharing of the L3 cache among cores is illustrated by the outline of the “foothills” next to the flat DRAM “plain”. (iii) DRAM performance scales linearly with number of threads and chunk size (y axis).Such visualization enables programmers to reason about the general memory performance of their target cloud platform. Another important consideration for programmers is the cache configuration, which could be hidden by the provider. We focus on the L1 data cache (L1D) of the Sandy Bridge-based Desktop as an example. Using X-Mem with a single thread 7
X-Mem: A Cross-Platform and Extensible Memory Characterization Tool for the Cloud
1000
PandaBoard
Microserver
AzureVM
10 Desktop
Server AmazonVM
256 MiB
64 MiB
128 MiB
32 MiB
8 MiB
16 MiB
4 MiB
2 MiB
1 MiB
512 KiB
64 KiB
128 KiB
32 KiB
8 KiB
16 KiB
256 KiB
Brawny group
1
Working Set Size
Average Main Memory Total Latency (ns/access)
(a) Unloaded latency across cache levels in the memory hierarchy
300 200 100 0 1
10
100
1000
10000
100000
Average Main Memory Read T hroughput (MiB/s) Server* PandaBoard AmazonVM
Desktop* ARMServer
ISPASS'16
for interference from other cloud subscribers nor server-toserver heterogeneity in the datacenter; we repeated our experiments several times to ensure that our measurements were consistent over time. An important step in choosing a suitable cloud platform is to understand the subtleties in memory hierarchy performance, which is heavily influenced by the cache organization (as discussed in Case Study 1). We examine average unloaded latency of each cache level by sweeping the working set size, which works even on virtualized hardware or if the cloud provider deliberately hides the specification. Fig. 5(a) illustrates the results for all seven platforms. We find that the brawny high-power systems (Desktop/Server/AzureVM/AmazonVM) and the wimpy low-power systems (Microserver/PandaBoard/ARMServer) form latency clusters, with considerable variation within each group. The Desktop and ARMServer slightly outperform their intra-group rivals at all cache levels. This is because they feature fewer cores and higher clock frequencies than their peers, but their cache sizes are not the largest. With regard to virtualization, the latency of AmazonVM does not suffer in comparison to its bare metal Server counterpart, which has near-identical CPU hardware (differences arise in clock frequencies, number of cores, and effective L3 cache size). AzureVM’s weaker showing is due to its much older hardware; it is possible there are more competitive VM instances in Azure that we did not receive. These hardware insights may be important to a programmer who only needs a few cores for an application that prefers fast cache access over capacity. In addition to helping subscribers choose an appropriate platform, X-Mem can help detect any performance heterogeneity across VM instances from a single provider. The loaded latency of main memory is especially important in a cloud setting, where interference can play a significant role in application performance. Fig. 5(b) depicts results for our seven example platforms (x-axis in log scale). Again, performance falls into the same two clusters: brawny and wimpy. We make two observations. (i) The location of the latency wall varies drastically across platforms. The large latency gap between the low power Microserver and the other brawnier Intel systems is primarily due to its low clock frequency and also its in-order core design. Although the PandaBoard has better unloaded cache latency than the Atom-based Microserver, the former cannot match the latter’s DRAM peak throughput or loaded latency curve. (ii) While the Server hits a steep latency wall, the other systems do not saturate as severely. This can be attributed to the balance between CPU performance (e.g., clock frequency and the number of cores) and memory performance (e.g., peak channel bandwidth and rank/bank-level parallelism). For memory-intensive multi-threaded or multiprogrammed workloads, the Server system would benefit from higher DDR frequencies. Thus, X-Mem’s ability to characterize the latency wall can be useful to cloud subscribers, who should choose platforms with an appropriate balance of performance. They could also use X-Mem’s latency measurement capabilities to quantify the extent of cross-VM memory interference that results in performance inconsistency.
ARMServer
Wimpy group
100
4 KiB
Average Latency (ns/access)
Gottscho et al.
Microserver AzureVM
(b) Loaded latency trends for main memory DRAM
Fig. 5: X-Mem enables general cross-platform comparisons of cache and memory latency to help subscribers choose suitable providers for their applications. Results shown are for our seven diverse example systems.
to obtain better memory performance (at least under Windows). In this case study, X-Mem revealed micro-architectural and OS factors in memory performance for our Desktop and Server, enabling us to make recommendations for applications written for our particular platforms. In a similar fashion, cloud subscribers can apply X-Mem to their own platforms of interest and derive their own relevant insights to help optimize application performance. B. Case Study 2: Cross-Platform Insights for Cloud Subscribers In this case study, we demonstrate X-Mem’s ability to characterize the memory hierarchy of diverse platforms with a single tool. This is useful to cloud subscribers, who need to evaluate alternative platform choices as objectively as possible. We compare general performance aspects of caches and main memory across our seven platforms listed in Table II, exposing the differences in (i) caches and main memory unloaded latency, (ii) main memory loaded latency, and (iii) read/write behavior among the systems. In our two public cloud virtual machines (AzureVM and AmazonVM), we had no way to directly control 8
Gottscho et al.
X-Mem: A Cross-Platform and Extensible Memory Characterization Tool for the Cloud
ISPASS'16
Mem. Channel Frequency → 1867 MT/s 1867 MT/s 1600 MT/s 1600 MT/s 1333 MT/s 1333 MT/s 800 MT/s 800 MT/s Platforms ↓ Timings → Nom. ≈ 33% Slow Nom. ≈ 33% Slow Nom. ≈ 33% Slow Nom. ≈ 33% Slow Server (NUMA Local, Lrg. Pgs.) Server (NUMA Remote, Lrg. Pgs.) Desktop 4C @ 3.6 GHz Desktop 1C @ 3.6 GHz Desktop 4C @ 1.2 GHz Desktop 1C @ 1.2 GHz
91.43 126.51 -
91.54 128.54 -
91.66 129.62 -
95.74 139.25 -
91.99* 133.59* 73.33* 72.38 109.65 108.44
97.61 141.69 81.91 80.94 118.25 117.09
97.21 97.36 131.86 131.85
110.89 109.56 145.76 144.46
TABLE III: Sensitivity of unloaded main memory latency (in ns/access) with respect to various frequencies and timing parameters, enabled by X-Mem. Timing parameters have the greatest effect on unloaded latency when the CPU is fast and the memory bus is slow. 800 Average' Main'Memory' Total' Latency' (ns/access)
Finally, X-Mem can help reveal important performance aspects of memory read and write behavior that vary among platforms. The results are not illustrated for brevity. From our analysis, we make two observations. (i) The PandaBoard featured nearly flat write throughput across the memory hierarchy, only outperforming reads for large working sets in DRAM. This indicates a combination of write-through and write-around cache policies. The other systems did not exhibit this effect. Instead, X-Mem revealed their write-back and write-allocate cache policies. (ii) Our Intel systems exhibited a 2:1 read to write peak throughput ratio throughout the memory hierarchy; this means they have half as many L1 write ports as read ports. Such kinds of observations, enabled by X-Mem, can help cloud subscribers understand the strengths and weaknesses of different memory hierarchies, helping them to choose the right platform for their read/write patterns. Having a single cross-platform memory characterization tool facilitates the direct comparisons in this case study, aiding cloud subscribers to choose the right provider for their application. Such decisions are not trivial. For instance, memory latencysensitive and throughput-sensitive applications may be suited to different platforms. We believe X-Mem helps to fulfill this important role.
1333* MT/s*4C*Bound 1333* MT/s,*Nominal* Timings* 4C* 1333* MT/s,*~33%*Slower*Timings* 4C 800*MT/s*4C*Bound 800*MT/s,*Nominal* Timings* 4C 800*MT/s,*~33%*Slower*Timings* 4C 1333* MT/s*1C*Bound 1333* MT/s,*Nominal* Timings* 1C 1333* MT/s,*~33%*Slower*Timings* 1C 800*MT/s*1C*Bound 800*MT/s,*Nominal* Timings* 1C
700 600 500 400 300 200 100 0 0
5000
10000
15000
20000
25000
30000
35000
40000
45000
Average' Main'Memory' Read'Throughput'(MiB/s)
Average Local Main Memory Total Latency (ns/access)
(a) Desktop @ 3.6 GHz 500
1867 MT/s 4C Bound 1867 MT/s, Nominal Timings 1867 MT/s, ~ 33% Slower Timings 1600 MT/s 4C Bound 1600 MT/s, Nominal Timings 1600 MT/s, ~ 33% Slower Timings 1333 MT/s 4C Bound 1333 MT/s, Nominal Timings* 1333 MT/s, ~ 33% Slower Timings
450 400 350 300 250 200 150 100 50 0 0
10000
20000
30000
40000
50000
60000
Average Local Main Memory Read Throughput (MiB/s)
C. Case Study 3: Impact of Tuning Platform Configurations for Cloud Providers
(b) Server with local NUMA memory & large pages
The memory system plays an important role in CapEx and OpEx for cloud providers. The system must deliver competitive performance for as many applications as possible without incurring prohibitive provisioning and power delivery costs. At the same time, providers often cannot afford to specialize their hardware at design time for each class of application. In this final case study, we apply X-Mem to examine the efficacy of an alternative approach: tuning platform configurations to cater to DRAM main memory performance requirements as needed. Specifically, we consider (i) unloaded latency and (ii) loaded latency trends as functions of various firmwarecontrolled knobs. These knobs include CPU frequency, number of DRAM channels, channel frequency, and DRAM device timing parameters. To facilitate this study, we use the Desktop and Server platforms, each with two alternate DRAM timing settings as shown in Table II: Nominal Timings and ≈33% Slower Timings. In the latter case, DDR3 timing parameters tCAS, tRCD, tRP, and tRAS [59] were each slowed down on all channels by approximately 33% to imitate a slower (and cheaper) memory module.
Fig. 6: X-Mem enables read-loaded main memory latency measurements for various channel frequencies and DRAM timing configurations. Channel width and frequency have a strong effect on loaded latency, unlike the timing parameters.
We consider the parameters influencing DRAM unloaded latency first. The results are summarized in Table III. We make several observations. (i) Using the Desktop, CPU frequency has a significant impact: overall latency increases by up to 50% when the clock is scaled down from 3.6 GHz to 1.2 GHz. This is because the chip’s “uncore” is slowed down along with the cores, causing the cache levels to consume more time in the critical path of DRAM access. (ii) On both systems, slower DDR3 DRAM timing parameters have a moderate effect at the 1333 MT/s baseline channel frequency (up to 12% on the Desktop), with generally less sensitivity on the Server system (up to 6%). This is because the Server has higher baseline cache latencies than the Desktop (as shown earlier in Case Study 2). The impact of even an aggressive ≈33% slowdown in DRAM timings on the Server is significantly less than
9
Gottscho et al. Benchmark
X-Mem: A Cross-Platform and Extensible Memory Characterization Tool for the Cloud Config.
1T
2T
3T
4T
ISPASS'16
The results are shown in Table IV for two configurations on our Desktop. The table shows the percent difference in benchmark run-time, averaged over five runs, for each memory channel configuration (table rows) and number of PARSEC benchmark threads (table columns). We find that both canneal and streamcluster are moderately sensitive to DRAM timings when there is sufficient memory bandwidth available (approximately 8% to 12% performance difference for the 1333 MT/s, 4C* cases). However, when the available channel bandwidth is reduced, or more load is placed on the memory, the sensitivity generally decreases (i.e., the 800 MT/s, 1C cases, or increasing the number of threads). This small study appears to validate our claims made above using X-Mem: tuning DRAM timings should have a greater effect on lightly-loaded systems running latencysensitive applications, but further investigation may be required. Nevertheless, X-Mem should prove to be an invaluable tool in conducting such investigations. This case study highlights the ability of X-Mem to help cloud providers provision and configure their platforms to suit different performance requirements. It also could be used to infer third-party “black box” application memory performance characteristics without intrusive instrumentation. These applicationlevel inferences could be useful for cloud providers to properly match subscribers’ applications with best-configured available hardware.
canneal 1333 MT/s 4C* 9.74% 9.02% 8.83% 8.89% 800 MT/s 1C 9.90% 9.29% 8.38% 7.83% canneal streamcluster 1333 MT/s 4C* 11.14% 11.53% 11.82% 12.24% 8.10% 5.93% 2.63% 1.24% streamcluster 800 MT/s 1C
TABLE IV: Percent slowdown caused by DRAM ≈33% Slower Timings for two memory-sensitive PARSEC applications on the Desktop system at 3.6 GHz with different application memory intensities (thread count).
the penalty of accessing remote NUMA memory. (iii) The gap between nominal and slower DRAM timing configurations narrows as DDR3 channel frequency is scaled up. At 1867 MT/s, the Server’s memory latency is impacted by as little as 1% for an aggressive ≈33% slowdown in DRAM timings. (iv) As the CPU frequency is reduced, the overall memory latency becomes less sensitive to DRAM timing (from 12% at 3.6 GHz to 7% at 1.2 GHz on the Desktop). (v) Finally, reducing the number of channels on the Desktop (4C to 1C) has virtually no impact on unloaded memory latency (only ≈ 1 ns). This is because interleaving only affects the mapping of linear (physical) addresses to memory locations, and should have no impact when there is only one outstanding memory request at a time (as is done by X-Mem, which measures latency with random pointer chasing). These five observations suggest that cloud providers should carefully consider the platform configuration as a whole when making memory provisioning decisions. Next, we discuss the impact of memory channel width and transfer rates on main memory loaded latency. The results are depicted in Fig. 6 for the two platforms. Unlike the unloaded latency case, we find that both the number of channels and the channel frequency play significant roles. The number of channels (Fig. 6(a)) is the most important variable for memory performance under heavy loading, as the multiplication of available bandwidth dramatically flattens the latency wall. The quad-channel 1333 MT/s memory configuration is easily overprovisioned for the quad-core Desktop, but the same setup is woefully under-provisioned for the 12-core per socket Server. The latter requires frequencies of up to 1867 MT/s to mitigate the latency wall. For the remainder of this case study, we focus on the impact of DRAM timing parameters on memory loaded latency and draw parallels to measured application performance. Our results obtained with X-Mem are shown in Fig. 6 (light circles for nominal DRAM timings and dark triangles for slower timings). The results indicate that the impact of DRAM timing parameters is relatively minor for loaded latency, in comparison to the unloaded latency case discussed earlier. This is because when the memory system is loaded, overall delay becomes increasingly dominated by resource contention, and less dependent on the “native” DRAM latency. However, in AL-DRAM [44], the authors found that tuning DRAM timings could significantly improve application performance, especially when memory bandwidth is scarce under loaded conditions. Our memory performance results seem to contradict those of AL-DRAM. Thus, we decided to study this discrepancy further with two memory-intensive PARSEC benchmarks used in AL-DRAM.
VI. C ONCLUSION In this paper, we introduced X-Mem: a new open-source memory characterization tool [18], [19]. X-Mem will bring value to both cloud subscribers and providers by helping them characterize the memory hierarchy and study its impact on application-visible performance and power. In contrast with prior tools, X-Mem addresses four key needs of cloud platforms: access pattern diversity, platform variability, metric flexibility, and tool extensibility. Our three case studies showed several examples of how the tool can be used to gain insights. Our future work will use and extend the tool to focus on more specific aspects of cloud infrastructure and applications. We hope that the broader community finds X-Mem useful and will extend it for future research. VII. ACKNOWLEDGMENT This work was conducted jointly between Microsoft Corporation and the NanoCAD Lab of the Electrical Engineering Department at the University of California, Los Angeles (UCLA). The authors thank Dr. Jie Liu of Microsoft Research, Dr. Badriddine Khessib and Dr. Kushagra Vaid of Microsoft for supporting this work. The authors also thank Mike Andrewartha, Mark Santaniello, and Dr. Laura Caulfield of Microsoft for their advice, feedback, and insights. Mark thanks Dr. Fedor Pikus of Mentor Graphics for previously teaching him some valuable programming techniques that were relevant to the development of this tool. Finally, Mark thanks Maria Yefimova and Dr. Dana Watson at UCLA for help with proofreading. Funding came partly from the USA NSF Variability Expedition Grant No. CCF-1029783. 10
Gottscho et al.
X-Mem: A Cross-Platform and Extensible Memory Characterization Tool for the Cloud
R EFERENCES
ISPASS'16
[34] C. Natarajan, B. Christenson, and F. Briggs, “A Study of Performance Impact of Memory Controller Features in Multi-Processor Server Environment,” in Workshop on Memory Performance Issues, 2004. [35] H. David, C. Fallin, E. Gorbatov, U. R. Hanebutte, and O. Mutlu, “Memory Power Management via Dynamic Voltage/Frequency Scaling,” in Proceedings of the ACM International Conference on Autonomic Computing (ICAC), 2011. [36] Q. Deng, D. Meisner, L. Ramos, T. F. Wenisch, and R. Bianchini, “MemScale: Active Low-Power Modes for Main Memory,” in Proceedings of the ACM International Conference on Architectural Support for Programming Languages and Operating Systems (ASPLOS), 2011. [37] Q. Deng, D. Meisner, A. Bhattacharjee, T. F. Wenisch, and R. Bianchini, “MultiScale: Memory System DVFS With Multiple Memory Controllers,” in Proceedings of the IEEE/ACM International Symposium on Low Power Electronics and Design (ISLPED), 2012. [38] Q. Deng, D. Meisner, A. Bhattacharjee, T. F. Wenisch, and R. Bianchini, “CoScale: Coordinating CPU and Memory System DVFS in Server Systems,” in Proceedings of the ACM/IEEE International Symposium on Microarchitecture (MICRO), 2012. [39] F. Ercan, N. A. Gazala, and H. David, “An Integrated Approach to System-Level CPU and Memory Energy Efficiency on Computing Systems,” in In Proceedings of the IEEE International Conference on Energy Aware Computing (ICEAC), 2012. [40] M. Gottscho, A. A. Kagalwalla, and P. Gupta, “Power Variability in Contemporary DRAMs,” IEEE Embedded Systems Letters (ESL), vol. 4, no. 2, pp. 37–40, 2012. [41] M. Gottscho, L. A. D. Bathen, N. Dutt, A. Nicolau, and P. Gupta, “ViPZonE: Hardware Power Variability-Aware Memory Management for Energy Savings,” IEEE Transactions on Computers (TC), vol. 64, no. 5, 2015. [42] M. Gottscho, A. BanaiyanMofrad, N. Dutt, A. Nicolau, and P. Gupta, “DPCS: Dynamic Power/Capacity Scaling for SRAM Caches in the Nanoscale Era,” ACM Transactions on Architecture and Code Optimization (TACO), vol. 12, no. 3, 2015. [43] K. Chandrasekar, S. Goossens, C. Weis, M. Koedam, B. Akesson, N. Wehn, and K. Goossens, “Exploiting Expendable Process-Margins in DRAMs for Run-Time Performance Optimization,” in Design, Automation, and Test in Europe (DATE), 2014. [44] D. Lee, Y. Kim, G. Pekhimenko, S. Khan, V. Seshadri, K. Chang, and O. Mutlu, “Adaptive-Latency DRAM: Optimizing DRAM Timing for the Common Case, year = 2015,” in Proceedings of the IEEE International Symposium on High Performance Computer Architecture (HPCA). [45] J. D. McCalpin, “Memory Bandwidth and Machine Balance in Current High Performance Computers,” 1995. URL: http://www.researchgate.net/publication/ 213876927 Memory Bandwidth and Machine Balance in Current High Performance Computers. [46] J. D. McCalpin, “A Survey of Memory Bandwidth and Machine Balance in Current High Performance Computers,” 1995. URL: http://www.cs.virginia.edu/ mccalpin/papers/balance/index.html. [47] L. Peng, J.-K. Peir, T. K. Prakash, C. Staelin, Y.-K. Chen, and D. Koppelman, “Memory Hierarchy Performance Measurement of Commercial Dual-Core Desktop Processors,” Journal of Systems Architecture, vol. 54, no. 8, 2008. [48] V. Babka and P. Tma, “Investigating Cache Parameters of x86 Family Processors,” in Computer Performance Evaluation and Benchmarking, Lecture Notes in Computer Science, Berlin, Heidelberg: Springer Berlin Heidelberg, 2009. [49] D. Molka, D. Hackenberg, R. Schone, and M. S. Muller, “Memory Performance and Cache Coherency Effects on an Intel Nehalem Multiprocessor System,” in Proceedings of the ACM/IEEE International Conference on Parallel Architectures and Compilation Techniques (PACT), 2009. [50] L. Bergstrom, “Measuring NUMA Effects With the STREAM Benchmark,” tech. rep., University of Chicago, 2010. [51] R. Murphy, “On the Effects of Memory Latency and Bandwidth on Supercomputer Application Performance,” in In Proceedings of the International Symposium on Workload Characterization (IISWC), 2007. [52] “AVX-512 Instructions.” URL: https://software.intel.com/en-us/blogs/2013/avx-512instructions. [53] Y. Kim, R. Daly, J. Kim, C. Fallin, J. H. Lee, D. Lee, C. Wilkerson, K. Lai, and O. Mutlu, “Flipping Bits in Memory Without Accessing Them: An Experimental Study of DRAM Disturbance Errors,” in Proceedings of the ACM/IEEE International Symposium on Computer Architecture (ISCA), 2014. [54] “Project Zero: Exploiting the DRAM Rowhammer Bug to Gain Kernel Privileges.” URL: http://googleprojectzero.blogspot.com/2015/03/exploiting-dramrowhammer-bug-to-gain.html. [55] “SCons.” URL: http://www.scons.org. [56] M. K. Qureshi, J. Karidis, M. Franceschini, V. Srinivasan, L. Lastras, and B. Abali, “Enhancing Lifetime and Security of PCM-Based Main Memory with Start-Gap Wear Leveling,” in Proceedings of the ACM/IEEE International Symposium on Microarchitecture (MICRO), 2009. [57] “PandaBoard.” URL: http://www.pandaboard.org. [58] “Open Compute Project.” URL: http://www.opencompute.org. [59] “JEDEC DDR3 SDRAM Standard.” URL: http://www.jedec.org/standardsdocuments/docs/jesd-79-3d.
[1] M. Armbrust, I. Stoica, M. Zaharia, A. Fox, R. Griffith, A. D. Joseph, R. Katz, A. Konwinski, G. Lee, D. Patterson, and A. Rabkin, “A View of Cloud Computing,” Communications of the ACM, vol. 53, no. 4, 2010. [2] L. Columbus, “Roundup of Cloud Computing Forecasts and Market Estimates,” 2015. URL: http://www.forbes.com/sites/louiscolumbus/2015/01/24/roundup-ofcloud-computing-forecasts-and-market-estimates-2015. [3] J. D. Gelas, “Server Buying Decisions: Memory.” URL: http://www.anandtech.com/print/7479/server-buying-decisions-memory. [4] L. A. Barroso and U. H¨olzle, “The Case for Energy-Proportional Computing,” IEEE Computer, vol. 40, no. 12, 2007. [5] L. A. Barroso and U. H¨olzle, The Datacenter as a Computer: An Introduction to the Design of Warehouse-Scale Machines. Morgan & Claypool Publishers, 2009. [6] W. L. Bircher and L. K. John, “Complete System Power Estimation Using Processor Performance Events,” IEEE Transactions on Computers (TC), vol. 61, no. 4, pp. 563– 577, 2012. [7] K. Sudan, S. Srinivasan, R. Balasubramonian, and R. Iyer, “Optimizing Datacenter Power with Memory System Levers for Guaranteed Quality-of-Service,” in Proceedings of the ACM/IEEE International Conference on Parallel Architectures and Compilation Techniques (PACT), 2012. [8] “Microsoft Azure.” URL: http://azure.microsoft.com. [9] “Amazon EC2.” URL: http://aws.amazon.com/ec2/. [10] “Scaleway.” URL: http://www.scaleway.com. [11] “TryStack.” URL: http://www.trystack.org. [12] X. Fan, W.-D. Weber, and L. A. Barroso, “Power Provisioning for a Warehouse-Sized Computer,” ACM SIGARCH Computer Architecture News, vol. 35, no. 2, 2007. [13] J. D. McCalpin, “The STREAM benchmark.” URL: http://www.cs.virginia.edu/stream/. [14] J. D. McCalpin, “The STREAM2 Benchmark.” URL: http://www.cs.virginia.edu/stream/stream2. [15] L. McVoy and C. Staelin, “lmbench: Portable Tools for Performance Analysis,” in Proceedings of the USENIX Annual Technical Conference, 1996. [16] S. Siamashka, “TinyMemBench.” URL: https://github.com/ssvb/tinymembench. [17] V. Viswanathan, K. Kumar, and T. Willhalm, “Intel Memory Latency Checker v2.” URL: https://software.intel.com/en-us/articles/intelr-memory-latency-checker. [18] “X-Mem: The eXtensible MEMory Characterization Tool.” URL: https://nanocadlab.github.io/X-Mem/. [19] “X-Mem Source Code.” URL: https://github.com/Microsoft/X-Mem. [20] K. Bailey, L. Ceze, S. D. Gribble, and H. M. Levy, “Operating System Implications of Fast, Cheap, Non-Volatile Memory,” in USENIX Hot Topics on Operating Systems (HotOS), 2011. [21] J. Zhao, C. Xu, P. Chi, and Y. Xie, “Memory and Storage System Design with Nonvolatile Memory Technologies,” IPSJ Transactions on System LSI Design Methodology, vol. 8, 2015. [22] K. R. Jackson, L. Ramakrishnan, K. Muriki, S. Canon, S. Cholia, J. Shalf, H. J. Wasserman, and N. J. Wright, “Performance Analysis of High Performance Computing Applications on the Amazon Web Services Cloud,” in In Proceedings of the IEEE International Conference on Cloud Computing Technology and Science (CloudCom), 2010. [23] S. K. Barker and P. Shenoy, “Empirical Evaluation of Latency-Sensitive Application Performance in the Cloud,” in Proceedings of the ACM Conference on Multimedia Systems (MMSys), 2010. [24] B. Farley, A. Juels, V. Varadarajan, T. Ristenpart, K. D. Bowers, and M. M. Swift, “More for Your Money: Exploiting Performance Heterogeneity in Public Clouds,” in Proceedings of the ACM Symposium on Cloud Computing (SoCC), 2012. [25] M. Ferdman, B. Falsafi, A. Adileh, O. Kocberber, S. Volos, M. Alisafaee, D. Jevdjic, C. Kaynak, A. D. Popescu, and A. Ailamaki, “Clearing the Clouds: A Study of Emerging Scale-out Workloads on Modern Hardware,” in Proceedings of the ACM International Conference on Architectural Support for Programming Languages and Operating Systems (ASPLOS), 2012. [26] C. Kozyrakis, A. Kansal, S. Sankar, and K. Vaid, “Server Engineering Insights for Large-Scale Online Services,” IEEE Micro, vol. 30, no. 4, pp. 2–13, 2010. [27] A. Li, X. Yang, S. Kandula, and M. Zhang, “CloudCmp: Comparing Public Cloud Providers,” in Proceedings of the ACM Conference on Internet Measurement (IMC), (New York, New York, USA), 2010. [28] E. Blem, J. Menon, and K. Sankaralingam, “A Detailed Analysis of Contemporary ARM and x86 Architectures,” in Proceedings of the IEEE International Symposium on High Performance Computer Architecture (HPCA), 2013. [29] R. Kotla, A. Devgan, S. Ghiasi, T. Keller, and F. Rawson, “Characterizing the Impact of Different Memory-Intensity Levels,” in In Proceedings of the IEEE International Workshop on Workload Characterization (WWC), 2004. [30] R. Miftakhutdinov, E. Ebrahimi, and Y. N. Patt, “Predicting Performance Impact of DVFS for Realistic Memory Systems,” in In Proceedings of the ACM/IEEE International Symposium on Microarchitecture (MICRO), 2012. [31] S. Rixner, W. J. Dally, U. J. Kapasi, P. Mattson, and J. D. Owens, “Memory Access Scheduling,” in Proceedings of the ACM International Symposium on Computer Architecture (ISCA), 2000. [32] V. Cuppu and B. Jacob, “Concurrency, Latency, or System Overhead: Which Has the Largest Impact on Uniprocessor DRAM-System Performance?,” in Proceedings of the ACM/IEEE International Symposium on Computer Architecture (ISCA), pp. 62– 71, 2001. [33] V. Delaluz, A. Sivasubramaniam, M. Kandemir, N. Vijaykrishnan, and M. J. Irwin, “Scheduler-Based DRAM Energy Management,” in Proceedings of the Design Automation Conference (DAC), 2002.
11