Draft version September 14, 2010 Preprint typeset using LATEX style emulateapj v. 03/07/07
CHANDRA GRATING SPECTROSCOPY OF THE BE/X-RAY BINARY 1A 0535+262 Mark T. Reynolds1 , Jon M. Miller1
arXiv:1009.2240v1 [astro-ph.HE] 12 Sep 2010
Draft version September 14, 2010
ABSTRACT We present Chandra HETGS spectroscopy of the Be/X-ray binary 1A 0535+262 obtained during the 2009/2010 giant outburst. These are the first CCD grating spectra of this type of system during a giant outburst. Our spectra reveal a number of lines including a narrow Fe Kα emission line with a FWHM of ∼ 5000 km s−1 . For the first time, we detect the presence of a highly ionized outflow in a Be/X-ray binary. Assuming that the line is He-like Fe XXV, fits with a simple Gaussian imply an outflow velocity of ∼ 1500 km s−1 . However, self-consistent photoionization modeling with xstar suggests that Fe XXIII-XXIV must also contribute. In this case, an outflow velocity of ∼ 3000 km s−1 is implied. These results are discussed in the context of the accretion flow in Be-star, neutron star, and black hole X-ray binaries. Subject headings: accretion, accretion disks — winds — neutron star physics — X-rays: binaries — X-rays: individual (1A 0535+262) 1. INTRODUCTION
X-ray binaries are divided into a number of different categories based on their observational (e.g. Xray/optical) and physical characteristics . The primary division is made based on the mass of the secondary star in the binary, with systems for which M2 . 1 M⊙ being classified as low mass X-ray binaries (LMXBs), 1 & M2 & 10 M⊙ classified as intermediate mass Xray binaries (IMXBs) and those with secondary masses greater than 10 M⊙ classified as high mass X-ray binaries (HMXBs). Approximately 300 X-ray binary systems have been detected in the Galaxy, with more than half of these being LMXBs. Of the approximately 115 known HMXB systems, Be/X-ray binaries comprise the majority (∼ 70%; Liu et al. 2006, 2007). Be/X-ray binaries comprise of a neutron star primary in a wide eccentric orbit with a Be-star secondary (no black hole/Be-star binaries have been discovered to date – see Belczynski & Ziolkowski 2009). X-ray outbursts in these systems typically occur during periastron passage of the neutron star close to the circumstellar excretion disc of the Be-star, e.g. Okazaki & Negueruela (2001). However, the X-ray outbursts have been observed to occur in two distinct flavors, (i) Type-I: Regular outbursts which occur during periastron passage, generally repeating on the binary orbital period, and (ii) Type-II: Also known as giant outbursts likely arising from a dramatic expansion of the circumstellar disc. In contrast to type-I outbursts, type-II outbursts do not have a strict phase dependence and typically last much longer than type-I bursts, with the outburst time typically being measured in months, e.g. see Fig. 1. Cyclotron absorption lines have been detected in the X-ray spectra of a number of Be/X-ray binaries allowing accurate constraints to be placed on the neutron star magnetic field. Typically, magnetic flux densities in the range ∼ 1011 −1013 G are measured, e.g., Nakajima et al. (2006); Terada et al. (2006); Wilson et al. (2008). This Electronic address:
[email protected] 1 Department of Astronomy, University of Michigan, 500 Church Street, Ann Arbor, MI 48109
opens up the possibility of studying the effect of the neutron star B-field on the accretion flow. In these HMXBs the magnetic field is much larger than the B-field of the neutron stars in the much older population of neutron star LMXBs, e.g., a magnetic flux density of ∼ 108 G has been measured in the accreting millisecond pulsar SAX J1808.4-3658 (Cackett et al. 2009). Reig (2008) have investigated the timing properties exhibited by sample of 4 Be/X-ray binaries, which displayed a type II outburst that was observed by RXTE. A number of similarities with the well studied behavior of LMXBs were detected when analyzing the colour–colour (CD) and hardness intensity diagrams (HID), e.g. Hasinger & van der Klis (1989); van der Klis (2006). The main similarities are as follows (i) Similar spectral branches in the CD/HID as those observed in LMXBs, (ii) smooth motion through the CD/HID, (iii) larger variability at low intensities, (iv) power spectra that can be described by a small number of Lorentzians, and (v) flat topped noise at lower frequencies in the horizontal branch that turns into power-law noise in the diagonal branch. A number of differences were also observed, namely (i) Different patterns in the CD/HID, e.g. a low intensity soft state, (ii) slower motion through the various patterns (weeks/months as opposed to hrs/days in LMXBs), (iii) characteristic timescales that are an order of magnitude longer, and (iv) no apparent correlation between the power spectral parameters (QPOs, RMS) and the mass accretion rate. A number of features also hint at a B-field dependence of the timing properties, e.g. power-law noise in the HB branch in V0332+53 but flat topped noise in 4U0115+63 and EXO 2030+375 whose B-fields are 2-3x lower than that of V0332+53. These observations demonstrate that the accretion flow in the Be/X-ray binaries is fundamentally similar to that in the more thoroughly studied LMXBs. Simultaneous observations at optical/NIR and X-ray wavelengths have shown substantial changes in the structure of both the accretion and circumstellar discs, with both discs observed to disappear at times. This changing disc structure is responsible for the varying outburst phases (Wilson et al. 2002). The observed
2
Reynolds et al.
Fig. 1.— SWIFT BAT hard X-ray lightcurve for the Be/Xray binary 1A 0535+262 from 2005 January to 2010 January. A number of regular outbursts (type-I) are detected in addition to the giant outbursts (type-II) in 2005 and 2009. The inset shows a zoom in on the 2009 giant outburst, the lines mark the times of our Chandra HETGS observations (see text). For reference a flux of ∼ 0.22 counts s−1 cm−2 is normally measured from the Crab pulsar.
changes in the accretion and circumstellar discs have been successfully explained via the ’truncated disc model’ (Okazaki & Negueruela 2001). Here the circumstellar disc is truncated due to the tidal interaction with the neutron star. Detailed studies of EXO 2030+375 found that the circumstellar disc is likely truncated at the 4:1 tidal resonance radius. This is close to the critical radius at periastron. If the disc extends to, or beyond this radius, matter may escape through the inner Lagrangian point and form an accretion disc around the neutron star, see Okazaki & Negueruela (2001) for further details. 1A 0535+262 is a 103s X-ray pulsar in orbit around a O9.7 – B0 IIIe companion star (Steele et al. 1998). The ∼ 111 day orbital period is highly eccentric (e ∼ 0.47; Finger et al. 1996). A total of 7 giant outbursts have been observed from this system to date – 1975, 1980, 1983, 1989, 1994, 2005 and 2009, see Caballero et al. (2008) for further details. In response to the 2009 giant outburst of 1A 0535+262 (Wilson-Hodge et al. 2009; Reynolds & Miller 2009), we requested and were granted 20ks of Chandra director’s discretionary time to obtain a HETGS spectrum during this outburst. These are the first X-ray grating spectra of a giant outburst from a Be/X-ray binary. In this paper, we describe observations undertaken with Chandra , during the 2009 giant outburst of the Be/X-ray binary 1A 0535+262. In §2, we describe the observations. We proceed to analyze the data in §3, where we find evidence for the presence of a high velocity highly ionized outflow in this system. In §4, these results are discussed and compared to high resolution Xray spectral observations of a number of X-ray binaries, and finally our conclusions are presented in §5. 2. OBSERVATIONS 2.1. Chandra HETGS
A giant outburst from 1A 0535+262 was detected in late 2009 (Wilson-Hodge et al. 2009), the outburst peaked at a 15 – 50 keV flux of approximately 6 Crab. Unfortunately, as was the case during the previous 2005
giant outburst, the source was positioned close to the sun rendering observations impossible over a large part of the outburst. However, the long duration of a typical type-II outburst from this system (30 – 60 days) presented an opportunity to obtain the first high resolution spectrum at X-ray wavelengths of a Be/X-ray binary in outburst. As such, we requested, and were granted, a Chandra DDT observation. 1A 0535+262 was observed on 2 occasions upon exit from a sun constrained sky position in late December 2009. In the first observation (obsid: 12066 – 2009.12.28), the exposure time was ∼ 9 ks, while the exposure time for the second observation (obsid: 12067 – 2009.12.31) was ∼ 11 ks. The high energy transmission grating spectrometer (HETGS) was used to disperse the incoming photons onto the ACIS-S CCD array. As the source flux was high, observations were carried out in continuous clocking mode, with a nominal frame time of ∼ 2.8 ms. In this data mode the fast readout times are achieved by collapsing the data into a single dimension, preserving spectral and timing information at the price of losing one of the spatial dimensions. Spectra and lightcurves were extracted from the Chandra event lists using ciao v4.2. Response files were generated using the mkrmf & fullgarf tasks and first order spectra from each grating were combined with the add grating orders task resulting in a single HEG & MEG spectrum for each observation. The spectra were binned using the grppha tool to ensure 10 counts per spectral bin before exporting to xspec for analysis. 2.2. RXTE
1A 0535+262 was also observed by RXTE during this outburst on an almost daily basis (Caballero et al. 2009). Data was obtained with both the PCA and HEXTE. The RXTE observations were quasi-simultaneous with the Chandra observations with pointed observations occurring within a 12hr period of our observations on each occasion (Obsid: 94323-05-03-03, -06; PI: Cabellero). Spectra were extracted in the standard manner using the relevant ftools. For the PCA, spectra and background files were extracted from layer-1 of PCU2 alone, giving useful data in the spectral range 3 – 20 keV. HEXTE spectra were extracted from cluster-A, while backgrounds were extracted from cluster-B and converted to cluster-A background files using the ftool hextebackest2 giving useful data in the 15 – 100 keV band. As a number of background features were apparent at higher energies, data above 60 keV was ignored in all further analysis. Hence, the RXTE spectra resulted in a broadband detection of 1A 0535+262 in the spectral range from 3 – 60 keV. 3. ANALYSIS & RESULTS
The HEG spectra immediately reveal the presence of an emission feature consistent with iron Kα at approximately 6.4 keV in addition to an absorption feature at ∼ 6.7 keV. In contrast, outside of a number of line like residuals in the Si/S region (2.1 – 2.4 keV), which are likely of an instrumental nature, there are no obvious spectral features in the MEG spectra. Before we examine in detail the emission & absorption lines in the spectrum, we 2
see http://heasarc.gsfc.nasa.gov/docs/xte/xhp new.html
Chandra grating spectroscopy of 1A 0535+262
3 Fe Kα
0.2
Kβ
normalized counts s−1 keV−1 cm−2
normalized counts s−1 keV−1 cm−2
0.1
0.01
0.1
0.05
Fe XXV
10−3 1.5
1.2
ratio
ratio
1.1
1
1 0.9
0.5
0.8
1
2
5
10
20
50
Energy (keV)
3
4
5 Energy (keV)
6
7
8
Fig. 2.— Broadband spectra of 1A 0535+262 as measured by Chandra and RXTE. The spectra (0.9 – 60 keV) include data from MEG, HEG, PCA and HEXTE. The top spectrum corresponds to observation 1 (red) while the bottom spectrum corresponds to observation 2 (black). The best fit model corresponds to pha*(cyclabs*(diskbb+bb+cutoffpl)), see Table 1 for the best fit parameters.
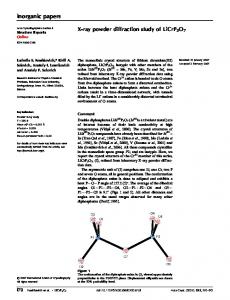
Fig. 3.— Chandra HEG spectra of 1A 0535+262 taken at the times indicated in Fig. 1. Emission lines from Fe Kα & Kβ are clearly detected in both observations and are consistent with no change within the errors. In contrast absorption consistent with Fe XXV is only detected in the first observation. The exposure time was ∼ 10 ks in each observation. Note: The data have been rebinned for visual clarity.
first model the spectral continuum. To this end, we utilize the RXTE data in combination with the Chandra data (HEG & MEG) to constrain the continuum. All data analysis takes place within xspec 12.5.0.
corona. The low energy spectral break we measure (∼ 20 keV) is consistent with a low electron temperature if the Comptonizing corona is somewhat optically thick, i.e. kTe ∼ 10 keV, τ & 1. Assuming a distance to 1A 0535+262 of 2 kpc and a canonical neutron star mass of 1.4 M⊙ , we measure unabsorbed 0.9 – 60 keV luminosities of LX1 = (1.59 ± 0.01) × 1037 erg s−1 and LX2 = (1.17±0.01)×1037 erg s−1 , which correspond to Eddington scaled luminosities of ∼ 9% and 6.6% for the first and second observation respectively.
3.1. Continuum model
In Fig. 2, we plot the broadband Chandra and RXTE spectrum of 1A 0535+262. The spectrum was fit with a model consisting of a disk blackbody and a blackbody plus a powerlaw with a spectral cut-off containing an Cyclotron absorption line modified by interstellar absorption (pha*(cyclabs*(diskbb+bb+cutoffpl))), as this was consistent with the observed spectrum in the 2005 normal outburst (Caballero et al. 2008). The column density was held fixed at a value of 4.5 × 1021 cm−2 consistent with the measured value towards 1A 0535+262 (Kalberla et al. 2005) and with optical measurements, e.g. Steele et al. (1998). Allowing the column density to vary results in a best fit value consistent with this value. At high energies a broad absorption feature is observed consistent with the expected position of the fundamental Cyclotron resonance absorption line in this system. The measured energies are consistent with measurements from the previous 2005 outburst (Terada et al. 2006; Caballero et al. 2008), and that measured earlier in the 2009 outburst (Caballero et al. 2009) implying a neutron star magnetic field of ∼ 4 × 10¹² G. The resulting best fit model parameters are displayed in Table 1. At higher energies, no significant change is observed in the position of the Cyclotron lines; however, as the background dominates above 60 keV, our limited ability to constrain the continuum above the Cyclotron line will affect our ability to quantify any small changes that may be present. The simple cut-off power-law model that we have used to describe the high energy emission provides a good description of the data. If this emission arises through Compton up-scattering, then the spectral break may signal the electron temperature of the hot
3.2. Emission & absorption lines
Having characterized the continuum, the spectra were then inspected for emission and absorption features. We concentrate on the HEG spectra as there are no obvious spectral features in the MEG spectra. A number of emission and absorption features are clearly detected in the iron K region of the HEG spectrum. In particular, we detect emission consistent with Fe Kα and Fe Kβ, while a single absorption line consistent with the presence of highly ionized Fe XXV is also detected in the first observation alone, see Fig. 3. Basic line parameters were obtained by fitting Gaussians to the detected lines, the parameters of which we display in Table 2. In Fig. 3, we display the HEG spectra for each epoch with the best fit continuum model from §3.1 in addition to a number of Gaussian lines. The iron K-shell lines are detected in each observation and have the same equivalent widths (EW) within the errors. The Kα line is resolved and hence we measure a line width of ∼ 5000 km s−1 in the first observation while the measured line width is lower in observation 2 at ∼ 4100 km s−1 , it is nonetheless consistent with the first observation within the error bars (see Table 2). The observed Kα line widths are consistent with velocity broadening in, for example, an accretion disk. The measured line centroid (6.39±0.01 keV) supports this, being inconsistent with the presence of higher ionization states, that would broaden the line, contributing to the observed
Reynolds et al.
normalized counts s−1 keV−1
4
2 Fe XXIII, XXIV, XXV
1
0.09 0.08 0.07 0.06 0.05
0.5
XXVI
Fe Kα
Fe Kβ Fe XXV
6.6
6.8 7 Energy (keV)
7.2
1.2 ratio
1.1 1 0.9 0.8 1.2 ratio
1.1 1 0.9 0.8 5
6
7
8
Energy (keV)
Fig. 4.— Main panel: Zoom in on the 5 – 8 keV region of the first Chandra observation with the best fit continuum model. The emission lines have been fit with Gaussians. A single absorption line remains in the residuals consistent with an origin from highly ionized Fe XXV (bottom panel). An xstar absorption component was then added to the model, the resulting best fit model gives 21 cm−2 , ξ = 4.0+0.3 erg cm s−1 , and v −1 (1σ errors). The absorption line is found to require N = 2.0+2.0 out = 3150 ± 600 km s −0.8 × 10 −0.2 a contribution from Fe XXIII – XXV, an additional line due to Hydrogen like Fe XXVI is also predicted. Inset: Best fit model of the absorption lines in 1A 0535+262, where the y-axis is in units of photons cm−2 s−1 keV−1 , i.e., the predicted incident spectrum. The normalization of the Fe Kα, Kβ lines have been set to zero in order to emphasize the predicted absorption lines. Note: The data in the main panel has not been divided by the detector area, in order to illustrate the absence of instrumental features in the Fe K region, and that the data have been rebinned for visual clarity.
Fe Kα line, i.e. > Fe X. The measured line fluxes (see Table 2) return a Fe Kβ/Kα flux ratio of 0.21±0.11 in agreement with the theoretically expected value within the errors (∼ 0.13, Palmeri et al. 2003). An absorption line, at an energy consistent with highly ionized Fe XXV is detected in the first observation alone. We do not observe any absorption from Fe XXVI in either epoch, nor is there evidence for any additional absorption features in either observation. Assuming the detected absorption line is due to highly ionized Fe XXV, we measure a significant blue-shift consistent with the presence of an outflowing wind in the 1A 0535+262 system. The measured line position implies a velocity for the outflowing material of vout = 1500 ± 1000 km s−1 . 3.3. Ionized absorption
To provide a more physical description of the highly ionized absorption in the spectrum of 1A 0535+262, we generated a grid of models using xstar version 2.1kn9, and the ”xstar2xspec” facility. For an input spectral form, we used the (unabsorbed) best-fit continuum model, extended to cover the 0.1-100.0 keV range. A covering factor of 0.2 was assumed, consistent with other X-ray binaries (e.g. Miller et al. 2008 on GRO J165540, Ueda et al. 2009 on GRS 1915+105), and consistent with the absence of any strong ionized emission lines. A
maximum density of n = 1012 cm−3 was assumed, and initially solar abundances were assumed for all elements. This xspec table model was then added to the continuum model in §3.1 as an additional absorption component, i.e. pha*(mtable{xstar.table}*(continuum)). The free parameters of this additional absorber are the column density, N, the log of the ionization parameter, ξ and the redshift/blueshift, vin/out . Fits to the data with this grid of absorption models find the following best-fit parameters: N = 2.9+1.2 −1.0 × −1 1021 cm−2 , ξ = 3.4+0.8 erg cm s , and v = 5000 ± out −0.2 600 km s−1 (uncertainties are 1σ errors). However, this model predicts H-like Mg and Si absorption lines that are not observed in the data. Moreover, it appears that the absorption at ∼ 6.73 keV also contains a contribution from Fe XXIII and Fe XXIV that is comparable to that from the Fe XXV line. A model where iron is over-abundant by a factor of two provides an improved fit to the data, and does not predict observable Mg and Si lines. With such a model, the following absorption parameters are measured: N = 21 −1 2.0+2.0 cm−2 , ξ = 4.0+0.3 , and vout = −0.8 × 10 −0.2 erg cm s −1 3150 ± 600 km s (uncertainties are 1σ errors). This model provides a fit both to the entire spectrum and to the ionized Fe K region that is more reasonable. In the
Chandra grating spectroscopy of 1A 0535+262 Fig. 4 inset, we display the best fit model containing the xstar absorption component but with the normalization of the emission lines set to zero for clarity. The incident model spectrum is plotted to illustrate the contribution from the individual Fe ions. The absorption line is found to be the sum of absorption from a number of highly ionized Fe ions, i.e. Fe XXIII, Fe XXVI, Fe XXV, see Kallman et al. (2004) for details. We emphasise, that it is impossible to produce absorption solely due to Fe XXV. In each model where absorption due to Fe XXV is produced, we also obtain a contribution from the two preceding Fe ionization stages (XXIII, XXIV). We can estimate the column density in each ion via the standard relation between the line equivalent width and the curve of growth (Kotani et al. 2000, 2006). Our best fit model (see Fig. 4) implies column densities of ∼ 1017 cm−2 for Fe XXV and Fe XXIII, while the Fe XXIV column density is less than a third of this. The best fit xstar model also predicts absorption due to H-like iron. This absorption line is not detected in the data due to a combination of the narrow line width, low S/N and relatively low spectral resolution at this energy (∼ 7.04 keV). This line will contribute to the red wing of the Fe Kβ line, resulting in a larger line EW than measured in §3.2. In turn this will effect the measured Fe Kβ/Kα flux ratio, increasing it from the value measured earlier but nonetheless remaining consistent with the expected theoretical value within the errors, i.e., ∼ 0.13 Palmeri et al. (2003). However, further observations are required to test for the presence of this Hydrogen like absorption line. 4. DISCUSSION
We present the first high resolution X-ray spectrum of a type-II outburst from the Be/X-ray binary 1A 0535+262. In the spectra we detect emission lines from Fe Kα & Kβ in two separate observations separated by 3 days, which do not display any significant evidence for variability between the observations. In the first epochs observation alone, we find a blue-shifted absorption line consistent with an origin in highly ionized Fe. Detailed modelling implies an outflow velocity of approximately 3000 km s−1 . We now proceed to discuss the observed spectrum in more detail. 4.1. The emission line spectrum
We can use the observed lines to place constraints on the accretion flow geometry. Firstly, we consider the observed fluorescence Fe Kα emission line. Assuming Keplerian rotation, the line FWHM implies an emission radius of r = 7200+8600 −3500 km in observation 1 and +13200 r = 10800−6300 km in the second observation. This emission radius (i.e., ∼ 104 km) is consistent with the Alfven radius given the known magnetic field in 1A ˙ −2/7 km, 0535+262 of ∼ 4 × 10¹² G, i.e. rA ≈ 3.7 × 10³ M where the mass accretion rate is measured in units of ∼ 10−8 M⊙ yr−1 . Hence, if the Fe fluorescence line originates at the inner edge of the accretion disc, which is truncated close to the Alfven radius, this implies a mass accretion rate ≤ 10−8 M⊙ yr−1 . This accretion rate is consistent with the observed X-ray luminosity during our observation, LX ∼ 0.09 LEdd . We must also ask if the observed fluorescent line strength is consistent with theoretical expectations for
5
fluorescent line formation. George & Fabian (1991) predict the fluorescent line equivalent width to be EW ∼ (Ω/2π) ∗ 180 eV. Following Chen & Halpern (1989), we find the solid angle subtended by the disc to be Ω ≤ 0.25. The measured EW for the 6.4 keV iron line is ∼ 25 eV (see Table 2), implying a solid angle of ∼ 0.15. For completeness, we can also ask if the observed line could be excited on the surface of the mass donor O9.7IIIe star; however, for the known orbital separation at periastron (∼ 1 × 1013 cm, Coe et al. 2006; Haigh et al. 2004) the secondary star will subtend a solid angle over an order of magnitude less than that of the disc. Similarly the observed line width is difficult to produce in a stellar wind, for example the typical terminal velocity for the wind from a B-star is . 2000 km s−1 , this is inconsistent with the measured spectrum. Iron fluorescence emission lines have been detected in numerous other neutron star X-ray binaries. Torrejon et al. (2010) have recently completed a systematic analysis of Chandra HETGS observations of 41 Xray binary systems (10 HMXBs & 31 LMXBs). They find a narrow Fe Kα emission line to be present in all of the HMXBs studied while it is only present in a small fraction of the LMXB sample (< 10%). However, the width of this line is measured to be low, with a typical velocity width of . 800 km s−1 and is found to be consistent with a wind like origin. It is clear that the line width we measure in 1A 0535+262 (v ∼ 5000 km s−1 ) is not consistent with having the same origin as the narrow Kα lines detected by Chandra in the majority of HMXBs observed to date. Nonetheless, we note that the line and continuum flux we measure for the Fe Kα line 0.71 are consistent with the relation Fline ∝ Fcont as measured by Torrejon et al. (2010) for the sample of systems they studied. This is to be expected given the small radius implied by the line width (∼ 104 km). The equivalent width of the Fe Kα line is also consistent with the low significance ’X-ray Baldwin effect’ observed in the other HMXBs. The line we observe in 1A 0535+262 is produced in a similar manner to the relativistically broadened lines that are observed in many of the neutron star LMXBs, i.e., fluorescent X-ray emission from the surface of the accretion disc. However, in 1A 0535+262 the observed Kα line does not display any evidence of the characteristic relativistic red wing as expected if the line is formed deep in the gravitational well of the neutron star, e.g., Cackett et al. (2010). Instead the line we measure is narrow, consistent with a much larger emission radius (∼ 104 km, see above). The emission line spectrum that we observe in the 1A 0535+262 spectrum is fundamentally different to that observed in the high mass X-ray binary pulsars GX 301-2 (Watanabe et al. 2003) and 4U 1908+075 (Torrejon et al. 2010). Watanabe et al. (2003) observed GX 301-2 for 40 ks with Chandra HETGS and detected a fluorescence Kα line with an accompanying Compton shoulder. This line is formed in the dense wind from the B2 supergiant secondary star. Detailed xstar modelling of this X-ray spectrum found column densities of NH ∼ 1024 cm−2 . Analysis of a Chandra spectrum of 4U 1908+075, reveals a similar Compton broadened Fe Kα line (Torrejon et al. 2010). In contrast the iron absorption lines detected in 1A 0535+262 are consistent with a
6
Reynolds et al. TABLE 1 Broadband continuum fit parameters kTdiskbb [ keV ] 0.15±0.04 0.17±0.01
normdiskbb ×104
kTbb [ keV ]
normbb ×10−3
Γ
Ecut [ keV ]
normcutoffpl
Ecyc [ keV ]
Dcyc
Wcyc [ keV ]
5±1 3.1 ± 0.3
1.07±0.04 1.03 ± 0.2
7.7 ± 0.05 6.3 ± 0.03
0.54±0.01 0.44±0.1
23.0 ± 0.2 17.6±0.3
0.28±0.01 0.183 ± 0.004
42.85±0.8 44.0±0.5
0.75±0.05 0.57±0.06
14.9±1.3 8.0±1.0
Note. — Best model parameters for the 1A 0535+262 continuum in the spectral range 0.9 – 60 keV, see Fig. 2, where the best fit model is pha*(cyclabs*(diskbb+bb+cutoffpl)). All errors are quoted at the 90% confidence level.
much lower column density in the wind, N ∼ 1021 cm−2 . 4.2. Wind origin?
We have measured an absorption component consistent with a significant outflow in this system. Simple phenomenological modelling favours a outflow velocity of ∼ 1500 km s−1 consistent with absorption due to highly ionized He-like iron, see §3.2. Detailed modelling with the xstar plasma photoionization code reveals the absorbing component to consist of a number of highly ionized Fe ions from XXIII – XXV at a common blue-shift of ∼ 3000 km s−1 , see §3.3. This is the largest wind velocity measured from a Galactic X-ray binary to date. We can estimate the maximum radius at which the absorption occurs via the measured ionization and column density from the xstar model, i.e., assuming N=nr, we have r = Lx /Nξ, which implies a radius of ∼ 1012 cm. This radius is less than the estimated Roche lobe radius of the neutron star close to periastron (RL ∼ 3.5 × 1012 cm; Coe et al. 2006; Haigh et al. 2004) and implies a disc origin for the observed absorption component. There are three well studied mechanisms for launching a disc wind (i) radiative – radiation pressure may drive a moderately ionized wind (Proga et al. 2008) (ii) thermal – Compton heating of the accretion disc by the central X-ray source may raise the gas temperature to the escape velocity and drive a thermal wind from the system (Woods et al. 1996), and (iii) magnetic – could be powered either by internal magnetic viscosity (MRI) giving rise to a slow dense wind (Proga 2003) or rigid magnetic fields which would allow some material to be accelerated along magnetic field lines giving rise to a clumpy wind (Spruit 1996). Radiative and thermal winds are expected to be launched from significantly larger radii (e.g., 1010 cm vs 109 cm for a 10M⊙ BH) and have a lower density than a magnetic wind, a prediction that may be tested via detailed modelling of the disc absorption line spectrum as demonstrated by Miller et al. 2006a, 2008. The radius implied by our modeling favours a radiative/thermal origin for the large outflow velocity measured in 1A 0535+262. 4.3. Outflows in other X-ray binaries
Chandra observations of GRO J1655-40 (Miller et al. 2006a, 2008) have provided the most revealing insights into the structure of this accretion disc wind. Detailed studies of the wind absorption line spectrum favour a magnetic origin with an inner launching radius ∼ 109 cm. The mass flux in the wind was constrained to be at least 5% – 10% of the total accreted mass and could easily be comparable with the mass accreted through the disc. Observations of the stellar mass black holes H1743322 (Miller et al. 2006b) and 4U 1630-472 (Kubota et al.
2007) have also displayed evidence for dense winds launched from the inner disc region. Recent observations of the Galactic microquasar GRS 1915+105 also display blue-shifted absorption features consistent with an outflow velocity of 150 – 500 km s−1 (Ueda et al. 2009). While observations of the Galactic high mass black binary Cyg X-1 also display evidence for a low velocity outflowing wind (Miller et al. 2005). The low outflow velocity here is interesting as in this system there is a large scale wind, due to the O-type secondary star, with an expected terminal wind velocity of v∞ ≤ 2100 km s−1 . In all of the above cases the measured outflow velocity is low . 500 km s−1 . Similarly, Chandra observations of the neutron star LMXB GX 13+1 also measure a low velocity, highly ionized wind (Ueda et al. 2004). Detailed modelling of the observed absorption lines revealed the wind to be consistent with being radiatively driven. Of the sample of Xray binaries observed with the HETGS, only a single system has displayed absorption lines with a velocity comparable to that which we observe here. Brandt & Schulz (2000); Schulz & Brandt (2002) presented spectra of the neutron star binary Cir X-1 (Jonker et al. 2007). The Fe XXV absorption line was found to exhibit a P-Cygni profile consistent with an outflow velocity of ∼ 2000 km s−1 . In this case it is likely that both thermal and radiation pressure play a significant role in accelerating the wind to the measured velocity (Schulz & Brandt 2002). In a subsequent Chandra observation of Cir X-1, Schulz et al. (2008) unambiguously detect a number of absorption lines which they identify as highly ionized Fe XXII – XXV. The detection of these highly ionized iron lines in Cir X-1 would support the results of our xstar modelling which suggest a contribution from multiple Fe ionization levels to the measured absorption line in 1A 0535+262. The fact that both of the X-ray binaries with the largest observed disc wind velocity (1A 0535+262, this paper & Cir X-1, Schulz & Brandt 2002) contain a neutron star primary suggests that the additional hard Xray emission originating from the neutron star surface and the disc/neutron star boundary layer is crucial to accelerate a wind from the disc to the observed velocities (vout ∼ 3000 km s−1 ). Deeper future observations will no doubt shed light on precise nature of the observed absorption lines and the wind acceleration mechanism in Be/X-ray binary systems. Studies of Galactic OB associations often find that Fe is under-abundant (e.g. Dalfon et al. 2001). The fact that our data and models would appear to require an over-abundance of iron can be tested via future HETGS observations. 5. CONCLUSIONS
We have presented high resolution X-ray grating spectroscopy of the Be/X-ray binary 1A 0535+262. For the
Chandra grating spectroscopy of 1A 0535+262
7
TABLE 2 HEG spectral features
Line Fe I Kα Fe I Kβ Fe XXV Kα
Energy [ keV ]
EW [ eV ]
6.39±0.01 7.061±0.015 6.730±0.015
27 +27 −2 7+13 −3 10+15 −3
Observation 1 Flux [ photons s−1 cm−2 ] −3 (2.4+0.4 −0.2 ) × 10 (0.5 ± 0.2) × 10−3 (0.8 ± 0.3) × 10−3
σ [ km s−1 ] 5090+1150 −1040
— — —
Energy [ keV ]
EW [ eV ]
Observation 2 Flux [ photons s−1 cm−2 ]
6.39±0.01 7.058 6.7
29 +25 −1 8+16 −6