X3D-UML: 3D UML State Machine Diagrams Paul McIntosh, Margaret Hamilton, and Ron van Schyndel RMIT University, GPO Box 2476V, Melbourne, VIC 3000, Australia
[email protected], {margaret.hamilton,ron.vanschyndel}@rmit.edu.au
Abstract. X3D-UML utilises X3D (eXtensible 3D) to enable standards-based advanced 3D UML visualisations. Using X3D-UML, 3D UML State Machine Diagrams have been evaluated against actual user tasks and data, using the Sequential Evaluation methodology. The results of User Task Analysis, Heuristic Evaluation and Formative Evaluation phases provide clear evidence that the use of UML extended with 3D is a practical solution for visualising complex system behaviour. RoseRT model metrics show between 56%-90% of state machine diagram work would benefit from such 3D UML extensions; hence the 3D improvement can deliver considerable benefit to organisations. Keywords: X3D-UML, 3D UML, X3D, 3D Software Visualization, VRML.
1 Introduction Computers in current day software development houses are now capable of rendering quality real time 3D visualisations. In the past, 3D representations for UML have been suggested [1-4] and some research has been undertaken on specific aspects of 3D UML and related visualisations [5, 6]. Despite this, there has been no definitive research into the overall benefit of completing common and critical software engineering tasks with UML extended using 3D visualisations. If measurable benefit in 3D UML abstraction can be obtained for one task of note, then this suggests an area of potential lies untapped and idle in the graphics cards of engineers’ computers. Our research utilises the concept of X3D-UML, the presentation of UML in the Web3D ISO standard X3D (eXtensible 3D) [7], to test for benefit in the area of 3D UML state machine diagrams (also known as statechart diagrams). X3D-UML provides a standards-based approach to software visualisation, where the UML standard is presented through the X3D standard. This approach imposes constraints on the visualisation possibilities but those constraints enable the research results to be more broadly applicable to industry. X3D-UML is described further in section 2. The reason that UML is chosen as the basis for 3D software visualisation research is that it is a current and accepted standard visual notation for software systems. Basing 3D software visualisation on an existing visual notation enables new visualisations to make use of the existing visual data such as layout, colour and other visual cues, which are already familiar to software engineers. Although in current implementations it is commonly thought of as a 2D notation only, it has been noted by Booch et al. that “the UML allows you to create three-dimensional diagrams.”[8] K. Czarnecki et al. (Eds.): MoDELS 2008, LNCS 5301, pp. 264–279, 2008. © Springer-Verlag Berlin Heidelberg 2008
X3D-UML: 3D UML State Machine Diagrams
265
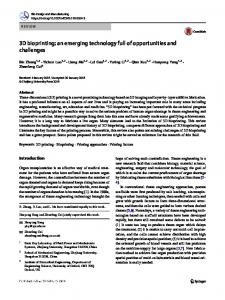
The reason that X3D, the successor to VRML (Virtual Reality Modelling Language), is chosen as the visualisation medium is that it is able to capture complete virtual environments containing 3D, 2D, animation, spatialised audio and video, user interaction, user defined objects, scripting and physical simulations[7]. However, this rich set of features only represents the visualisation possibilities, more importantly X3D is capable of rendering the types of visualisation currently found in UML, being large quantities of lines and text [9], and this capability provides the critical link between current UML and advanced UML visualisation. For this research we have used IBM Rational Rose RealTime [10] and referred to here by its common name RoseRT. RoseRT makes extensive use of state machine diagrams for describing system behaviour and these descriptions generate code (i.e. “the model is the code”). The advantage for researching state machine diagram visualisations is that software engineers work extensively with them and must define them precisely to get the system to behave as required. Also implemented is the concept of separate substate diagrams, which is recommended practice for large hierarchies [11]. The screenshot below (Fig 1) shows an example of the current 2D RoseRT state machine diagram implementation, with substates appearing on different tabs and also accessible through clicking on superstates.
Fig. 1. RoseRT example of a complete state machine with substates displayed in different window tabs. The ‘green’ state contains an icon indicating that substates exist.
Substate levels do not provide a complete state machine view but they do aid the engineer in managing the layout of diagrams and the understanding the system behaviour from different levels of abstraction. Our hypothesis is that engineers would benefit from a 3D state machine diagram giving them “the best of both worlds”, having advantages of separate substate diagrams but also the ability to view the state machine diagram as a whole.
266
P. McIntosh, M. Hamilton, and R. van Schyndel
The following sections describe X3D-UML, an overview of the methodology used to evaluate 3D UML state machine diagrams and the results so far of our research into this area. We also present some examples of future research in our conclusion.
2 X3D-UML In this section we present X3D-UML as the means of defining and testing advanced 3D UML visualisations. We present the design rules, which form the implementation independent basis of X3D-UML. Also we describe the current implementation of X3D-UML based on the UML Diagram Interchange specification[12] and how this enables 3D extensions to UML to be clearly quantified. The X3D-UML design rules provide constraints around the research undertaken. The reasons for these constraints are to focus the research results so they are as broadly applicable to industry as possible. The rules do not prevent novel areas being explored but they tether the underlying data back to existing UML development infrastructure. The constraints can be generalised to ensuring that visualisations are standards-based and that they will work with existing infrastructure, data and processes. These constraints are described below: X3D – The visualisations shall be definable and exportable in the X3D standard[7]. UML - The visualisations shall be derived from existing standard UML notation and have the ability to be returned to standard UML diagrams. Actual Data - The visualisation shall be generated directly from actual data, such as existing UML models or source code. Actual Tasks - The visualisation shall be designed using and tested against actual user tasks that are derived from user task analysis. Standard PC Hardware – The visualisations shall be usable and benefit measured on standard personal computer hardware used for software engineering (i.e. the equivalent computer hardware already being used for UML modelling). Development Environment Imitation – The visualisation should imitate the look, “feel” and work processes of the existing UML tool implementation as closely as possible. In past research we have used XSLT (eXtensible Stylesheet Language Transforms) to translate source code data into X3D with the UML visualisations predefined in an X3D “proto” library[9]. To apply X3D-UML with inbuilt functionality and to integrate it more easily with UML data, we have now developed a library, which is derived from the Diagram Interchange specification. According to the specification the goal “is to enable a smooth and seamless exchange of documents compliant to the UML standard … between different software tools.”[12], however it has been utilised in this research as a means of defining UML diagrams and further defining any extensions required to represent 3D visualisations. With the Diagram Interchange, is provided the XMI (XML Metadata Interchange) model data for the specification[13]. To create the X3D-UML library, this XMI was imported into a UML tool and code generated directly from it. This code formed the basis of a UML diagram library, which was then adapted for use with X3D. For the research presented in this paper, only minimal changes are required to achieve a 3D
X3D-UML: 3D UML State Machine Diagrams
267
state machine diagram. Simply adding a “z” value to the existing Diagram Interchange “point” class enables any graph element to be given a depth position (as well as “x” and “y”). This “z” value is then linked to state machine diagram depth as the UML model is processed, so that substate diagrams appear below their superstate.
3 Sequential Evaluation Methodology Overview In this section we present the methodology applied to evaluating 3D state machine diagrams. Sequential Evaluation is a methodology for testing 3D user interfaces[14, 15] which uses a sequence of qualitative and quantitative useability techniques ordered so that low cost and generic techniques are applied first. We have proposed refinements to this methodology for evaluating 3D UML[16] and further refinements are planned as a result of the study undertaken. In our application of Sequential Evaluation (Fig. 2) we start with the research question: “Is there measurable benefit in a state machine diagram which makes use of 3D?” We then answer the research question with results from the following stages: (1) User Task Analysis - we first define the context of actual software development through analysis of actual users’ goals, the tasks to achieve those goals and the importance of those tasks. This analysis is generated through accepted user task analysis techniques such as those described by Hackos and Redish[17]. (2) Heuristic Evaluation - the initial concept of the 3D state machine diagram is refined based on the results of user task analysis. This refined visualisation is then reviewed in the context of the defined user tasks by “Expert Evaluators” using “rule of thumb” and where possible, using documented guidelines (i.e. heuristics).
Fig. 2. Sequential Evaluation methodology [14, 15] as applied in researching 3D State Machine Diagrams [16]
268
P. McIntosh, M. Hamilton, and R. van Schyndel
(3) Formative Evaluation - the visualisation is refined based on expert feedback and then presented to users. Users are then walked through the user tasks of interest using the visualisation. With this information the visualisation is improved further. (4) Summative Evaluation - the final 3D visualisation is tested against the existing 2D for achieving the defined user tasks. The aim of this evaluation is to provide empirical results that measure the benefit of the 3D UML extension. These stages are further discussed with their results in the following sections.
4 User Task Analysis Results In this section we present our findings from User Task Analysis. The purpose of this analysis is to capture the tasks related to state machine diagrams and the importance of those tasks, with supporting metrics where possible. Part of this analysis is the understanding of the extent of substate usage in industry. To answer this, a survey of 1004 state machines, from four independent companies, was undertaken using a RoseRT model metrics script we developed. The results showed all models making extensive use of hierarchical state machines, with between 33.58% and 64.66% of all states existing at substate levels (Table 1). Table 1. Substate survey of commercial RoseRT models, showing extensive substate usage. The results are from four industries and have been generalised to areas of “office equipment”, “robotics control”, “systems control” and “networking equipment”. Totals State Machines States Level 1 States Level 2 States Level 3 States Level 4 States Level 5 States Percentage of Substates
Office
Robotics
Control
Network
216 1576 780 567 208 21 0 50.51%
172 411 273 90 48 0 0 33.58%
583 3727 1501 1295 617 274 40 59.73%
33 116 41 22 22 31 0 64.66%
4.1 User Sessions User sessions were undertaken with 3 experienced RoseRT users from a team of 5. The process is to walk through a set questionnaire with each user at their desk, then leading those closed questions to an open discussion. A later session involved observation of the users working while asking questions about their actions. From this study it was determined that the goal of all users is the same, the creation of a product subsystem. Each user owns a package within the model, which integrates to other subsystem packages. Even though the subsystems are different, the high level tasks were also the same and are as follows: • • • •
Analysis + Design (pen + paper designs and “in the head” thinking) Creating Structure and Behaviour (translating design in to implementation) Refactoring (refining implementations, fixing bugs and adding new features) Test + Debugging (testing implementation)
X3D-UML: 3D UML State Machine Diagrams
269
In the refactoring task, users were required to refactor state machine diagrams 30%-40% of their week. These were deeply nested state machines and it was observed that while doing this task, users appeared to be compensating for a limitation in the UML representation of such diagrams. Each user had a different method for overcoming that limitation that did not involve the use of the diagram itself. The next sections explain the issue in more detail and the solutions proposed. 4.2 Cognitive Load in Considering State Machine Behaviour The symptoms of the limitation in single level state machine views showed itself in users “thinking outside of the diagram”. One user claimed to be often “staring into space for 15 minutes” trying to determine the consequences of deferring one event. Another used “find” functionality to find all items in the model with an event name so they could check them off individually. Yet, another stated that they took to drawing existing state machine diagrams on paper to be able to follow events through levels. To explain this further, we consider a small hierarchical state machine diagram taken from the RoseRT help documentation on “Transition Selection Rules” (Fig. 3). This diagram is unusual as it displays the substate in the same diagram, which is not how RoseRT presents such diagrams; this gives some clue of the need to display the complete state machine when considering events, to enable better understanding.
Fig. 3. Hierarchical state machine diagram from RoseRT documentation
State machines are driven by events which trigger transitions; however the visual notation is aimed at only representing the behaviour through notation such as states and the transitions between states. The presence of events may be indicated with text notation, either implicitly through transition names or explicitly through text adornment. For small state machines, this may be sufficient, however as the complexity of a state machine increases, the complexity of considering events increases dramatically. The cognitive load on the software engineer quickly becomes very large when considering the possible permutations of the state machine behaviour, especially for hierarchical state machines. We now consider the following case study. Assume that this state machine (Fig. 3) is driven by only two events. Let us imagine that we are a software engineer who must make a change to S12. In order to implement this change we need to consider
270
P. McIntosh, M. Hamilton, and R. van Schyndel
the impact of the possible incoming events on both S12 and S1, as S12 is a substate of S1, S1 must handle events “let through” by S12 (i.e. events not handled or deferred). Now imagine that Fig.3 is two diagrams (Top and S1), as it would be in RoseRT and that we can only view one diagram at a time. In considering S12 we now have one extra “off-screen” diagram that needs to be thought about outside of the current view. If we were to add another substate level in S12 as part of that change (e.g. S123), we would have two “off-screen” diagrams to consider when working on S123. As we see, the amount of “thinking outside of the diagram” is easily doubled, tripled or more depending on hierarchical depth. 4.3 Cognitive Off-Loading Using 3D and Event Notation This section explains how 3D state machine diagrams and event notation may help the software engineer in cognition of hierarchical state machine diagrams. 3D allows the complete state machine to be viewed in one single view. Event notation is suggested as providing a visual summary of where events are handled. The figures 4-6 below summarise what information the UML presents to the software engineer and what they are required to imagine or think about to understand the effect of a single event on a state machine hierarchy. It must be stressed that at this stage of the evaluation process, neither the negative nor positive aspects of the visualisation have been tested. It is likely that aspects of the new visualisation may increase cognitive load in other areas of interpreting the information displayed. This section presents purely the proposed solution and how it has been derived from user task analysis.
Fig. 4. In the current situation the engineer is only able to view one state machine diagram at a time. In considering how a single event may be processed by the state machine, they must think about all superstates and how they may handle that event.
Fig. 5. With a 3D state machine diagram the engineer is able to view all state machine diagrams in the hierarchy and only needs to think about how each may handle that event
X3D-UML: 3D UML State Machine Diagrams
271
Fig. 6. With combined 3D and event notation the engineer need only think about the events that have impact on specific states levels, irrelevant diagrams can be ignored
4.4 Cognitive Load Metrics The initial state machine survey (Table 1) only looked at state depth (i.e. individual states within a machine) and included “empty” non-behavioural state machines, however it is now understood that a better measure of complexity is state machine diagram depth. The software engineer is not merely interested in the states themselves, they are interested in the behavioural aspects of the diagram as a whole (states, transitions, choice points etc) and the state machine diagrams higher in the hierarchy which participate in that behaviour. To analyse the extent of diagram hierarchies (as opposed to state levels), a new RoseRT script was created to count used diagrams and depth. In addition to this, the script calculated an “off-screen” metric based on the average number of additional diagrams that had to be considered for any given diagram in the hierarchy. To gather metrics, companies from the previous survey were contacted and the results of 664 state machines from 4 models are shown in Table 2. The survey shows that hierarchical state machines are used a large amount of the time (37.2%-64.4%). This result is similar to the original substate usage survey; however with more detailed information it is now revealed that between 55.74%-89.85% of all used diagrams (either substate or superstate) form part of a hierarchical structure. This high number is due to hierarchical state machines containing more diagrams. For the most complex state machine found the software engineer had to consider, on average, 3.25 other diagrams for every diagram they worked on and that state machine contained 16 diagrams in total. Table 2. New metrics for models from industries surveyed in Table 1 and a user task study subsystem. Off-screen diagrams is a cognitive measure of the average number of diagrams that need to be considered for any given diagram within a single hierarchical state machine. Totals Single Layer State Machines Hierarchical State Machines Percentage Hierarchical State/Substate Diagrams Percent Diagrams Hierarchical Average Off-screen >= 2 Average Off-screen >= 1 Max. Average Off-screen Max. Diagram Size
Robotics
Robotics
Subsystem
Control
27 16 37.2% 61 55.74% 0 1 0.75 4
67 54 44.6% 223 69.96% 1 12 2 10
n/a 3 n/a n/a n/a 2 3 3.25 16
177 320 64.4% 1743 89.85% 26 129 3.16 19
272
P. McIntosh, M. Hamilton, and R. van Schyndel
The survey clearly shows that any improvements in the area of understanding hierarchical state machine diagrams would be of great benefit to the software engineers work load. If other aspects of 3D visualisation (such as navigation issues etc) were known to be insignificant, then this survey would be evidence that 3D UML state machine diagrams would be of benefit to engineers by virtue of intuitively presenting them missing information required to do their tasks. Other aspects of 3D visualisation though are not insignificant; the question is how much benefit has been gained compared to what may be lost to other aspects such as navigation. The next phases of the research proceed to answer these questions.
5 Heuristic Evaluation Results In this section we present the Heuristic Evaluation phase and results. The goals of this phase are to obtain feedback from expert evaluators so that the initial visualisation can be refined before more user intensive testing is undertaken as part of the Formative Evaluation phase. In addition to this, to mitigate the risk that the user tasks defined may have been unusual or company specific, feedback was also sought on how the tasks might compare with usage patterns in other companies. Based on the user task analysis results, examples of 3D UML state machine diagrams were created with event notation, generated from the “Traffic Light” example model provided with RoseRT (Fig. 7). Event notation took the form of “event summaries” indicated at the top left of each diagram with a point and associated event name. If the same event was processed at different layers, the points were linked as a visual cue to which diagrams need to be considered for each event.
Fig. 7. 3D UML state machine diagram derived from user task analysis. The state machine diagram presents all diagrams in a hierarchy in a single 3D dynamic view and provides additional information about the events that drive the state machine behaviour.
Nine experts in the area of RoseRT and UML were contacted and provided with information on the defined user tasks, an evaluation report form to complete and the proposed 3D solution in the form of an X3D file which could be viewed with a browser. Evaluators were asked to “evaluate the 3D state machine diagram examples given, against the task of refactoring existing state machine diagrams.”
X3D-UML: 3D UML State Machine Diagrams
273
In the time frame given to evaluators, two evaluation reports have been received to date. Evaluator 1, was a former IBM Senior Software Engineering Specialist with over 6 years experience “with many (hundreds)”of RoseRT customers and Evaluator 2, a Senior Software Engineering Consultant in real-time model driven development. The overall opinion of the 3D state machine diagram from evaluator 1 was that “Gestures for navigation and manipulation will be difficult, but the overall development experience would be served well I think.” Evaluator 2 was already of the opinion that “a 3D view would be helpful” and suggested the idea be taken further. The results of the evaluation are summarised in the following sections. 5.1 User Task Question Responses With the Refactoring task defined as, “refining implementations, fixing bugs and adding new features”, the responses indicate that our user task analysis was indeed representative of industry and may also be applicable to the UML tool “Rhapsody”. Evaluator 1 User Task Responses Summary: “Refactoring a state machine is indeed a problem and large hierarchies can quickly become difficult to manage” and “This is mainly a problem with deep hierarchies or hierarchies that have been developed by someone else, e.g. a previous other, or teams”. The estimate for weekly task percentages was “30% structure 30% behavior (state machines), 30% design review”. Evaluator 2 User Task Responses Summary: For refactoring state machine diagrams the “experience is similar”. For task percentages the estimate was that “approx 30-45% of “normal/productive” modelling involves defining and refining behaviour and 30-40% defining and refining structure…” however actual “redesigning … should not be >=20% of the effort”. 5.2 3D State Machine Diagrams and Event Notation Question Responses The following summarises common and specific responses given in relation to 3D useability issues and event notation questions from both evaluators: Common Responses (In order of Evaluator 1 and Evaluator 2): Layout - “The lay-out needs to be applied in such a way that the 3D version of the diagram is usable” and “a new style of state diagram layout algorithm” is required. Navigation - “The 3D browser doesn’t really make navigation easy” and “an effective means to allow users to adjust to the optimal perspective” is required. Filtering - “The 3D diagram contains a lot of information. State machines work well partially because the amount of information in a diagram is strongly reduced” and “eliding all of the states not “enclosed” by the chosen state... can hide a lot of unnecessary detail” Evaluator 1 Specific Responses: Visual Connection between Layers - An enhancement would be a “connection between a state at level N and the fold-out of it at level N+1”
274
P. McIntosh, M. Hamilton, and R. van Schyndel
Evaluator 2 Specific Responses Print Layout - “printing 3D will be almost as important as on-screen visualization.” Transition paths between State Layers – “show the transitions between layers” Behaviour specific “Slices” – “it would be nice to view “slices” of a hierarchical state diagram improve understanding the design of the state machine’s behaviour.” On the questions related to the benefit of event notation, evaluator 1 did not “have a strong opinion” either way. Evaluator 2 stated “yes” it would be of benefit.
6 Formative Evaluation Results In this section we present the Formative Evaluation phase and results. The goal of this phase is to walk through the visualisation with the user to gain feedback required to refine the visualisation to a point where empirical testing can be undertaken in the Summative Evaluation phase. In this phase, two types of sessions were undertaken, an “off-site” session which was used to support the Heuristic Evaluation phase (due to the poor response rate) and “on-site” sessions with the refined visualisation. 6.1 Off-Site Formative Session Prior to revisiting the site where the initial user task analysis was undertaken, a Formative session was undertaken with a former team member using the “Traffic Light” example (Fig. 7). The session was designed to provide additional information prior to refining the visualisation for on-site sessions. The user expressed that, as it was, the visualisation would be of benefit and suggested the following improvements: • • • • • •
There needed to be a stronger visual link between substates and superstates. The event notation lines suggested incorrect relationships between states. Visually linking junction points between substates and superstates (as needed) would help when following transition paths. Showing (as needed) which transitions were triggered by each event would be useful (i.e. linking event notation points to their associated triggers). It would be useful to be able to exclude non-relevant state branches. There is even more potential benefit in 3D UML structure diagrams.
6.2 3D UML State Machine Diagram Refinements From the Heuristic Evaluation results and the Off-Site Formative Evaluation session results the following conclusions have been made regarding the visualisation and the refinements needed to better suit users’ tasks. • • •
There is definite and consistent perceived benefit in the 3D UML state machine diagram, prior to refinements. More precise user requirements are uncovered from walking through the 3D visualisation (i.e. user tasks become better defined). Layout of the diagram needs to be addressed.
X3D-UML: 3D UML State Machine Diagrams
• • • • •
275
Navigation within the diagram needs to be addressed. Connections between substates and superstates needs to be clearer. Dynamic user controlled filtering of irrelevant data is required. Dynamic user controlled presentation of more data is required. Event notation links were not strongly desired and had negative aspects.
Based on these conclusions the visualisation (Fig. 8) was refined in the following ways: • • • • • •
Event notation lines, junction point lines and other data enhancements were not implemented to determine through user feedback if these were indeed required for tasks (i.e. gain more precise user requirements in this area). Event notation summaries were listed at the bottom of diagrams. The user was provided with the ability to create and save a diagram layout. The ability to reposition the whole diagram in the view was introduced. Transparent connection “cones” visually linked superstates and substates. The ability to “shrink” branches to filter data was introduced.
Fig. 8. Refined 3D UML state machine diagram example. The “working” branch is laid out for easy viewing and the “initializing” branch, which is not of interest, is "shrunk" (top right). Event notation is shown as a summary at the bottom of applicable state machine diagrams.
6.3 On-Site Formative Session With the refined 3D diagram, an on-site visit with the original RoseRT team was arranged. In this session the users were individually taken through a 10 minute training session with the new visualisation based on the “Traffic Light” example model (Fig.8) and were taught basic X3D browser navigation techniques; such as how to centre the diagram, rotate and examine, layout the diagram and save that layout. Users were then asked to pick an actual state machine diagram from a model they were working on and, from the chosen diagram, a 3D state machine diagram was generated. Users were then asked to walk through the diagram and comment on the features they need to do their job, as well as usability aspects. An example of the most
276
P. McIntosh, M. Hamilton, and R. van Schyndel
complex state machine diagram generated is given in figure 9, with this diagram having an “off-screen” average of 3.25 diagrams (see 4.5 Cognitive Load Metrics). All users stated that they saw benefit in the 3D UML state machine diagram and the event notation. The users stated this in strong terms with one user stating “of course” (it would be useful) as though it was such an obvious question it should not be asked, and another stating it would be “definitely useful”.
Fig. 9. Complete 3D UML state machine diagram generated from actual user data
The users each spent 30 minutes walking through the diagram and commenting on improvements. As part of this process a new low-level user task was uncovered related to tracing transitions through multiple diagram levels for a specific purpose. Users needed to logically highlight transition “chains” (i.e. groups of transitions) to analyse particular aspects of a state machine and these transition groups often spanned multiple levels of diagram. This user task was a logical extension to linking junction points between diagrams, as they form part of a transition chain. The improvements suggested by the users are grouped together below in their respective categories and these are planned to be implemented before the Summative Evaluation (empirical testing) phase is undertaken: Dynamic Features for Multi-Level Transition Tracing • Highlight transition chains of interest. • Link transition relationships at the same level in the hierarchy. Essential Data • Dynamic junction point linking between substate and superstates. Navigation Improvements • Restrict navigation options to prevent awkward views. • Allow quick navigation to individual state machine diagrams. • Hot-keys to navigate to different view aspects.
X3D-UML: 3D UML State Machine Diagrams
277
User Preferences • Opacity configuration to suit user preferences and different graphics capabilities of machines. • Ability to adjust layout diagram depth to suit diagram size.
7 Conclusions and Future Research The results of our research to date present consistent evidence that there is benefit in 3D UML state machine diagrams. Though final empirical user testing will provide a more definitive answer and better quantify the benefit, the analysis so far highlights a common and critical software engineering task that benefits from an alternative UML visualisation provided by 3D. Both user and expert evaluation sessions provide qualitative evidence that benefit already exists in our 3D UML state machine diagram, however further refinements have been suggested to capitalise on 3D visualisation possibilities and improve navigation, to increase that benefit further. The benefit of 3D UML state machine diagrams is in the area of understanding hierarchical state machine diagrams. Both user and expert responses show that this is an area of known concern and our analysis captures the extent. For RoseRT engineers, defining state machine behaviour is a task which occupies 30%-40% of their effort and our model metrics survey shows that between 56%-90% of that effort is likely to be related to hierarchical state machines. We further quantify the issue through a metric of “off-screen” information missing from the engineers’ view which indicates the level of “out of diagram thinking” currently required. The next phase of this research is Summative Evaluation, where the final refined 3D UML state machine diagram will be empirically tested for benefit on a larger user base. The generic benefit measures of speed and accuracy will captured from users completing typical tasks on the same model with both 2D and 3D UML state machine diagrams. The tests will make use of state machines with increasing complexity, so that we can chart performance of 2D vs. 3D diagrams over a range of complexity. This measure of “complexity benefit” will enable models to be analysed through our metrics script to predict overall benefit based on a complexity profile of each model.
Fig. 10. Testing 3D UML visualisation at the RMIT Virtual Reality Centre
278
P. McIntosh, M. Hamilton, and R. van Schyndel
Due to the success of the 3D state machine diagram results, we have also commenced research into 3D UML system views. Based on user task analysis of teams collaborating on large software projects, these views will be able to capture the complete UML model in a single dynamic 3D view, allowing users to view the system as a whole, as well as filter data and highlight areas of interest. These views will be available to individuals through their standard workstations and are also being implemented for team use at RMIT’s Virtual Reality Centre (Fig 10).
Acknowledgements We would like to thank: RMIT for PhD scholarship funding; Expert Evaluators, Mark Hermeling and Tim Coddington; the anonymous users that volunteered their time; Garry Keltie for RMIT VR Centre assistance and Laura McIntosh for graphics.
References 1. Gil, J., Kent, S.: Three dimensional software modelling. In: Proceedings of the 20th international conference on Software engineering, Kyoto, Japan. IEEE Computer Society, Los Alamitos (1998) 2. Gogolla, M., Radfelder, O., Richters, M.: Towards Three-Dimensional Animation of UML Diagrams. In: France, R.B., Rumpe, B. (eds.) UML 1999. LNCS, vol. 1723. Springer, Heidelberg (1999) 3. Radfelder, O., Gogolla, M.: On better understanding UML diagrams through interactive three-dimensional visualization and animation. In: Proceedings of the working conference on Advanced visual interfaces, Palermo, Italy. ACM, New York (2000) 4. Thaden, U., Steimann, F.: Animated UML as a 3d-illustration for teaching OOP. In: ECOOP 2003 - Object-Oriented Programming. Proceedings of the 17th European Conference, Darmstadt, Germany. Springer, Heidelberg (2003) 5. Irani, P., Ware, C.: Diagrams based on structural object perception. In: Proceedings of the working conference on Advanced visual interfaces, Palermo, Italy. ACM, New York (2000) 6. Dwyer, T.: Three dimensional UML using force directed layout. in Australian symposium on Information visualisation, Sydney, Australia. Australian Computer Society, Inc. (2001) 7. Web3D Consortium. Extensible 3D (X3D) - ISO/IEC FDIS (Final Draft International Standard). 19775:200x (2004) 8. Booch, G., Rumbaugh, J., Jacobson, I.: The Unified Modeling Language User Guide. Addison-Wesley, Reading (1998) 9. McIntosh, P., Hamilton, M., Schyndel, R.v.: X3D-UML: Enabling Advanced UML Visualisation Through X3D. In: 3D technologies for the World Wide Web - Proceedings of the tenth international conference on 3D Web technology, Bangor, United Kingdom. ACM Press, New York (2005) 10. IBM, Rational Rose Technical Developer (2008), http://www-306.ibm.com/ software/awdtools/developer/technical/ 11. Ambler, S.W.: The Elements of UML(TM) 2.0 Style. Cambridge University Press, Cambridge (2005) 12. Object Management Group. Unified Modeling Language: Diagram Interchange - version 2.0 (2003)
X3D-UML: 3D UML State Machine Diagrams
279
13. Object Management Group. Diagram Interchange - XML file (2007), http://www. omg.org/cgi-bin/doc?ptc/05-06-07 14. Gabbard, J.L., Deborah, H., Swan, J.E.: User-Centered Design and Evaluation of Virtual Environments. IEEE Comput. Graph. Appl. 19(6), 51–59 (1999) 15. Bowman, D.A., et al.: 3D User Interfaces: Theory and Practice. Addison-Wesley/Pearson Education, London (2005) 16. McIntosh, P., Hamilton, M., Schyndel, R.v.: 3D UML State Machine Diagrams Evaluation Methodology (2008), http://www.x3d-uml.org/Publications/Technical_ Reports 17. Hackos, J.T., Redish, J.C.: User and task analysis for interface design, p. 488. John Wiley & Sons, Inc., Chichester (1998)