XML Database Support for Program Trace Visualisation Craig Anslow, Stuart Marshall, Robert Biddle, James Noble, and Kirk Jackson School of Mathematical and Computing Sciences Victoria University of Wellington Wellington, New Zealand Email:
[email protected]
Abstract Program traces can be used to drive visualisations of reusable components, but such traces can be gigabytes in size, are very expensive to generate, and are hard to extract information from. We have developed a solution to this problem, an XML Data Storage Environment (XDSE) for storing XML based program traces in a native XML database. We use XQuery to extract information from the program traces and the results are then transformed into understandable visualisations. Keywords: Program Traces, Component Reuse, Software Visualisation, Native XML Databases, XQuery. 1
Introduction
Program traces can be used to drive visualisations of reusable components, but the program traces required can be gigabytes in size, are very expensive to generate, and are hard to extract specific information from. We need a way to store the program traces so that we can extract information in order to generate meaningful visualisations of reusable components. Our solution to this problem is an XML Data Storage Environment (XDSE) (pronounced “ecstasy”) for storing and querying XML based program traces of reusable components in a native XML database. Using XDSE, program traces can be stored, then queried using XQuery, and afterwards transformed into appropriate visualisations. These visualisations can help developers understand how the reusable components work, and whether or not they can be reused in a new software program. Developers reusing software components need to understand how the components work and how they can be reused. However, this is difficult in practice. Helping developers understand software components by creating visualisations of them means that they will potentially be able to use them in their program. To visualise a design or a software component, certain information has to be selected. Extracting the correct information and gathering it in program traces is a difficult procedure. There are many factors which can affect this procedure, such as the language the software component is written in, or the design complexity. One method for deriving this information is to examine applications executing. This can be done in Copyright (c)2004, Australian Computer Society, Inc. This paper appeared at the Australasian Symposium on Information Visualisation, Christchurch, 2004. Conferences in Research and Practice in Information Technology, Vol. 35. Neville Churcher and Clare Churcher, Eds. Reproduction for academic, not-for profit purposes permitted provided this text is included.
various ways such as using debuggers or modified execution environments. This method generates static and run-time information about a component such as class descriptions and the methods that have been invoked on objects. The benefit of program traces is that multiple visualisations can be generated from a single program trace. Program traces are expensive to generate because they are extremely large and take a long time to create. We store the program traces, so that when creating visualisations only subsets of information need to be extracted rather than using a whole program trace. Using a whole program trace takes more processing time to generate visualisations. Our approach to encapsulating the information of a program trace is to encode it using XML. We have initially used our existing XML based language called the Process Abstraction Language (PAL). We have since developed a new and improved version which has separate parts for static and run-time information. The static part is called Reusable Component Descriptions (RCD) and the run-time part eXtensible Trace Executions (XTE). The paper is organised as follows. In section 2, we describe our motivation for storing and querying program traces so that we can create useful visualisations. Section 3 presents XDSE, for storing and querying program traces. A summary of related work appears in section 4, future work in section 5, and our conclusions in section 6. 2
Motivation
The main reasons for wanting to reuse components are to save on time, effort, and costs in both development and maintenance of quality software. This will mean the developer will not have to implement a new solution to an old problem. Instead they can recycle existing components to solve their problem. Research into component reuse has been happening for a long time (McIllroy 1968) and includes many areas of focus; several overviews are available (Mili, Mili & Mili 1995, Jacobson, Griss & Jonsson 1997, McClure 1997, Poulin 1997). There are many ways component reuse can be applied. For example, copying and pasting code into a new program, inheritance of classes, instantiation of common methods within programs, using a framework, and using an application programming interface (API). When reusing a component it may need to be modified or extended in some way so that it will meet the requirements of the new program. The assumption is that even modifying or extending a component will result in the reduction of time, cost and effort compared with designing the component from scratch.
Test Drive Program Interface
Test Drive Interface
Visualisation Interface
Component Repository Interface
Transformer Repository Interface
Network
Session Manager
Component Repository
Component Set
Engine Repository
Transformer Repository
Engine
Transformer
XDSE
Test Drive Report Repository
Visualisation Repository
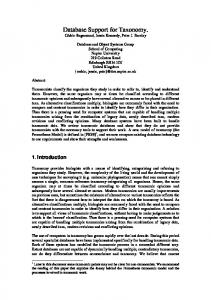
Figure 1: The VARE architecture is based on a client/server model, with the server being split into repositories and processes. Dashed lines represent test drive or visualisation input/output, while solid lines represent control, queries or responses. XDSE implements the test drive traces/report and visualisation repositories at the bottom of this figure.
A key benefit from reusing components is that when modifications, bug fixes or updates occur, the developer can save time by incorporating them into their program. Problems then don’t have to be solved for every instance. This can happen on a global scale and examples include online updates of both proprietary and open source software. We are interested in understanding reusable components so that developers can reuse them in their new programs. Currently several techniques exist to help understand how software works and these include documentation, experimenting, and visualisations. Documentation is sometimes provided with software either in online or in written form, but is often difficult to use, read and understand. Experimenting with reusable components means that developers will gain practical experience and learn how components work. Visualising components either as static or run-time images can show developers how components have been designed, and how they work when executed. 2.1
amining or spying on programs during execution and gathering events in a program trace. The types of information that can be gathered include object creation and deletion, method calls and returns, field accesses and modifications, exceptions, and multi-threading issues. When visualising reusable components we have focused on three different types of information. These include understanding what a component does, how a component works, and how a component can be reused. For what a component does, it is important to look at the external side-effects and the results that occur as a consequence of interacting with the component’s public interface. For how a component works, it is important to look at the internals of a component. This is because it may open up opportunities for modifying the component’s behaviour to what is required by replacing sub-components, extending components or overloading methods. For how a component can be reused or modified, it is important to look at how it has previously been used.
Software Visualisation
2.2
We are interested in visualising reusable components for the purposes of understanding and we separate software visualisations into two sets:
Visualisation (VARE)
Architecture
for
REuse
Our software visualisations are based on the VARE architecture (Marshall, Jackson, Biddle, McGavin, Tempero & Duignan 2001). VARE is used for generating visualisations in a distributed environment and is based on the Program Mapping Visualisation (PMV) conceptual model for describing program visualisation systems (Stasko 1990, Roman & Cox 1993). The design of VARE supports multiple programming languages and provides user control for the different parts in the visualisation process.
1. Static visualisations: can be created from investigating the source or binary files, which can contain class descriptions along with their methods and variables, inheritance hierarchies between classes, and dependency hierarchies amongst classes. 2. Run-time visualisations: can be composed by ex2
VARE is a client-server architecture (see figure 1). The server contains repositories and processes. On the client side, the user manages the activities associated with creating and viewing a visualisation. The component repository interface lets the user select a component from the repository to create a component set. Once this is created, the user can select an engine type from the engine repository to control the test driving of these components. The engine component is synonymous to the program component in the PMV model. The engine generates a test drive trace as output, which is stored in the test drive traces/report repository. A test drive trace contains all the information required to describe a program execution such as the order of object creation, method invocations, field accesses and field modifications. A test drive trace is then used as input to a transformer, which is synonymous to the mapping component from the PMV model. The transformer repository interface lets the user select the transformer to use and the test drive trace to use with it. The transformer then transforms the test drive trace into an appropriate visualisation. Finally the finished visualisation is stored in the visualisation repository. The visualisations contain information such as a description of the components they are associated with, who created them, and notes that help the understanding of the visualisation. The visualisation interface lets a user choose a particular visualisation and control its presentation. 3
including objects, run-time representations of classes, method calls with their arguments and return values, and different threads of control. More recent experiments with VARE identified weaknesses in PAL because it combined static and run-time information. XDSE splits this functionality into two separate languages, RCD and XTE. Reusable Component Descriptions (RCD) store static information of reusable components, where a component is defined as consisting of one or more packages, and each package having one or more classes. eXtensible Trace Executions (XTE) stores execution trace information derived dynamically from test driven reusable components. XTE stores the run-time information of RCD components. 3.2
Native XML databases store XML documents because when XML documents are stored in relational databases information can be lost, such as element ordering and the distinction between attributes and elements. Native XML databases can store either document or data centric XML documents which contain elements, attributes, and parsed character data. The benefit of native XML databases is that they preserve physical document structure, keep all information that non XML databases drop, use XML query languages, speed up retrieving whole documents, and can store XML documents without a DTD or an XML Schema. Native XML databases are not required to have any particular underlying physical storage model and can be built on relational, hierarchical, or object-oriented databases. The key point of native XML databases is that their internal models are based on XML (Bourret 2003). Common features among native XML databases include document collections which contain documents of the same type (see figure 2), XML query languages such as XQuery and XPath, updating & deleting of documents, transactions, locking, concurrency, APIs, indexing and round tripping (the ability to store a document and get the same document back again). Round tripping is important for document centric XML applications because it relies on the exact ordering of elements in a document.
XDSE: An XML Data Storage Environment
The test drive traces/report and visualisation repositories are key components of the VARE architecture. In this section we present XDSE, which provides an implementation of these repositories. The main feature of XDSE is to store and query program traces from a native XML database (Anslow 2003). The native XML database that we used was Ipedo (Ipedo 2003), because it supported our required functionality and included a Java and Simple Object Access Protocol (SOAP) API. The following sections describe XML program trace languages (3.1), some XML technologies (3.2), the architecture of XDSE (3.3), a demonstration of XDSE in action (3.4), and discuss VARE based program trace visualisation tools (3.5). 3.1
XML Technologies
Native XML Database Server
XML Program Trace Languages
It is important for the format of a program trace to support many requirements for the creation of visualisations (Marshall, Jackson, Anslow & Biddle 2003). We have decided that XML is a good medium for formatting our program traces because it is an open standard and there are many technologies built on top of XML (see 3.2). We have created two different XML based program trace languages of reusable components that can be used to generate software visualisations. They each have features for representing both static and runtime information, and are defined by Document Type Definitions (DTD). The Process Abstraction Language (PAL) (McGavin 2001, Marshall et al. 2001) defines an XML specification for object models designed to help visualisation tools get the information they need to generate useful visualisations. PAL describes objectoriented programs. It has elements for describing classes, super-classes, methods, and fields. PAL can also describe the run-time behaviour of programs,
Collection 1
Documents
Collection 2
Documents
...
Collection N
Documents
Figure 2: Native XML Databases store XML documents of the same type in document collections, similar to relational databases that store tuples in tables. XQuery (Boag, Chamberlin, Fernandez, Florescu, Robie & Simeon 2002) is the de facto standard XML query language. XPath (Clark & DeRose 1999) is a subset of XQuery and consists of path expressions. XQueries contain FLWR (pronounced 3
HTTP Messages
SOAP Messages (XML file fragments)
JSP Pages JSP Web Server
Internet
workstation 1
...
Ipedo Native XML Database Server
collection 1
... collection 5
HTTP Messages
workstation N
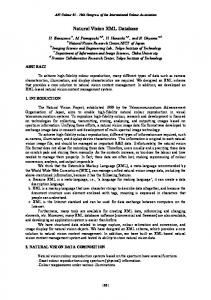
Figure 3: The XDSE architecture is based on the client/server model. The web interface communicates with a JSP web-server which sends and receives SOAP messages from the Ipedo Native XML Database. The Ipedo Native XML Database stores program trace documents in program trace collections.
“flower”) expressions, which are very similar to the SELECT-FROM-WHERE clauses in the SQL standard. FLWR expressions consist of FOR, LET, WHERE and RETURN clauses:
the program trace language. Figure 4 shows querying the PAL program trace document, test.pal. The user has two options to enter a query, either: 1. Upload the XQuery file.
• FOR: binds one or more variables (e.g $X, $Y) to a sequence of nodes returned by another expression (usually a path expression) and iterates over the nodes. The variable represents an array of bound nodes.
2. Type the XQuery query into the text box. Once the user clicks the submit button the query is executed and the results are displayed further down the page. This is so that another query can be generated without going to another web page. The query in figure 4 retrieves all the rawvalue elements from the test.pal program trace document. There are various types of information that could be extracted from a program trace document that has been stored in the native XML database using XQuery. The advantage of this approach is that only relevant information is required from the native XML database to create a visualisation. The whole program trace document is not required. This may mean parsing the results of a query, to create a visualisation will improve performance, because the XML fragment is smaller than the entire program trace document. Figure 5 shows a query of relevant class information, to create a UML class diagram from test classes.rcd, an RCD program trace document. The query includes the name of the class, the inherited super-classes, methods, and fields. Arguments for the methods and the types of the fields could be retrieved as well.
• LET: binds one or more nodes but without iterating. A single sequence of nodes is bound to the variable. • WHERE: contains one or more predicates that filter or limit the set of nodes as generated by the FOR and LET clauses. • RETURN: generates the output of the FLWR expression. The RETURN clause usually contains the references to variables and is executed once for each bound node-reference that was returned by the previous clauses. 3.3
Architecture
XDSE is a client/server architecture (see figure 3). Program traces are stored in the Ipedo Native XML Database (Ipedo 2003). The web interface accesses the native XML database which communicates with a Java Servlet Pages (JSP) web-server (implemented with Apache’s Tomcat web server version 4.1.12) to request JSP pages. The web interface has a series of user options. Upon submission of the user selection, the JSP page executes a remote method from the SOAP client. The submission initiates the webserver to communicate with the SOAP server associated with the native XML database to invoke the remote method. Once the program trace documents are either stored or queried from the native XML database, a response is sent back to the client and displayed in the web interface. 3.4
namespace rcd = "http://www.mcs.vuw.ac.nz/renata/rcd" for \$t in document("RCD/test_classes.rcd")//rcd:class return {$t/rcd:classname} {$t/rcd:superclassname} {$t//rcd:methodname} {$t//rcd:fieldname}
Figure 5: An XQuery query to generate a UML class digram which extracts the following information the name of the class, the inherited super classes, methods, and fields from test classes.rcd.
Demonstration of XDSE in Action
XDSE has the following user options: create, delete, or list program trace collections; add, remove, query, or list PAL, RCD or XTE program trace documents. When creating, deleting, or listing a collection only the name of the collection needs to be supplied. When removing or listing program trace documents only the name of the program trace document has to be specified. When program traces are added to the native XML database they are validated against the DTD of
Figure 6 shows the results from executing the query in figure 5. The results show the following classes: MainClass, TestClass2, and MyThreadClass. Method names and field names of each class are also shown. For each query that uses an RCD or XTE program trace document, the appropriate namespace has to be declared.
4
Figure 4: The XDSE web interface where a user can create, delete, or list program trace collections; add, remove, query, or list PAL, RCD or XTE program trace documents. This figure shows querying test.pal, a PAL program trace document. Entering a query can either be accomplished by uploading the XQuery file or typing the query into the text box provided. The result of the query is displayed at the bottom of the web page. This query retrieves all the rawvalue elements in the test.pal program trace document.
SOAP is used to transport information in VARE and is used in XDSE for the web-server to communicate with the native XML database. SOAP is a lightweight protocol for the exchange of information in a decentralised, distributed environment. SOAP is an XML based protocol that consists of three parts: an envelope that defines a framework for describing what is in a message and how to process it, a set of encoding rules for expressing instances of application-defined datatypes, and a convention for representing remote procedure calls and responses (Box, Ehnebuske, Kakivaya, Layman, Mendelsohn, Nielsen, Thatte & Winer 2000). Figure 7 shows a SOAP request message, to query test.pal by invoking the remote executeXQuery method. Lines 1-5 show the HTTP header, lines 8-28 the SOAP envelope, and lines 12-27 the SOAP body. The results of the query are the same as in the bottom of figure 4, but are returned to the user wrapped in return tags. The SOAP message was captured using netcat, which is a simple Unix utility which reads and writes data across network connections.
MainClass java.lang.Object init doOperation close main _field _thread TestClass2 java.lang.Object method1 getSize myRcd:StaticMethod _field1 _field2 _field3 MyThreadClass java.lang.Thread run stopThread continueThread getCount _count _message _continue
Figure 6: The results of performing the query in figure 5. The results show the following classes: MainClass, TestClass2, and MyThreadClass, as well as the method and field names of each of these classes.
5
1. 2. 3. 4. 5. 6. 7. 8. 9. 10. 11. 12. 13. 14. 15. 16. 17. 18. 19. 20. 21. 22. 23. 24. 25. 26. 27. 28.
POST /soap HTTP/1.0 Host: wakefield Content-Type: text/xml; charset=utf-8 Content-Length: 703 SOAPAction: "" for $t in document ("PAL/test.pal")//event/methodcall/argvalues/argvalue/value, $e in $t/rawvalue return {$e} craig craig
Figure 7: A SOAP request to query test.pal. The request shows the HTTP header, the SOAP envelope, and the query inside the body of the message. 3.5
Program Trace Visualisation Tools
Abstraction Tool (AT) (McGavin 2001, Marshall et al. 2001) is an implementation of an engine from the VARE architecture. AT is a prototype utility that has been developed to extract information from applications and present the information using PAL, so that visualisations tools can visually display the information to a developer. AT examines programs written in C++, using the GNU Debugger (GDB). It is written in the Python scripting language. The main tasks of AT are to drive GDB, and to output XML based on what was seen during execution. AT also uses SOAP for remote method invocation, to allow AT to be controlled by another application. AT could be integrated into XDSE by communicating with the native XML database via a SOAP web-service rather than using the web interface, because AT also uses SOAP for remote method invocations. Blur (Duignan, Biddle & Tempero 2003) is an implementation of a transformer from the VARE architecture. Blur takes a PAL program trace document and transforms it into Scalable Vector Graphics (SVG) (Ferraiolo, Jun & Jackson 2003) visualisations for viewing over the web. Blur is implemented as a Java Servlet running a version of Apache Tomcat. Figure 8 shows a SVG UML interactive class diagram from a PAL program trace document generated by Blur. When the mouse covers a piece of code in the right hand side frame, the left hand side highlights the appropriate class or method in the UML class diagram. This is a helpful tool for developers, because it shows where the code is located in a file, and how it is associated with other classes in a program. Figure 9 shows a SVG sequence diagram generated by Blur from run-time information found in the same PAL program trace document as that of figure 8. The sequence diagram is interactive and allows the user to navigate, zoom-in-out, and fold and unfold call sequences to better understand the diagram. Blur could be integrated into XDSE by having a SOAP mechanism at the Blur side, to retrieve pro-
gram trace data. Blur gets program trace documents from a file system and uses all of the program trace to generate a visualisation. Using all of the program trace to generate a visualisation is not an efficient process because if the program trace is very large, it will take a long time to parse, and send across a network. The better approach is to extract subsets of the program trace, send them across the network using SOAP, and then generate visualisations. If XDSE were integrated with Blur then a class diagram, similar to figure 8, could be generated by Blur from the query in figure 5. Blur does not store any of its SVG visualisations, but if Blur could communicate with XDSE then it could store the SVG visualisations in the native XML database. These SVG visualisations do not require a DTD or an XML Schema, which means that when adding visualisations to the native XML database they do not need to be validated and can all be stored in the same visualisation collection. 4
Related Work
Two software visualisation systems that use database technologies are BLOOM (Reiss 2001) and Jinsight (Pauw, Kimelman & Vlissides 1994, Pauw, Mitchell, Robillard, Sevitsky & Srinivasan 2001). Other systems include ANIM (Bentley & Kernighan 1991), the Field Programming Environment (Reiss 1995), the Desert Environment (Reiss 1998), Visor++ (Oudshoorn & Widjaja 1998) and Tarantula (Eagan, Harrold, Jones & Stasko 2001). 4.1
BLOOM
BLOOM is a system for understanding software by analysing static and dynamic information through visualisations. BLOOM stores program traces in two files. One file contains the trace data in a compressed binary format. This file consists of a series of records indicating the following types of events: entry and exiting a method, the amount of memory allocated to an object, the amount of time an object takes to execute, the amount of time an object waits for a resource, when an object is created and deleted, and when memory is freed. The second file contains records describing the classes, methods, and objects accessed in the trace. The second file can be stored in a mappable form consisting of hash tables for easy and quick access. Once mapped into memory the second file does not have to be read or processed, but the file can get rather large, up to 100GB. XML files are used to store the analyses of the trace data. BLOOM also has a visual query language for specifying what information should be visualised. 4.2
Jinsight
Jinsight is a tool for visualising and analysing the execution of Java programs. It is useful for performance analysis, memory leak diagnosis, debugging, or any task in which a user needs to better understand what a Java program is really doing. The aim of Jinsight is to help a user better understand, tune, and debug a program. Jinsight provides instrumentation for making trace data which is captured in a proprietary format, and then saved to a file or sent over a socket to a visualiser for live analysis. The visualiser works with an in-memory model that it constructs from the trace data using Java collections. The visualiser does not use any formal relational or object-oriented database. The visualiser, however has
6
Figure 8: A SVG interactive class diagram generated by Blur (a visualisation tool) from a PAL program trace document. When the user places the mouse over a piece of code in the right hand side frame, the left hand side highlights the appropriate class or method in the UML class diagram.
7
Figure 9: A SVG interactive sequence diagram generated by Blur from a PAL program trace document of runtime information. The diagram allows the user to navigate, zoom-in-out, and fold and unfold call sequences to better understand the diagram.
8
mechanisms that give it some database-like functionality. For example, the ability to formally access attributes of each Java object representing a trace element, and a query mechanism backing the “execution slices”. Jinsight uses the Java AWT and Swing packages for rendering visualisations (Sevitsky, Pauw & Konuru 2001).
Bourret, R. (2003), ‘XML and databases’, Website. http://www.rpbourret.com.
5
Clark, J. & DeRose, S. (1999), ‘XML path language (XPath) version 1.0’. World Wide Web Consortium (W3C) http://www.w3.org/TR/xpath.
Box, D., Ehnebuske, D., Kakivaya, G., Layman, A., Mendelsohn, N., Nielsen, H. F., Thatte, S. & Winer, D. (2000), ‘Simple object access protocol (SOAP) 1.1’. World Wide Web Consortium (W3C) http://www.w3.org/TR/SOAP/.
Future Work
In the future, we plan to make XDSE integrated and linked to engines and transformers from VARE, as it would provide an overall system for a user. We plan to add extra functionality to XDSE so that it can validate PAL, RCD, and XTE program traces against generated XML schemas. Using indexes on commonly used program trace documents in the native XML database would improve the performance of querying these program traces, hence the transformation process of generating a visualisation could be completed faster. Having built in queries or a visual query language for class diagrams and sequence diagrams, would also help performance. One other key feature that will be implemented in XDSE is the ability to update program traces, so that they can be changed and modified in the future. In principle there should be no need to change a program trace once it has been created, but it may be useful to improve a visualisation. This can either be done by using the proprietary API for updates that Ipedo provides, or by waiting until the update functionality is added to XQuery. 6
Duignan, M., Biddle, R. & Tempero, E. (2003), Evaluating scalable vector graphics for use in software visualisation, in ‘Proceedings of the Australian symposium on Information visualisation’, Australian Computer Society, Inc., pp. 127–136. Eagan, J., Harrold, M. J., Jones, J. A. & Stasko, J. T. (2001), Technical note: Visually encoding program test information to find faults in software, in ‘INFOVIS’, pp. 33–36. Ferraiolo, J., Jun, F. & Jackson, D. (2003), ‘Scalable vector graphics (SVG) 1.1 specification’. World Wide Web Consortium (W3C) http://www.w3.org/TR/SVG11/. Ipedo (2003), ‘Ipedo XML database website’, Website. http://www.ipedo.com. Jacobson, I., Griss, M. & Jonsson, P. (1997), Software Reuse: Architecture, Process and Organization for Business Success, Addison-Wesley. Marshall, S., Jackson, K., Anslow, C. & Biddle, R. (2003), Aspects to visualising reusable components, in ‘Proceedings of the Australian symposium on Information visualisation’, Australian Computer Society, Inc., pp. 81–88.
Conclusion
In this paper we have demonstrated that XDSE, an XML Data Storage Environment, can be used to store program traces. Program traces can be gigabytes in size, are very expensive to generate, and are hard to extract information from. We address these issues by storing the program traces in a native XML database, Ipedo. Our program traces, Process Abstraction Language (PAL), Reusable Component Descriptions (RCD), and eXtensible Trace Executions (XTE) can then be queried using XQuery to extract necessary information. This information can then be transformed into either static or run-time visualisations. XDSE is a useful tool for storing and querying program traces so that useful information can be extracted from the program traces and then transformed into meaningful visualisations. The purpose of this technique is so that a developer can understand how a component works, and whether or not it can be reused in their new program.
Marshall, S., Jackson, K., Biddle, R., McGavin, M., Tempero, E. & Duignan, M. (2001), Visualising reusable software over the web, in ‘Proceedings of the Australian symposium on Information visualisation’, Australian Computer Society, Inc., pp. 103–111. McClure, C. (1997), Software Reuse Techniques: Adding Reuse to the System Development Process, Prenctice-Hall Inc. McGavin, M. (2001), Extracting software reuse information for visualisation tools. Honours Report, School of Mathematical and Computing Sciences, Victoria University of Wellington. McIllroy, M. D. (1968), Mass produced software components, in P. Naur & B. Randell, eds, ‘Report on a Conference of the NATO Science Committee’, pp. 138–150.
References
Mili, H., Mili, F. & Mili, A. (1995), ‘Reusing software: Issues and research directions’, Software Engineering 21(6), 528–562.
Anslow, C. (2003), XML database support for program trace visualisation. Honours Report, School of Mathematical and Computing Sciences, Victoria University of Wellington.
Oudshoorn, M. & Widjaja, H. (1998), Visor++: A visualisation tool for concurrent object-oriented programs, in ‘In Proceedings of the 8th International Conference on Computer Graphics and Visualization’, Moscow, pp. 287–294.
Bentley, J. L. & Kernighan, B. W. (1991), ‘A system for algorithm animation’, Computing Systems 4(1).
Pauw, W. D., Kimelman, D. & Vlissides, J. (1994), Modeling object-oriented program execution, in ‘Lecture Notes in Computer Science’, Vol. 821, European Conference for Object Oriented Programming, Springer Verlag, Bologna, Italy, pp. 163–182.
Boag, S., Chamberlin, D., Fernandez, M. F., Florescu, D., Robie, J. & Simeon, J. (2002), ‘XQuery 1.0: An XML query language’. World Wide Web Consortium (W3C) http://www.w3.org/TR/xquery/. 9
Pauw, W. D., Mitchell, N., Robillard, M., Sevitsky, G. & Srinivasan, H. (2001), Drive-by analysis of running programs, in ‘Proceedings for Workshop on Software Visualization’, International Conference on Software Engineering, Toronto, Canada. Poulin, J. S. (1997), Measuring Software Reuse: principles, practices, and economic models, AddisonWesley Longman Inc. Reiss, S. P. (1995), The Field Programming Environment: A Friendly Integrated Environment for Learning and Development, Kluwer Academic Publishers. Reiss, S. P. (1998), Software visualization in the Desert environment, in ‘Proceedings of the 1998 ACM SIGPLAN-SIGSOFT Workshop on Program Analysis for Software Tools and Engineering’, ACM Press, pp. 59–66. Reiss, S. P. (2001), An overview of BLOOM, in ‘Proceedings of the 2001 ACM SIGPLAN-SIGSOFT Workshop on Program Analysis for Software Tools and Engineering’, ACM Press, pp. 2–5. Roman, G.-C. & Cox, K. C. (1993), ‘A taxonomy of program visualization systems’, IEEE Computer 26(12). Sevitsky, G., Pauw, W. D. & Konuru, R. (2001), An information exploration tool for performance analysis of Java programs, in ‘Proceedings for TOOLS Europe 2001’, Technology of ObjectOriented Languages and Systems (TOOLS) Conference Series, Zurich, Switzerland. Stasko, J. T. (1990), ‘Tango: A framework and system for algorithm animation’, Computer 23(9), 27–39.
10