Urinary amino acid excretion in untimed and 24-h samples of aminoaciduria patients. Cystinosis. Lowe syndrome. Leucinosis. Phenylketonuria. Cystinuria.
Clinical Chemistry 47:3 575–583 (2001)
General Clinical Chemistry
Year-Long Validation Study and Reference Values for Urinary Amino Acids Using a Reversed-Phase HPLC Method Rafael Venta Background: Reversed-phase HPLC (RP-HPLC) has become an alternative to ion-exchange chromatography for amino acid analysis in biological fluids. However, validation studies for its urine application are limited, and the corresponding reference values have not been reported extensively. We studied the long-term performance of a commercial HPLC method for urine amino acid analysis and established specific age-related reference values for urine amino acid excretion. Methods: Method performance was continuously assessed by recovery and precision studies with urine samples and controls, respectively. Healthy individuals were prospectively analyzed throughout a 5-year period. Excretion of individual amino acids, expressed as mmol/ mol of creatinine, was included in six age-related groups for random urine samples (0 –1 month, 1–12 months, 1–3 years, 3– 8 years, 8 –16 years, and >16 years) and in two groups for 24-h urine collections (8 –16 years and >16 years). Results: Over a 1-year period, CVs for retention times were 16 years
8–16 years
>16 years
4–60 (15) 12–44 (23) 6–45 (16) 0–17 (3) 22–177 (63) 28–94 (51) 10–86 (29) 83–254 (145) 33–125 (64) 2–9 (4) 28–268 43–211 (96) 1–17 (4) 10–48 (22) 12–67 (29) 4–48 (13) 0–49 (5) 0–9 (2) 1–19 (3) 3–362 (33) 12–86 (31) 26–111 (54) 1–26 (6) 5–30 (12) 1–16 (4) 1–10 (3) 0–13 (2) 1–17 (4) 1–8 (2) 3–17 (7) 0–15 (2) 2–26 (8) 2–27 (7) 1–5 (2) 1–65 (9) 26 (13/13)
4–29 (10) 9–47 (20) 3–36 (10) 0–10 (1) 8–325 (57) 15–85 (36) 11–56 (25) 37–371 (132) 20–92 (43) 1–11 (3) 13–534 21–164 (59) 1–15 (4) 4–48 (14) 10–57 (23) 4–35 (12) 0–16 (2) 0–5 (2) 0–5 (1) 2–290 (22) 15–52 (28) 11–88 (32) 1–11 (3) 4–21 (9) 2–7 (3) 1–7 (3) 0–4 (2) 0–21 (3) 1–7 (3) 3–10 (5) 0–4 (1) 2–13 (6) 2–12 (5) 1–4 (2) 2–63 (10) 34 (16/18)
8–40 (17) 12–55 (25) 4–45 (13) 0–15 (2) 11–169 (50) 20–88 (42) 7–79 (23) 58–325 (137) 14–196 (51) 1–23 (5) 24–255 48–195 (97) 1–21 (4) 6–70 (20) 11–86 (31) 2–32 (9)e 2–40 (9)e 0–10 (1)d 1–9 (2) 4–304 (34) 15–83 (35) 14–149 (46) 2–15 (5) 3–50 (12) 1–12 (3) 1–9 (2) 0–9 (2) 1–19 (5) 1–9 (3) 2–22 (7) 0–12 (3) 3–22 (9) 2–22 (7) 1–5 (2) 3–44 (11) 25 (19/6)
5–50 (15)c 11–42 (22) 4–32 (11) 0–15 (2) 22–187 (64) 18–89 (40) 10–65 (25) 49–413 (142) 17–146 (50) 2–30 (7)d 13–587 30–186 (75) 1–22 (5) 6–74 (20)e 9–89 (28) 3–50 (12) 0–16 (3) 0–8 (1) 0–9 (2) 5–376 (44) 14–71 (31) 12–72 (29) 1–10 (2) 3–36 (9) 2–12 (4)e 1–5 (2) 0–7 (2) 0–21 (3) 1–9 (2) 2–16 (5) 0–7 (2) 3–13 (7) 3–14 (6) 1–5 (2) 2–53 (11) 33 (22/11)
a
Confidence intervals for these reference limits are included in an electronic data supplement available at http://www.clinchem.org/content/vol47/issue3. Range, as mean ⫾ 1.96 SD (mean), mmol/mol of creatinine. c– e Statistical significance for differences in age-matched groups (random vs 24-h urine samples: c P ⬍0.01; d P ⬍0.001; e P ⬍0.05. f Hyp, hydroxyproline; Pea, phosphoethanolamine; Tau, taurine; Aib, -aminoisobutyric acid; Car, carnosine; 1mh, 1-methylhistidine; 3mh, 3-methylhistidine; Eta, ethanolamine; Abu, aminobutyric acid; Cysta, cystathionine; (Cys)2, cystine; Hly, hydroxylysine. g Observed ranges. h M/F. b
vided by separate groups of subjects. The age ranges were selected to represent physiological periods such as the newborn period, infancy, early and late childhood, puberty, and adulthood. A reference interval for anserine is not included because the peak frequently was undetectable. Positively skewed distributions were found in almost every amino acid age group; therefore, log-transformations were performed on every group of original data. As a result, log-distributions gave rise to asymmetric intervals around the mean. Taurine showed extremely
skewed distributions with numerous outlying values; therefore, corresponding reference intervals are presented as the observed ranges. In general, amino acid excretion decreases with age. Some exceptions include phosphoethanolamine and 3-methylhistidine, which showed a relatively constant excretion throughout childhood. 1-Methylhistidine excretion increases during the first year of life with subsequent fluctuations at higher concentrations. Taurine excretion decreases during the first year of life and afterward
579
Clinical Chemistry 47, No. 3, 2001
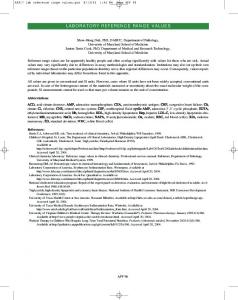
Fig. 1. PITC HPLC profile of urine from a healthy 2-year-old child with a creatinine concentration of 6.0 mmol/L. Pea, phosphoethanolamine; Tau, taurine; Aib, -aminoisobutyric acid; IS, internal standard; 1mh, 1-methylhistidine; Eta, ethanolamine; Abu, aminobutyric acid; Reag, reagent.
remains constant, with a new increase in adulthood. Statistical comparisons of age-matched intervals probed the differences between random and 24-h urine samples in unrelated amino acids (-aminoisobutyric acid, carnosine, and arginine for the 8 –16 years group; and aspartic acid, -alanine, threonine, carnosine, valine, and hydroxylysine for the adult group). Likewise, only isolated statistical sex differences in unrelated amino acids could be observed within groups of subjects older than 8 years (data not shown). Chromatograms for nonpathological and pathological urine samples are shown in Figs. 1 and 2. Table 2 shows the urinary excretion of representative amino acids in random and 24-h samples from patients with cystinosis, Lowe syndrome, and phenylalanine-restricted or -unrestricted phenylketonuria as well as from a random urine sample of a diet-restricted patient with leucinosis. Table 2 also displays the cystine and dibasic amino acid excretion
from phenotypically homozygous and heterozygous cystinuric patients. The lowest and highest concentrations are shown as well as ranges of the multiples of corresponding upper reference limits.
Discussion In spite of more than 10 years of routine use of PITC RP-HPLC in clinical amino acid analysis, validation data for its urine application are scant (3, 9 ). A linear response up to 2 mmol/L has been demonstrated as well as a 10-fold increase in sensitivity compared with ninhydrin methods (11 ), with even greater sensitivity and higher linear responses for non-␣-amino acids such as imino acids and -amino acids. Likewise, ⬎100 compounds and pharmacological metabolites have been comprehensively studied as potential interferents (11, 12 ). We have provided recovery and precision data obtained over the last year of our study as representative of
Fig. 2. PITC HPLC profile of urine from a 44-year-old woman with cystinuria. The creatinine concentration was 4.8 mmol/L. Pea, phosphoethanolamine; Tau, taurine; IS, internal standard; 1mh, 1-methylhistidine; Eta, ethanolamine; Abu, aminobutyric acid; Reag, reagent.
580
Venta: Validation and Reference Values for Urinary Amino Acids
Table 2. Urinary amino acid excretion in untimed and 24-h samples of aminoaciduria patients.
Age range No. patients No. samples Amino acid Ser Asn Gly Gln His Thr Ala Arg Pro Tyr Val Met (Cys)2c Ile Leu Phe Trp Orn Lys a b c
Cystinosis
Lowe syndrome
Leucinosis
Phenylketonuria
Cystinuria (heterozygous)
Cystinuria (homozygous)
17 months–3 years 1 4
3 m–17 m 2 3
13 years 1 1
9–34 years 2 4
2–31 years 13 23
2–65 years 11 28
582–1530a (4.6–8.1)b 541–1022 (5.2–13.5) 1320–2303 (2.6–7.9) 1572–4092 (9.2–19.6) 455–1126 (1.8–2.9) 473–1355 (7.1–12.1) 735–2000 (6.4–18.5) 66–177 (3.8–18.5) 565–1375 (15.2–81.9) 214–431 (6.8–12.6) 284–896 (21.1–57.2) 25.9–66.4 (3.3–6.7) 41–267 (2.0–11.7) 74–220 (6.4–31.4) 153–403 (5.0–18.7) 103–337 (4.2–12.1) 74–135 (2.8–4.0) 90–270 (11.7–24.9) 457–1154 (8.9–15.1)
281–755 (1.6–2.3) 198–474 (2.4–2.5) 990–3273 (1.7–3.7) 474–765 (1.7–2.3) 364–762 (1.0–1.9) 158–683 (2.1–4.7) 297–542 (1.1–1.7) 14–59 (1.1–1.7) 71–555 (3.3–6.1) 37–263 (0.8–4.1) 15–63 (0.7–1.5) 7–44 (0.4–2.5) 21–119 (0.8–2.8) 8–28 (0.4–1.4) 22–63 (0.3–0.9) 23–62 (0.6–1.5) 21–36 (0.7–1.0) 17–106 (1.1–5.7) 180–810 (2.3–10.1)
4–321 (0.8–69.8)
7–527 (0.8–114.5)
16–113 (0.9–5.4)
114–324 (5.4–15.3)
6–189 (0.7–47.2) 109–858 (1.7–13.7)
22–284 (3.1–71.1) 344–1130 (5.3–18.0)
4–6 (0.1–0.3) 12 (0.8)
9 (1.1) 59 (3.6) 55–337 (2.1–12.7)
Observed ranges, mmol/mol of creatinine. Range of multiples of the upper reference limit. Cystine.
the long-term performance of the method, but equivalent results for recovery and precision were obtained during the rest of the study. Over this 1-year period using three different columns, the peak positions for 37 amino acids were reproducible enough to ensure correct peak identifications in patients’ samples. Co-elution of ␥-aminobutyric acid and citrulline has previously been documented (12 ), but it does not represent a serious problem because of the low concentrations of ␥-aminobutyric acid ex-
pected. The precision of retention times was similar to that seen in short-term studies in plasma with PITC HPLC methods (12 ), and in plasma and urine with ninhydrin automated ion-exchange chromatography methods (5 ). In concentrated urine samples, based on a high creatinine concentration, peaks eluting from the column in the first 12–16 min showed poorer recoveries. These poorer recoveries may have resulted from insufficient clean-up of the sample with the solid-phase extraction procedure,
Clinical Chemistry 47, No. 3, 2001
which is intended mainly to clear the first part of the chromatogram. Insufficient clean-up leads to more complex chromatograms and poorer integration results. As a routine practice, dilution of urine samples with creatinine concentrations ⬎10.0 mmol/L has been performed. The recoveries in the dilute pool were comparable to those for urine samples of the phenylhydantoin HPLC method (65–100%) (25 ), the 9-fluorenylmethyl chloroformateOPA HPLC method (83–105%) (26 ), and the ninhydrin automated ion-exchange chromatography method (94 – 115% to 75–140%, depending on the de-ammoniation procedure) (6 ). Likewise, recoveries were equivalent to those obtained for plasma samples using the PITC HPLC method (89 –117%) (11 ) and the OPA HPLC method (79 –121%) (9 ). The results of our within- and between-run precision studies over 1 year seem better than those described by Feste (12 ) (5.7–129% for the same method in a short-term scheme). Both studies confirm the poorer reproducibility for concentrations ⬍15–30 mol/L occasionally found for some amino acids (such as arginine, proline, methionine, or isoleucine) with more efficient reabsorption mechanisms (14 ). These long-term CVs are poorer than those found with the 9-fluorenylmethyl chloroformate-OPA HPLC method (26 ) both within (2–24%) and between runs (4 –27%) as well as with the most recently developed methods using ninhydrin automated ion-exchange chromatography [within-run CV ⬍4 –19.8% and between-run CV ⬍10 –23.1% (5 )]. Although both studies report shortterm CVs, the better precision could be explained by the automation of their procedures as opposed to the manual sample procedure used in the PITC HPLC method. The generalized high imprecision of the amino acid urine analyses highlights the importance of using an appropriate urine control with physiological concentrations rather than calibration mixtures or plasma controls in method validation and quality assurance. The reference values obtained in random urine samples confirm previous findings of an age-related decrease in the excretion of amino acids adjusted for creatinine concentration (15, 16 ) attributable to the phenomenon of renal adaptation during childhood (1, 14 ). The validity of random urine samples for the diagnosis of aminoaciduria has already been established using ion-exchange chromatography methods, although it is commonly accepted that there is a higher variation of amino acid concentrations in untimed samplings (15 ) and in 12-h urine collections (17 ) compared with 24-h collections. Nevertheless, no important differences in mean amino acid concentrations of untimed, 12-h, and 24-h paired urine samples have been reported in adults (15, 17 ). Comparisons of the current means of intervals corresponding to unpaired samplings confirm these findings, demonstrating only a few significant differences between random and 24-h urine samples in age-matched groups. Moreover, higher limits for 24-h intervals have been observed in several amino acids. The differences observed between specimens could be
581
explained in several ways: (a) as an energy source, amino acids are consumed in bacterial contamination (27 ), which could be more prominent in the 24-h urine specimens; (b) a diurnal variation has been observed in amino acid excretion (15, 17 ), with the lowest values in early morning and the highest in late evening; and (c) random urine samples could be more affected by food intake than 24-h urine collections, with early morning, pre-breakfast specimens being the least affected (28 ). In our study, gross bacterial contamination was visually excluded for each sample at reception. We had little control over the time of sampling in random specimens, but based on the times of their reception in the laboratory, most of them were collected before 1200. Some amino acids, such as phosphoethanolamine, methylhistidines, and taurine, show clearly different agedependent patterns of excretion. Constant or increased excretion of these amino acids during childhood probably is related to food intake; for example, methylhistidine excretion can be increased by a diet rich in poultry, rabbit, or pork (1, 27 ). 3-Methylhistidine excretion is related to muscle protein breakdown (29 ), and creatinine is related to muscle mass, supporting the age-constant pattern of the ratio. The decreases in taurine excretion during the first year of life could be related to the progressive substitution of taurine-rich maternal milk for other foods (1, 30 ), whereas increased ingestion of meat and shellfish in adulthood could increase taurine concentrations (27 ). These distinct excretion patterns have been described previously by Parvy et al. (16 ), using a ion-exchange chromatography method. -Aminoisobutyric acid excretion showed an extremely skewed distribution, especially in children younger than 8 years. The use of cutoff values to identify high excretors (1, 16 ) in ion-exchange chromatography methods has been common. In our study, no clear cutoff values were found, but we tentatively used 113 and 57 mmol/mol of creatinine for children younger and older than 8 years, respectively (i.e., 1000 and 500 mol/g of creatinine), according to the highest excretions observed. These values would provide a frequency of high excretors in children of 8%. Similar frequencies between 4% and 10% have been reported for Western countries (1 ). Because of differences in age categories, direct comparison with other studies is not possible. Nevertheless, a general overview of our reference values suggests intervals similar to those reported by Tsai et al. (15 ) in untimed samples, particularly in children and adults. For glycine, we found lower excretion in infants and children younger than 8 years. With regard to the intervals reported by Parvy et al. (16 ) in pre-breakfast samples, we found higher reference intervals for almost every amino acid, particularly in newborns and infants. However, the means of the intervals for some of the most prominent amino acids, e.g., threonine, serine, glutamine, glycine, alanine, tyrosine, and phenylalanine, were similar. For 24-h urine collections in adults, the reference intervals for
582
Venta: Validation and Reference Values for Urinary Amino Acids
our HPLC method were also greater than intervals reported previously (31 ). All of these cited studies were performed with the ninhydrin ion-exchange chromatography method. The observed differences in method-related reference intervals could be explained in several ways: (a) the increased sensitivity and better resolution of RP-HPLC columns (3, 9 ) as well as the differences in the sampling period; (b) the commercial origins of the calibration solutions, which have been considered responsible for dispersion of results in quality-control schemes (4 ) and therefore could partially explain the differences in reference intervals; and (c) the skewed distributions of amino acids in both plasma (32 ) and urine (1 ), which have long been known; therefore, the use of recommended statistical treatments of the data could yield reference limits different from the ranges reported in other studies. Some examples of representative amino acid excretion in patients with aminoaciduria support the reliability of the reference intervals obtained. A partial overlapping with the corresponding reference intervals was found for the first sample of a 3-month-old patient with Lowe syndrome, but a subsequent sample at 17 months of age showed a characteristic generalized hyperaminoaciduria. This pattern has been described elsewhere (33 ). According to the recent studies of Guille´n et al. (34 ), using the Waters Pico-Tag method, cystinuric patients can be classified as phenotypic homozygotes and heterozygotes by the use of a cutoff of 113 mmol/mol of creatinine for cystine excretion. From our 26 diagnosed cystinuric subjects, 24 patients could be correctly classified by cystine excretion. Our results confirm the conclusion of Guille´n et al. regarding lysine as the better discriminator between non-type I heterozygotes and the general population, because it always shows values above the upper reference limit. In conclusion, the advantages of the PITC HPLC method, such as high resolution, speed, and sensitivity for quantifying of imino acids, sulfur, and -amino acids, make it suitable for urine amino acid analysis, and its reliability and feasibility for clinical use has been demonstrated. However, its performance in terms of precision should be improved to achieve the precision of the reference method, automated ion-exchange chromatography using ninhydrin. The prospective selection of the reference patients in this study probably yielded wider and more practical reference intervals than those obtained using more stringent conditions. On the other hand, small deviations from reference intervals can be common and generally have no clinical significance (3 ). Although RPHPLC methods to analyze plasma amino acids are currently in use in some clinical laboratories, the measurement of urinary amino acids is most often performed by ion-exchange chromatography. Hopefully, these reference intervals will serve as a guide for laboratories moving to this newer technology.
We thank Juan Mun˜´ız for valuable technical assistance.
References 1. Bremer HJ, Duran M, Kamerling JP, Przyrembel H, Wadman SK, eds. Normal values. Urine. In: Disturbances of amino acids metabolism: clinical chemistry and diagnosis. Baltimore: Urban and Schwarzemberg, 1981:185–7. 2. Parvy P, Bardet J, Rabier D, Kamoun P. A scheme for interpretation of primary a secondary disturbances of plasma and urinary amino acid profiles. A possible way to an expert system. Clin Chim Acta 1995;235:1–10. 3. Walker V, Mills GA. Quantitative methods for amino acid analysis in biological fluids [Review]. Ann Clin Biochem 1995;32:28 –57. 4. Parvy P, Bardet J, Rabier D, Gasquet M, Kamoun P. Intra- and interlaboratory quality control for assay of amino acids in biological fluids: 14 years of the French experience. Clin Chem 1993; 39:1831– 6. 5. Le Boucher J, Charret C, Coudray-Lucas C, Giboudeau J, Cynober L. Amino acid determination in biological fluids by automated ion-exchange chromatography: performance of Hitachi L-8500A. Clin Chem 1997;43:1421– 8. 6. Hara K, Hijikata Y, Hiraoka E, Owaga N, Takahashi H. Measurement of urinary amino acids using high-performance liquid chromatography equipped with a strong cation exchange resin precolumn. Ann Clin Biochem 1999;36:202– 6. 7. Turnel DC, Cooper DH. Rapid assay for amino acids in serum or urine by pre-column derivatization and reversed-phase liquid chromatography. Clin Chem 1982;28:527–31. 8. Cohen SA, Strydom DJ. Amino acid analysis utilizing phenylisothiocyanate derivatives. Anal Biochem 1988;174:1–16. 9. Fekkes D. State-of-the-art of high-performance liquid chromatographic analysis of amino acids in physiological samples [Review]. J Chromatogr 1996;682:3–22. 10. Sherwood RA, Titheradge AC, Richards DA. Measurement of plasma and urine amino acids by high-performance liquid chromatography with electrochemical detection using phenylisothiocyanate derivatization. J Chromatogr 1990;528:293–303. 11. Davey JF, Ersser RS. Amino acid analysis of physiological fluids by high-performance liquid chromatography with phenylisothiocyanate derivatization and comparison with ion-exchange chromatography. J Chromatogr 1990;528:9 –23. 12. Feste AS. Reversed-phase chromatography of phenylthiocarbamyl amino acid derivatives of physiological amino acids: an evaluation and a comparison with analysis by ion-exchange chromatography. J Chromatogr 1992;574:23–34. 13. Teerlink T, Van Leeuwen PAM, Houdijk A. Plasma amino acids determined by liquid chromatography within 17 min. Clin Chem 1994;40:245–9. 14. Rossi R, Danzebrink S, Linnenbu¨rger K, Hillebrand D, Gru¨neberg M, Sablitzky V, et al. Assessment of tubular reabsorption of sodium, glucose, phosphate and amino acids based on spot urine samples. Acta Paediatr 1994;83:1282– 6. 15. Tsai MY, Marshall JG, Josephson MW. Free amino acid analysis of untimed and 24-h urine samples compared. Clin Chem 1980;26: 1804 – 8. 16. Parvy PR, Bardet JI, Rabier DM, Kamoun PP. Age-related reference values for free amino acids in first morning urine specimens. Clin Chem 1988;34:2092–5. 17. Khalaf AN, Bo¨cker J, Kerp L, Petersen KG. Urine screening in outdoor volunteers: day versus night versus 24 h collection. Eur J Clin Chem Clin Biochem 1991;29:185– 8. 18. Bingham SA, Williams R, Cole TJ, Price CP, Cummings JH. Reference values for analytes on 24-h collections known to be complete. Ann Clin Biochem 1988;25:610 –9. 19. Solberg HE. Establishment and use of reference values. In: Burtis
Clinical Chemistry 47, No. 3, 2001
20.
21.
22.
23.
24. 25.
26.
CA, Ashwood ER, eds. Tietz textbook of clinical chemistry, 2nd ed. Philadelphia, PA: WB Saunders, 1994:454 – 84. Cohen SA, Meys M, Tarwin TL, eds. The Pico Tag method–a manual of advanced techniques for amino acid analysis, Rev. 1. Bedford, MA: Millipore, 1989:123pp. Koch DD, Peters T. Selection and evaluation of methods with an introduction to statistical techniques. In: Burtis CA, Ashwood ER, eds. Tietz textbook of clinical chemistry, 4th ed. Philadelphia, PA: WB Saunders, 1996:170 – 81. International Federation for Clinical Chemistry, Expert Panel of Theory of Reference Values. Part 5. Statistical treatment of collected reference values. Determination of limits. J Clin Chem Clin Biochem 1983;21:749 – 60. Solberg HE. Statistical treatment of reference values in laboratory medicine: testing the goodness-of-fit of an observed distribution to the gaussian distribution. Scan J Clin Lab Invest 1983; 46(Suppl 184):125–32. Dixon DJ. Processing data for outliers. Biometrics 1953;9:74 – 89. Biggs HG, Gentilcore LJ. Liquid-chromatographic measurement of amino acids in biological samples after formation of phenylthiohydantoin derivatives. Clin Chem 1984;30:851–5. Carducci C, Birarelli M, Leuzzi V, Santagata G, Serafini P, Antonozzi I. Automated method for the measurement of amino acids in urine by high-performance liquid chromatography. J Chromatogr 1996;729:173– 80.
583
27. Edwards MA, Grant S, Green A. A practical approach to the investigation of amino acid disorders [Review]. Ann Clin Biochem 1988;25:129 – 41. 28. Kamoun PP, Parvy PR. Analysis for free amino acids in prebreakfast urine samples [Letter]. Clin Chem 1981;27:783. 29. Ballard FJ, Tomas FM. 3-Methylhistidine as a measure of skeletal muscle protein breakdown in human subjects: the case for its continued use. Clin Sci 1983:65:209 –15. 30. Scott PH, Sandham S, Balmer SE, Wharton BA. Diet-related reference values for plasma amino acids in newborns measured by reversed-phase HPLC. Clin Chem 1990;36:1922–7. 31. Peters JH, Lin SC, Berridge BJ, Cummings JG, Chao WR. Amino acids, including asparagine and glutamine, in plasma and urine of normal human subjects. Proc Soc Exp Biol Med 1969;131: 281– 8. 32. Briddon A, Oberholzer VG. An alternative way of presenting quantitative amino acid results. Clin Chim Acta 1987;164:209 – 13. 33. Bremer HJ, Duran M, Kamerling JP, Przyrembel H, Wadman SK, eds. Lowe syndrome. In: Disturbances of amino acids metabolism: clinical chemistry and diagnosis. Baltimore: Urban and Schwarzemberg, 1981:355– 6. 34. Guille´n M, Corella D, Cabello ML, Garcı´a AM, Herna´ndez-Yago J. Reference values of urinary excretion of cystine and dibasic amino acids: classification of patients with cystinuria in the Valencian community, Spain. Clin Biochem 1999;32:25–30.