Yield and kinetic parameters estimation and model reduction in a recombinant E. coli fermentation I. Rocha and E. C. Ferreira* Centro de Engenharia Biológica Universidade do Minho, 4710-057 Braga PORTUGAL
Abstract A genetic algorithm was used to estimate both yield and kinetic coefficients of an unstructured model representing a high-cell density fermentation of E. coli. The model is composed of mass balance equations with 3 states: Biomass, Glucose, and Acetate. Kinetic equations are based on the 3 main metabolic pathways of the microorganism: glucose oxidation, fermentation of glucose and acetate oxidation. Genetic Algorithms were used to minimize the normalized quadratic differences between simulated and real values of the state variables, by manipulating both yield and kinetic coefficients. Data from real fed-batch fermentation runs were analyzed with this optimization routine, the new parameter set obtained allowing a much better description of the process behaviour when compared to simulations conducted with non-optimized parameters obtained from literature. After parameter estimation, a sensitivity function analysis was applied to evaluate the influence of the various parameters on the state variables biomass, acetate, and glucose. Thus, essential parameters were selected and the model was re-written in a more simplified form that could also describe accurately experimental data. Keywords: Genetic Algorithms, E. coli; fed-batch fermentation; sensitivity function; model reduction.
1. Introduction Bioprocess modelling has been considered as a useful and even essential technique for optimization and control of bioprocesses. However, every model contains several kinetic and yield parameters that are characteristic of the particular process. In order to use the model for the prediction of system behaviour, those parameter values have either to be known or estimated. For fed-batch fermentations, the most common approaches for the estimation of parameters are based on chemostat or batch data, while others are obtained from stoichiometric relations or from the literature. However, as both yield and kinetic coefficients are extremely dependent on the particular strain under study, and also on the cultivation medium and mode of operation, those approaches are not likely to generate a good approximation between simulated and real values of the state variables. Thus, a more systematic approach to parameter estimation is needed if a proper *
Author to whom correspondence should be adressed :
[email protected]
simulation is to be conducted. One of these approaches consists in formulating the parameter estimation problem as an optimization problem. The general goal of parameter estimation can thus be achieved by comparing measurement data with simulation results according to a given performance criterion, usually the sum of squared errors between measured and simulated data, given the same model input (the feeding profile). However, when trying to estimate both yield and kinetic coefficients simultaneously, deterministic optimization methods have limited applications, due to the non-linearities found in the dynamical model and to the need of good initial estimates in order to avoid the convergence to local optima. Therefore, other optimization methods have to be employed. New optimization methods based on the principles of biological evolution represent a promising approach for bioprocesses applications. For example, Genetic Algorithms (GAs) are stochastic direct (i.e. derivative free) optimization techniques that apply basic elements of biological evolution to optimize technical systems. There can be found several applications of GAs to bioprocesses in the literature, in the derivation of the optimal feeding (Roubos et al., 1999; Nguang et al., 2001) or temperature profiles (Moriyama and Shimizu, 1996) in fed-batch fermentations. When parameter estimation is conducted, the sensitivity of the simulation results to model parameters has to be investigated, in order to check for the influence of those parameters’ accuracy on the process prediction. Sensitivity functions give a time profile of the model sensitivity and can be defined as the model output sensitivities with respect to parameter variations, evaluated along the nominal output trajectories (Munack, 1991). These functions generate valuable information not only concerning which parameters and manipulated variables are most important, but also the time periods over which they matter most. Calculation of the sensitivity functions can be found in Pertev et al. (1997) and Smets et al. (2002) applied to the different microorganisms. In both cases, after sensitivity analysis, a model reduction was conducted by eliminating from the model the least significant parameters or by setting their values to literature data. However, it was not found in the literature an example of an application of this approach to fed-batch fermentation of E. coli. The aim of this paper is to use the Genetic Algorithm optimization tool for estimating both yield and kinetic coefficients of an unstructured model representing a high-cell density fermentation of E. coli. Sensitivity functions are then used to evaluate the influence of the various parameters on the model output in order to re-write the model in a more simplified form.
2. Mathematical Model The developed mathematical model for describing the fed-batch fermentation of recombinant Escherichia coli, was based on the General Dynamical Model of Bioreactors framework described by Bastin and Dochain (1990). During the aerobic growth of E. coli with glucose as the only added substrate, the microorganism can follow three different metabolic pathways: oxidative growth on glucose, fermentative growth on glucose, and oxidative growth on acetate.
The associated dynamical model excluding oxygen and carbon dioxide dynamics can be described by the following equations:
X 1 d S = − k1 dt A 0
1 − k2 k3
1 µ1 X F 0 µ2 X − D S + in,S W A − k4 µ3
0 S in 0
(1)
where S, X, and A represent glucose, biomass, and acetate concentrations, respectively;
µ1, µ2, and µ3, are the specific growth rates; ki are the yield (stoichiometric) coefficients.
Fin,S is the flow rate associated with glucose feeding, and Sin is the influent glucose concentration. The variable dilution rate D can be defined as the quotient between the total mass flow feed rate (Fin,tot) and the weight (W) of liquid inside the reactor. An additional equation that accounts for volume variations was added to the model in order to account for weight variations. In small-scale and high-cell density reactors, the amount of culture removed or added during sampling, base and acid additions, evaporation and mass taken from the reactor due to gas exchanges can not be considered negligible (Galvanauskas et al., 1998). Thus, the more complete equation for calculating weight variations was formulated:
dW = Fin,tot = Fin,S + Fb + Fa − Fevp − Fgas − Fsmp dt
(2)
where Fb and Fa are the liquid mass flow of base and acid solution added to the bioreactor, and Fevp, Fgas, and Fsmp are liquid mass flows evaporated from the bioreactor, and taken due to gas exchanges and to sampling, respectively. For the kinetic model, the specific uptake rate of glucose (qS) was found to be described by a Mond-type equation with non-competitive inhibition by acetate:
qS = qS,max
K i,S S S + KS K i,S + A
(3)
where qS,max is the maximum specific uptake rate, KS is the Monod constant and Ki,S represents the inhibition constant for acetate on glucose uptake. The oxidative bottleneck exhibited by this microorganisms is accounted by calculating an oxygen uptake rate, qOS=qS×kOS, where kOS is the oxygen yield on glucose. The oxidative pathway for glucose is then the sole metabolic pathway while:
qOS ≤ qO,max
K i,O A + K i,O
(4)
where qO,max is the maximum oxygen uptake rate, and Ki,O represents the inhibition constant for acetate on oxygen uptake.
After that threshold is reached, the microorganism also follows the fermentative pathway. However, when the oxidative bottleneck is not fulfilled, and if acetate is present in the medium, it can be consumed, and the specific uptake rate of acetate (qAC) under those circumstances can be described in a similar way as glucose uptake. A full description of the mathematical model used for the fed-batch growth of E. coli can be found in Rocha (2003).
3. Materials and Methods Fed-batch fermentations were conducted according to Rocha and Ferreira (2002). For parameters estimation, a MATLAB routine was developed that integrates process simulation with real data analysis. In a first stage, this program loads the fermentation data file and identifies the feeding profile as an input for both real and simulated data. Afterwards, the initial values of the variables for the simulation are taken from real data at t=0. Then, simulation begins by integrating the differential equations using a 4th order Runge-Kutta integration method and by calling a kinetics function that calculates the specific growth rates as a function of the state variables. Afterwards, a normalized difference between the real and the simulated data is calculated in order to check for the simulation accuracy. That difference takes the following generic formula:
ξ sim,ij − ξexp,ij ∑ n' ξexp,ij j =1 dif = ∑ RSDξ i i =1 p
2
(5)
This equation calculates the sum of the quadratic differences between real or experimental – ξexp,ij – and simulated – ξsim,ij data for every point (p) of a given state variable within the simulation. For each point, the difference is normalized by dividing it by an average value ( ξexp,ij ) of that state variable, in order to attribute the same importance to all state variable, regardless their magnitude. The global difference obtained for each state variable is then divided by the corresponding relative standard deviation (RSDξi) in order to confer more significance to the variables that have less errors associated. Finally, the individual global differences obtained for each variable are added, being n’ the number of state variables included in the optimization goal. This difference was subjected to a minimization using the Genetic Algorithms (GAs) toolbox for Matlab version 1.7 developed by H. Pohlheim at the University of Sheffield.
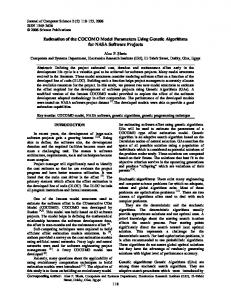
4. Results 4.1. Model Identification Parameter estimation was conducted in several steps to different fermentation runs (Rocha, 2003). The approximation of simulated data to real data obtained with literature parameter values (Galvanauskas et al., 1998 and Xu et al., 1999) and after parameter estimation is shown in Figure 1 for a given fermentation run. It is clear that, before the optimization procedure, the simulated results could not describe the experimental data.
A much better approximation was obtained with the identified parameters (shown in table 1).
2
20
] g k g/[ s s a m oi B
1.5
15
] g k/ g[ e s o c ul G
10
5
0
0
5
10 Time [h]
15
0
0
5
10 Time [h]
15
20
0
5
10 Time [h]
15
20
0.15 ] h/ g k[ g ni d e e F e s o c ul G
20 15 10 5 0
0.5
20
25
] g k g/[ et at e c A
1
0
5
10 Time [h]
15
0.1
0.05
20
0
Figure 1. Approximation between real and simulated results before (dotted lines) and after (full lines) parameter estimation. Table 1. Initial (literature) values and identified values for model parameters Parameter k1 k2 k3 k4 qS,max KS Ki,S kOS qO,max Ki,O qac,max KA kOA Ki,a
Initial value 2.00 20.0 14.00 4.00 1.70 0.100 4.31 1.00 0.500 4.00 0.0500 1.00 1.00 4.00
Identified value 3.164 25.22 10.90 6.382 1.832 0.1428 8.001 2.020 0.7218 6.952 0.09670 0.5236 1.996 5.850
4. 2 Sensitivity Analysis Sensitivity functions were computed, for the present case, as the sensitivity of the state variables ξi to small variations in the model parameters, expressed generically as pj given the feeding profile input:
d ∂ξ i dt ∂p j
∂ dξ i = ∂p j dt
(6)
where dξi /dt are the differential equations given in equation 1. The analysis of the time profile of the sensitivity functions revealed that the more relevant parameters are the yield coefficients k1, k2 and k3, and the maximum specific uptake rates for glucose and acetate. The least significant parameters are k4 and the inhibition constants of acetate on glucose and acetate uptakes, and the Monod constant for acetate. Thus, the specific uptake rates of glucose and acetate were re-written in a more simplified form, by eliminating the inhibition terms in both cases and the saturation term in the case of acetate consumption rate, and similar approximation of simulated to experimental data were obtained with this simplified kinetic model (results not shown). Also, the value of the yield coefficient k4 does not need to be determined accurately, and a literature value for this parameter is expected to give the same results for simulation purposes.
5. Conclusions Using the proposed parameter estimation methodology, it is possible to estimate with great accuracy several model parameters, without needing extensive mathematical manipulations of the model. Also, with model reduction based on sensitivity function evaluation, it is possible to re-write the model structure in a simpler way, decreasing simulation time and facilitating model manipulations.
References Bastin, G. and Dochain, D., 1990, On-line estimation and adaptive control of bioreactors. Elsevier, Amsterdam. Galvanauskas, V., Simutis, R., Volk, N., and Lübert, A., 1998, Bioproc. Eng. 18, 227. Moriyama, H. and Shimizu, K., 1996, J. Chem. Tech. Biotech. 66, 217. Munack, A., 1991, Optimization and Sampling. Measurements in Bioreactor Systems. Rehm, H. J., Reed, G., Pühler, A., and Stadler, P. (eds.) VCH, Weinheim. 252. Nguang, S. K., Chen, L., and Chen, X. D., 2001. ISA Trans. 40, 381. Pertev, C., Türker, M., and Berber, R., 1997, Comp. Chem. Eng. 21, 739. Rocha, I. 2003, Model-based strategies for computer-aided operation of recombinant E. coli fermentation. Universidade do Minho. PhD thesis. Rocha, I. and Ferreira, E. C.,2002 Anal. Chim. Acta. 462, 293. Roubos, J. A., Van Straten, G., and Van Boxtel, A. J. B., 1999, J. Biotech. 67, 173. Smets, I., Bernaerts, K., Sun, J., Marchal, K., Vanderleyden, J., and Van Impe, J.F., 2002, Biotech. Bioeng. 80, 195. Xu, B., Jahic, M., and Enfors, S.O., 1999, Biotech. Progress. 15, 81.