0013-7227/02/$15.00/0 Printed in U.S.A.
The Journal of Clinical Endocrinology & Metabolism 87(10):4431– 4437 Copyright © 2002 by The Endocrine Society doi: 10.1210/jc.2002-020275
Yield of Laboratory Testing to Identify Secondary Contributors to Osteoporosis in Otherwise Healthy Women CARA TANNENBAUM, JULIE CLARK, KEVIN SCHWARTZMAN, SYLVAN WALLENSTEIN, ROBERT LAPINSKI, DIANE MEIER, AND MARJORIE LUCKEY Department of Medicine (C.T., K.S.), McGill University Health Centre, and the Respiratory Epidemiology Unit (K.S.), McGill University, Montre´al, Que´bec H3G 1A4; Departments of Biomathematical Sciences (S.W.), Community and Preventative Medicine (R.L.), Obstetrics and Gynecology (J.C., M.L.), and Geriatrics (D.M.), Mount Sinai School of Medicine, New York, New York 10029-6574; and Saint Barnabas Osteoporosis and Metabolic Bone Disease Center (M.L.), Livingston, New Jersey 07039 Our purpose in this study was to determine the prevalence of undetected disorders of bone and mineral metabolism in women with osteoporosis and to identify the most useful and cost-efficient screening tests to detect these disorders. A cross-sectional study was conducted among 664 postmenopausal women with osteoporosis at the Osteoporosis and Metabolic Bone Disease Program at the Mount Sinai Hospital in New York between January 1992 and June 1996. Women without a history of diseases or medications known to adversely affect bone who completed extensive laboratory testing including complete blood count, chemistry profile, 24-h urinary calcium, 25(OH)vitamin D, and PTH were included. Among 173 women who met the inclusion criteria for the study, pre-
M
ORE THAN 23 MILLION women in the United States today have low bone density (1), and this number is expected to rise dramatically as the postmenopausal population swells by 40 –50% over the next 20 yr (2). Osteoporosis most often results from inadequate peak bone mass, postmenopausal estrogen deficiency-related bone loss, agerelated changes in bone and mineral metabolism, and other diseases and medications known to contribute to low bone mass. However, a long list of asymptomatic mineral and metabolic disorders can also manifest as osteoporosis. If these conditions are not identified, treatment may be suboptimal or ineffective. Some of these disease processes may be identified by medical history and/or physical examination; however, others remain hidden unless additional diagnostic testing is performed. The prevalence of undiagnosed contributors to osteoporosis in women with low bone mass or fractures is not known, and there are currently no evidence-based guidelines for the laboratory evaluation of women with osteoporosis. Once the diagnostic yield of laboratory testing is determined, appropriate, cost-effective guidelines can be formulated for the evaluation of postmenopausal women with low bone density. We sought to determine the prevalence of previously undetected disorders affecting bone and mineral metabolism identified by laboratory testing in otherwise healthy women Abbreviation: 25OHD, 25-Hydroxy vitamin D.
viously undiagnosed disorders of bone and mineral metabolism were identified in 55 women (32%). Disorders of calcium metabolism and hyperparathyroidism were the most frequent diagnoses. A testing strategy involving measurement of 24-h urine calcium, serum calcium, and serum PTH for all women and serum TSH among women on thyroid replacement therapy would have been sufficient to diagnose 47 of these 55 women (85%) at an estimated cost of $75 per patient screened. Previously undiagnosed disorders affecting the skeleton are common in otherwise healthy women with low bone density. A simple testing strategy is likely to identify most such disorders. (J Clin Endocrinol Metab 87: 4431– 4437, 2002)
with osteoporosis. Secondary objectives were to identify potential approaches to diagnostic testing and possible demographic and clinical predictors of these disorders. Subjects and Methods Study design and population A cross-sectional chart review study was conducted among women newly diagnosed with osteoporosis. Subjects were all new consecutive female patients who presented to the ambulatory clinic of the Osteoporosis and Metabolic Bone Disease Program at Mount Sinai Medical Center from January 1992 to June 1996. Women were self-referred or referred by their primary care physician for a variety of reasons including bone density testing, evaluation and treatment of low bone density on bone densitometry, height loss, a history of adult fractures, and/or advice regarding estrogen replacement therapy. The study was approved by the Institutional Review Board of The Mount Sinai Medical Center.
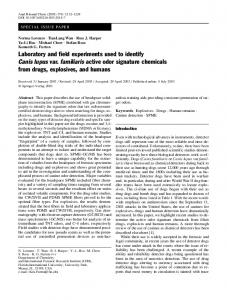
Inclusion/exclusion criteria Postmenopausal women with osteoporosis, aged 45 yr and older who had no history of preexisting conditions or drug treatments known to accelerate bone loss were potential subjects (Fig. 1). Exclusion criteria included a history of gastrectomy, small bowel disease or resection, eating disorders, alcoholism, periods of prolonged immobility (⬎3 months), or malnutrition. Subjects with premature menopause (before age 40), prolonged premenopausal amenorrhea (⬎1 yr), primary hyperparathyroidism, hyperthyroidism, liver disease, rheumatoid arthritis, and renal failure (creatinine ⬎130 mol/liter) were also excluded. Other conditions that warranted exclusion from the study because of their effect on bone and mineral metabolism were Paget’s disease, osteomalacia, childhood rickets, advanced Parkinson’s disease, sarcoid-
4431
4432
J Clin Endocrinol Metab, October 2002, 87(10):4431– 4437
Tannenbaum et al. • Yield of Laboratory Testing for Osteoporosis
FIG. 1. Flowchart of patients included in the study.
TABLE 1. Exclusion criteria categories for 355 women with known medications or diseases affecting bone and mineral metabolism Exclusion criterion
History of oral glucocorticoid use Premature ovarian failure History of unintentional weight loss or malnutrition History of alcoholism History of liver disease History of immobility (⬎3 months) History of systemic chemotherapy
Frequency no. (% of 355)
129 (36.3) 76 (21.4) 37 (10.4) 34 (9.6) 34 (9.6) 33 (9.3) 27 (7.6)
Exclusion criterion
History of hyperthyroidism Current anticonvulsant use History of rheumatoid arthritis or systemic lupus erythematosis History of hyperparathyroidism History of intestinal malabsorption Other known metabolic or bone disorders Use of other medications known to affect bone
Frequency no. (% of 355)
22 (6.2) 19 (5.4) 18 (5.1) 18 (5.1) 14 (3.9) 12 (3.4) 11 (3.1)
Percentages do not add up to 100 because many subjects had two or more exclusion criteria. osis, hematologic malignancy, Gaucher’s disease, and metastatic cancer. Subjects were also excluded if they had a medication history of systemic chemotherapy; prolonged oral or iv glucocorticoid use (⬎1 month); current anticonvulsant use; or a history of heparin, methotrexate, cyclosporin, isoniazid, lithium, or GnRH agonists or antagonists utilization (Table 1). Women with previous breast cancer were excluded from the study only if they had received systemic chemotherapy or had known metastatic disease. Past nephrolithiasis, without a history of hypercalciuria, hypercalcemia, or hyperparathyroidism, was not an exclusion criterion because many causes of urinary calculi (hyperoxaluria, hyperuricosuria, hypocitraturia) are not known to be associated with impaired bone health. Women who had undergone bilateral oophorectomy before age 40 yr were not included in the study. Inclusion in the study also required availability of the results of a complete blood cell count and differential; a blood chemistry profile (including calcium, phosphorus, alkaline phosphatase, serum glutamicoxaloacetic transaminase, serum glutamate pyruvate, total bilirubin, blood urea nitrogen, creatinine, albumin and globulin), serum PTH, 25-hydroxy vitamin D (25OHD) levels, and results from an adequate 24-h urine collection for calcium and creatinine. A 24-h collection was considered adequate if the 24-h urine collection for creatinine was more than 600 mg/24 h, urine volume was 0.8 liters or more, and/or calculated creatinine clearance was 50 ml/min or more. Routine laboratory data available from outside laboratories, performed within 9 months before the baseline visit, were acceptable for inclusion in the study only if no abnormalities had contributed to referral to the center. Patients evaluated for a prior laboratory abnormality other than low bone density were excluded.
Definition of study variables In keeping with the World Health Organization criteria (3), patients were considered to have osteoporosis if their adjusted T scores were less than ⫺2.5 at any measurement site. Women were considered postmenopausal if they reported no menstrual bleeding for 1 yr or more.
Bone densitometry Only the results of bone density measurements available at or during the baseline evaluation were included in the database. Most subjects had their initial bone densitometry study of the forearm, hip, and/or lumbar spine at the Mount Sinai Osteoporosis Center using DPA (Lunar Corp., Madison, WI) or QDR 1000 (Hologic, Inc., Waltham, MA) densitometers, but others had measurements on DXA (Hologic, Inc.) or DPA or DXA (Lunar Corp.) instruments at other centers. To accommodate results from different machines and manufacturers, densitometry results were recorded as T and Z scores (sd from young and age-matched normals) using the manufacturer’s normative reference groups with the exception of the femoral neck values, which were adjusted to the National Health and Nutrition Examination Survey reference data (1). Data from lumbar spine scans were used only if at least three vertebrae were visualized without interfering artifacts.
Abnormal laboratory tests Laboratory results outside the reference range of the testing centers used were considered abnormal except for 25OHD and 24-h urine cal-
Tannenbaum et al. • Yield of Laboratory Testing for Osteoporosis
cium excretion. Conservative cut-off criteria for abnormalities of the latter two measurements were employed to avoid overdiagnosis of secondary contributors to low bone mass. A serum 25OHD level of 30 nmol/liter (12.5 ng/ml) or less was considered low and indicative of vitamin D deficiency (4). Subjects with serum 25OHD levels between 31 and 50 nmol/liter were placed in a separate category labeled vitamin D insufficiency but were not counted as having an abnormal test or a new disorder (5). The cut-off values for abnormal urinary calcium excretion were based on the normative 95% probability range of 24-h urinary calcium excretion in peri- and postmenopausal women under varying conditions of estrogen status and dietary calcium intake (6). For postmenopausal women not on estrogen replacement therapy (in estrogendeprived states), the lower and upper limits of the normal range for urinary calcium excretion for varying levels of calcium intake were considered to be 32–252 mg/d for women with low calcium intakes (⬍500 mg/d), 36 –286 mg/d for women with moderate calcium intakes (500 –1000 mg/d), and 45–357 mg/d for women with high intakes (⬎1000 mg/d) (6). For women on estrogen replacement therapy (in estrogen-replete states), the acceptable lower and upper limits of the normal range for urinary calcium excretion for varying levels of calcium intake were 39 –194 mg/d for women with low calcium intakes (⬍500 mg/d), 54 –269 mg/d for women with moderate calcium intakes (500 –1000 mg/d), and 66 –327 mg/d for women with high intakes (⬎1000 mg/d) (6). Dietary calcium intake was ascertained from a food frequency questionnaire completed by the subjects at one point in time and then reviewed by the physician during the initial office visit. The questionnaire was constructed by compiling a list of foods with the highest calcium content, primarily dairy products and vegetables, and asking the subjects to indicate their daily and weekly consumptions of these food products. Total calcium intake was calculated by adding average daily dietary calcium intake to the dosage and frequency of daily calcium supplements.
Data collection Data were collected by chart review by independent reviewers trained for this study. The following demographic and historical data were extracted for each subject: age, ethnicity, age at menopause, reason for the initial visit, current dietary and supplemental calcium intake, vitamin D supplementation, regular exercise, history of cigarette smoking (ever smoked vs. never smoked) and alcohol intake; medical and pharmacological history including low-trauma fractures, nephrolithiasis, years of estrogen replacement use, and the use of other antiresorptive agents and diuretics; and family history (first- and second-degree relatives) of osteoporosis or fractures, height loss, and nephrolithiasis. Height, weight, body mass index (kilograms per square meter), and height loss (from patient-recalled maximum) were recorded.
Detection of new disorders The identification of previously undiagnosed disorders of bone and mineral metabolism was established by the treating physician after completion of the requisite laboratory investigation, following the initial evaluation. Disorders were confirmed by consensus among members of the research team, based on the criteria listed below. Evaluations often included radiographic, pathological, and/or additional laboratory testing not included in the baseline testing. Renal hypercalciuria was diagnosed in normocalcemic patients if hypercalciuria and secondary hyperparathyroidism were present on a restricted calcium diet (⬍400 mg/d) and both resolved with thiazide diuretic therapy (7). Patients with hypercalciuria and a normal to low PTH on regular and restricted calcium diets were defined as having idiopathic hypercalciuria that did not appear to be due to renal calcium leakage (7). Patients whose testing was insufficient to distinguish between the first two categories were described as having hypercalciuria of undetermined origin. Unexplained hypocalciuria (6) and/or secondary hyperparathyroidism despite normal 25OHD was categorized as “relative calcium malabsorption” if the lab abnormalities normalized with a change in calcium supplement and/or increasing calcium intake to 2 g/d or more. If patients tested positive for antigliadin antibodies and/or had small bowel biopsies consistent with atrophic villi, patients were labeled as
J Clin Endocrinol Metab, October 2002, 87(10):4431– 4437 4433
having evidence of celiac sprue. Urinary calcium excretion was not adjusted for dietary sodium intake, dietary protein, fat or fiber intake, or urinary sodium excretion because these measurements were not available. Exogenous hyperthyroidism was defined by TSH values 0.1 U/ml or less in patients already on thyroid replacement therapy. Cushing’s disease was diagnosed based on elevated 24-h urinary free cortisol levels and subsequent abnormal dexamethasone suppression testing. Paget’s disease was identified in patients who had elevated alkaline phosphatase and characteristic radiographic abnormalities. Multiple laboratory abnormalities associated with a single disorder were included only as one disorder. For example, a patient with secondary hyperparathyroidism because of celiac sprue was not included in the diagnostic category of “secondary hyperparathyroidism.” In the event where a patient with an abnormal laboratory test was lost to follow-up before the identification of the underlying disease process, the disorder appropriate to the extent of the evaluation was used. If a final disorder could not be identified, the etiology of the laboratory abnormality was listed as undefined.
Analysis Statistical analyses were performed using the SAS (version 6.12; SAS Institute, Cary, NC) and STATA for Windows (version 6.0; STATA Corp., College Station, TX) software packages. To assess potential selection bias related to incomplete laboratory testing of all of the otherwise eligible patients attending the Osteoporosis Center, women included in the study with complete lab data were compared with women excluded from the study because of incomplete lab data, using univariate comparisons of means (t tests for continuous independent variables) and of proportions (2 test for categorical independent variables). Subject characteristics were summarized using simple descriptive statistics. Different potential strategies for diagnostic testing were determined by combining the most commonly abnormal tests (or testing combinations because many specific diagnoses required several tests) as well as selecting the most commonly used clinical strategies. Approximate direct costs of blood and urine tests were estimated from the national Medicare allowable charge for 1999 (8) and attributed to each testing strategy based on the number of patients tested (within the group of 173). Costs per patient screened and per diagnosis obtained were then estimated; strategies were ranked by cost per diagnosis obtained. This analysis assumed no other costs related to variations in testing strategy (e.g. no additional physician visits) and was conducted from the perspective of the third-party payer. To identify predictors of underlying disorders, risk factors for identifying women who were ultimately discovered to have underlying disorders were evaluated using stepwise logistic regression. Age, body mass index, body weight, T score, Z score, family history of osteoporosis or fractures, personal history of fracture, personal history of breast cancer, and smoking history were selected as potential predictors because of their prior reported associations with bone density and fracture (8 –12). Additional predictors (personal history of nephrolithiasis and hypertension) were included because of their associations with the detection of an underlying bone or mineral disorder in this cohort. Predictors were first tested individually, using univariate logistic regression on the full sample. Subsequent modeling using backward stepwise analysis (removal criteria P ⬎ 0.1) with all covariates was then used to fit the best model.
Results
One hundred seventy-three women, mean age 65.5 ⫾ 8.5 yr (range 46 – 87), met the inclusion criteria for the study. Characteristics of these subjects and comparison with the group of 136 patients who had no diseases or medications known to contribute to low bone mass but who did not have the requisite laboratory tests for inclusion in the study are summarized in Table 2. The two groups were similar in most respects, although T-score and Z-score values were significantly lower and a personal history of nephrolithiasis was somewhat more frequent in women with complete laboratory data.
4434
J Clin Endocrinol Metab, October 2002, 87(10):4431– 4437
Tannenbaum et al. • Yield of Laboratory Testing for Osteoporosis
New disorders of bone and mineral metabolism
Fifty-six previously undetected disorders with a potential influence on bone or mineral metabolism were identified in 55 (32%) of the 173 patients. One patient had dual, unrelated disorders (exogenous hyperthyroidism and renal hypercalciuria). The frequency of various newly detected disorders is shown in Table 3. None of the women diagnosed with hypocalciuria and/or hyperparathyroidism were taking bisphosphonates at the time of diagnosis, and none of the seven patients with vitamin D deficiency were on supplemental vitamin D. Among patients diagnosed with celiac disease, two were confirmed pathologically on duodenal biopsies. The third patient refused biopsy but had strongly positive antigliadin and antiendomysial antibodies and responded to a gluten-free diet with normalization of calcium excretion and a reduction in antibody titers. Additionally, Paget’s disease and hypervitaminosis D were diagnosed in one patient each, and 28 women had vitamin D insufficiency with 25-hydroxy-vitamin D levels between 31 and 50 nmol/ liter. Only three women with vitamin D insufficiency had elevated PTH levels; these women are classified in Table 3 as secondary hyperparathyroidism caused by inadequate calcium intake (1), unexplained secondary hyperparathyroidism (1), and relative calcium malabsorption (1). Laboratory abnormalities
The frequency of various laboratory abnormalities is shown in Table 4. Eighty-two women (47%) had at least one abnormal test result, but only three quarters of these tests ultimately contributed to the detection of new, previously undiagnosed disorders of bone and mineral metabolism in 55 women. The remaining 25% of abnormal tests either normalized on further testing or could not be attributed to any known disorder affecting bone and mineral metabolism. For example, three of the four patients who were found to have elevated urinary free cortisol
levels had normal repeat measurements or normal dexamethasone suppression tests, and none of the three patients with monoclonal peaks on protein electrophoresis were found to have multiple myeloma on further evaluation. The yield of the various diagnostic tests suggested the potential strategies shown in Table 5. Testing for urine calcium first, and then adding serum calcium and serum PTH only in those patients who had abnormalities as well as serum TSH for all those on thyroid replacement (strategy 1 in Table 5), would have led to 33 diagnoses, at a cost of $116 per woman diagnosed. The combination of urine and serum calcium testing as well as serum PTH for all women, plus serum TSH measurement among all women receiving thyroid replacement (strategy 3), would have detected over 85% of all the underlying disorders, with TABLE 3. Secondary contributors to osteoporosis identified in 173 otherwise healthy women with osteoporosis Prevalence Disorder of bone or mineral metabolism
Hypercalciuria Renal (7) Idiopathic (6) Undefined (4) Malabsorption Relative calcium malabsorption (11) Celiac sprue (3) Hyperparathyroidism (HPT) 10 HPT (1) 20 HPT due to inadequate calcium intake (6) Unexplained 20 HPT (5) Vitamin D deficiency (⬍30 nmol/liter) Exogenous hyperthyroidism Cushing’s disease Hypocalciuric hypercalcemia Total number of new diagnoses Patients with at least one new diagnosis
% of 173 patients
No.
17
9.8
14
8.1
12
6.9
7 4 1 1 56 55
4.1 2.3 0.6 0.6 32.4%
TABLE 2. Characteristics of subjects with a diagnosis of osteoporosis and no known contributors to bone loss according to their eligibility (complete laboratory investigations) or ineligibility (incomplete laboratory investigations) for the study Variables
Age (yr)b Weight (kg)b Body mass indexb T scoreb Z scoreb Caucasian ethnicityc Family history of osteoporosisc Family history of nephrolithiasisc Family history of fracturec Personal history of fracturec Personal history of nephrolithiasisc Personal history of breast cancerc Personal history of hypertensionc Bisphosphonate usec Estrogen usec Thiazide usec Thyroid replacementc Past or current smoker (⬎5 pack-yr)c
Eligible subjects (n ⫽ 173)
65.5 ⫾ 8.5 57.1 ⫾ 10.2 22.8 ⫾ 3.8 ⫺3.7 ⫾ 0.7 ⫺1.9 ⫾ 0.7 94.8 41.0 12.7 23.1 52.0 6.9 11.6 25.4 4.0 20.8 6.9 14.5 44.5
Ineligible subjects (n ⫽ 136)
65.3 ⫾ 9.1 56.5 ⫾ 15.5 23.0 ⫾ 5.1 ⫺3.4 ⫾ 0.6 ⫺1.5 ⫾ 0.7 94.1 39.7 12.5 16.9 42.6 1.5 5.9 20.6 3.7 27.2 2.9 16.2 38.2
Based on Student’s t test (two-tailed) for continuous variables, and the 2 statistic for categorical variables. All data shown are mean ⫾ SD. c All data shown are percentages. a b
Pa
0.47 0.13 0.60 ⬍0.0001 ⬍0.0001 0.80 0.80 0.96 0.17 0.10 0.02 0.08 0.32 0.87 0.19 0.12 0.68 0.27
Tannenbaum et al. • Yield of Laboratory Testing for Osteoporosis
J Clin Endocrinol Metab, October 2002, 87(10):4431– 4437 4435
TABLE 4. Frequency of laboratory abnormalities in 173 women Lab abnormality
No. of tests performed
No. of abnormal tests (%)
No. of abnormal tests that contributed to a new diagnosis
Elevated PTH Hypocalciuriaa Hypercalciuriaa Low 25 OHD Low TSHb High urine cortisol Anemia Monoclonal peak (SPEP/IPEP) Hypercalcemia Leukopenia Total
173 173 173 173 158 109 173 143 173 173 1448c
27 (15.6) 22 (12.7) 17 (9.8) 9 (4.6) 4 (2.5) 4 (3.7) 5 (2.9) 3 (2.1) 3 (2.0) 2 (1.6) 96 (6.6)
27/27 12/22 17/17 9/9 4/4 1/4 0/5 0/3 2/3 0/2 72
a
See text for definitions. All women on thyroid replacement therapy had TSH measurements. c Total does not equal the sum of the number of tests because 24-h urine calcium measurements were performed only once to identify both hypo- and hypercalciuria. b
TABLE 5. Cost and yield of potential screening strategies Strategy (no. of patients tested)a
No. of disorders diagnosed (% of total 56)
Mean cost per patient
Mean cost per diagnosis
Strategy 1 a) 24-h urine calcium for all women (173) b) If urine calcium abnormal, serum calcium and serum PTH (29) c) Serum TSH for all women on thyroid replacement (25) Strategy 2 a) 24-h urine calcium, serum calcium for all women (173) b) If either urine calcium or serum calcium abnormal, serum PTH (35) c) Serum TSH for all women on thyroid replacement (25) Strategy 3 a) 24-h urine calcium, serum calcium, serum PTH for all women (173) b) Serum TSH for all women on thyroid replacement (25) Strategy 4 a) 24-h urine calcium, serum calcium, serum PTH, serum 25OHD for all women (173) b) Serum TSH for all women on thyroid replacement (25) Strategy 5 a) Serum calcium, serum PTH, serum 25OHD for all women (173) b) Serum TSH for all women on thyroid replacement (25)
33 (59%)
$22
$116
35 (63%)
$30
$148
48 (86%)
$75
$272
55 (98%)
$116
$366
37 (66%)
$108
$506
a Estimated test costs based on Medicare allowable charges, expressed in 1999 U.S. dollars: 24-h urine calcium, $8; serum calcium, $7; serum PTH, $57; serum 25OHD, $41; serum TSH, $23.
mean cost of $272 per diagnosis ($75 per patient screened). It is noteworthy that TSH testing among women receiving thyroid replacement was highly cost effective: it actually reduced the cost per diagnosis relative to the corresponding strategies without TSH testing. Incorporating serum 25-hydroxy-vitamin D measurements (strategy 4) yielded only seven additional diagnoses, at considerable additional cost. Removing 24-h urinary calcium measurements from the most complete screening strategy (strategy 5) resulted in a considerable number of missed disorders and was least cost effective. Risk factors for the detection of new disorders
Only a personal history of localized breast cancer and a history of smoking were statistically significant correlates (P ⱕ 0.05) of a previously undetected disorder of bone or mineral metabolism, with crude odds ratios and 95% confidence intervals of 3.03 (1.2–7.6) and 2.02 (1.1–3.9), respectively. Neither Z score nor T score, nor any of the other demographic or historical variables tested significantly pre-
dicted the presence of underlying disorders. Slightly more women older than age 65 yr (n ⫽ 31), compared with younger than age 65 yr (n ⫽ 24) were found to have new disorders, but this number was not statistically significant. In multivariate analysis, using a model including age, T score, body mass index, family and personal history of fractures, nephrolithiasis and hypertension, a history of breast cancer and smoking remained significant predictors of a new disorder with only slightly changed adjusted odds ratio estimates of 2.72 (1.02–7.26) and 2.03 (1.03– 4.01), respectively. Sixty-four percent of women with new diagnoses had a history of smoking and/or breast cancer; among women without such diagnoses, the corresponding figure was 42%. There was no type of disorder that was specifically related to either predictor. Discussion
As bone density testing becomes more widespread, physicians will be increasingly confronted with decisions regarding laboratory testing before prescribing potent, po-
4436
J Clin Endocrinol Metab, October 2002, 87(10):4431– 4437
tentially lifelong medications for osteoporosis. Both the frequency of undetected underlying disorders and the yield of the related laboratory tests must be understood if suitable laboratory screening strategies are to be devised. Our study suggests that undiagnosed disorders of bone and mineral metabolism are present in up to one third of osteoporotic women without major medical risk factors for low bone density. Only one previous study has reported the yield of laboratory screening to detect underlying disorders associated with low bone density. Johnson et al. (13) identified previously unrecognized contributors to osteoporosis in 19 (11%) of 180 patients with osteoporosis and bone densities that were lower than expected for age. The higher prevalence of disorders (32%) found in our study likely reflects the different laboratory investigations used in the two studies. Measurements of PTH and urinary calcium were not included in the study by Johnson et al., and in our study, disorders of calcium metabolism and hyperparathyroidism detected by urinary calcium and PTH abnormalities contributed to 78% of disorders identified. The frequency of occult disorders found in our study is relevant for women with osteoporosis who lack known risk factors for low bone mass. This population represents 53– 90% of new referrals for osteoporosis (13–15). Failure to identify underlying disorders of bone and mineral metabolism can result in inappropriate or inadequate treatment. For example, standard recommendations for calcium intake for women with osteoporosis (16) are ineffective in patients with calcium malabsorption. These patients not only remain at high risk for further bone loss and fractures (17) but also may be at increased risk for hypocalcemia when potent bisphosphonates are prescribed. Both renal and idiopathic hypercalciuria are associated with decreased bone mass and can be treated with thiazide diuretics or dietary modification (18 – 20), respectively, but suitable therapy requires that the appropriate diagnosis be made. The yield and estimated cost-effectiveness of the laboratory screening strategies listed in Table 5 depend on the diagnostic criteria for underlying bone disorders and their impact on patient management. The diagnosis of vitamin D deficiency may be of less therapeutic importance among women with osteoporosis if adequate vitamin D supplementation is routinely provided. Although vitamin D supplementation is generally recommended, the usually prescribed dose (400 IU daily) for those under 70 yr old may be insufficient to produce vitamin D levels in the optimum range in all patients (21). If, however, higher doses of vitamin D become standard for all women with osteoporosis, the yield of screening strategy 3 in Table 5 (24-h urinary calcium ⫹ serum calcium ⫹ serum PTH for all patients ⫹ TSH for patients on thyroid replacement) would then increase to 96% (47 disorders detected of 49 that required additional management). On the other hand, if the criteria used for diagnosing hypercalciuria were less stringent and included women whose laboratory values were only 1 sd above the mean, more disorders might be identified with strategy 1 (serum calcium and PTH measurements performed only if calcium excretion is abnormal) at a lower overall cost per occult disorder. Regardless of the strategy, the cost and cost-effectiveness
Tannenbaum et al. • Yield of Laboratory Testing for Osteoporosis
of laboratory screening will obviously reflect local costs and reimbursement policies. Stepwise testing approaches (strategy 1) may lead to incomplete follow-up because of the longer interval required to make a diagnosis and implement therapy. Because our analysis was conducted from the standpoint of the third-party payer, it did not incorporate the additional costs to patients of repeat testing visits. Among our patients, a history of localized breast cancer and smoking were found to be independent predictors of unsuspected bone and mineral disorders. Women with breast cancer have been noted to have higher bone density and a lower incidence of osteoporosis than their peers (11, 12), perhaps reflecting higher cumulative estrogen exposure (22–26). Therefore, when women with a history of localized breast cancer develop osteoporosis, it may be even more likely that the culprit is a previously undetected underlying disorder causing low bone mass. Smoking has also been linked to the development of low bone mass (27, 28). Decreased intestinal calcium absorption is one potential mechanism (26, 29). Although disorders of calcium absorption and metabolism were not significantly related to smoking status in our study, it is possible that there was insufficient power to detect this relationship or that there are unknown mechanisms that play a role. One limitation of our study is that a large number of subjects were excluded because of incomplete testing. In most cases, patients were noncompliant with completion of the recommended tests; in some cases, a full laboratory work-up was not requested by the treating physician because of low clinical suspicion of an underlying disorder (e.g. strong family history and higher Z scores). However, there is little reason to suspect that these women would have differed significantly with respect to the distribution of undetected disorders because they were generally similar to the study subjects except for slightly higher T and Z scores and a lower frequency of nephrolithiasis. Among subjects with complete data, none of these variables were associated with newly diagnosed disorders. In addition, all women potentially eligible for this study had low bone density (mean T score of ⫺3.55), and mean bone density for both groups was below average for their peers (low Z scores). Even if the group of women without complete laboratory testing is included in the denominator and is assumed to harbor no new diagnoses, the prevalence of previously undetected disorders remains high at 18% (56 of 309). This suggests the need for at least some laboratory testing to identify those who require attention to specific metabolic abnormalities to provide optimal management. Classification of our subjects with respect to calcium, vitamin D, and PTH disorders must be interpreted with some degree of caution. Calcium absorption and excretion are dependent on dietary sodium, fat, and fiber consumption, and these were not measured in this study (30). We used a conservative definition of vitamin D deficiency so as not to overdiagnose vitamin D insufficiency in the absence of PTH abnormalities (4, 5); disorders related to PTH regulation may have been overestimated because there is some evidence to suggest that serum PTH levels increase as a function of age (31). We conclude that undiagnosed disorders affecting the
Tannenbaum et al. • Yield of Laboratory Testing for Osteoporosis
skeleton are common in postmenopausal women with osteoporosis without known risk factors for low bone density, particularly if there is a history of breast cancer and/or smoking. Our data, in these patients, suggest that a basic screen consisting of serum calcium, serum PTH measurement, and 24-h urinary calcium excretion in all patients (plus serum TSH among women on thyroid replacement) provides high diagnostic yield at acceptable cost. The diagnostic yield and cost-effectiveness of this testing strategy in other populations is not known. It is possible that routine tests such as complete blood count and chemistry profile will yield a higher number of new diagnoses in those who are not already under routine medical surveillance by primary care providers as were most of the patients in our series. Among patients with major risk factors for bone disease, the most appropriate testing strategy may vary according to the preexisting medical conditions. Prospective studies, therefore, are needed to develop evidence-based guidelines for laboratory testing appropriate to all groups of women with osteoporosis. In the interim, clinicians should recognize the importance of occult bone and mineral disorders and their potential impact on older women’s health. Acknowledgments Received February 21, 2002. Accepted June 4, 2002. Address all correspondence and requests for reprints to: Marjorie Luckey, M. D., Saint Barnabas Osteoporosis and Metabolic Bone Disease Center, 200 South Orange Avenue, Livingston, New Jersey 07039. Email:
[email protected]. C.T. is the recipient of a Postdoctoral Fellowship Award from the Canadian Institutes of Health Research. This work was supported by a Chercheur-Boursier Clinicien award from the Fonds de la Recherche en Sante´ du Que´ bec (to K.S.).
References 1. Looker AC, Johnston CC, Wahner HW, Dunn WL, Calvo MS, Harris TB, Heyse SP, Lindsay RL 1995 Prevalence of low bone density in older U.S. women from NHANES III. J Bone Miner Res 10:796 – 802 2. Day JC 1993 Bureau of the Census 1993 Current population reports. Population projections of the United States by age, sex, race, and Hispanic origin: 1993 to 2050. Washington, DC: Government Printing Office 3. World Health Organization 1994 Assessment of osteoporotic fracture risk and its role in screening for postmenopausal osteoporosis. WHO Technical report series no. 843. Geneva: World Health Organization 4. Lips P, Duong T, Oleksik A, Black D, Cummings S, Cox D, Nickelson T 2001 A global study of vitamin D status and parathyroid function in postmenopausal women with osteoporosis: baseline data from the multiple outcomes of raloxifene evaluation clinical trial. J Clin Endocrinol Metab 86:1212–1221 5. Malabanan A, Veronikis IE, Holick MF 1998 Redefining vitamin D insufficiency. Lancet 351:805– 806 6. Heaney RP, Recker RR, Ryan RA 1999 Urinary calcium in perimenopausal women: normative values. Osteoporos Int 9:13–18 7. Asplin JR, Favus MJ, Coe FL 2000 Nephrolithiasis. In: Brenner BM, ed. Brenner, Rector’s the kidney, ed 6. Philadelphia: WB Saunders Co; 1774 –1793 8. Greenspan SL 1999 Clinical crossroads: a 73-year-old woman with osteoporosis. JAMA 281:1531–1540
J Clin Endocrinol Metab, October 2002, 87(10):4431– 4437 4437
9. Hansen MA, Overgaard K, Riis BJ, Christiansen C 1991 Potential risk factors for development of postmenopausal osteoporosis— examined over a 12-year period. Osteoporos Int 1:95–102 10. Margolis KL, Ensrud KE, Schreiner PJ, Tabor HK, Study of Osteoporotic Fractures Research Group 2000 Body size and risk for clinical fractures in older women. Study of Osteoporotic Fractures Research Group. Ann Intern Med 133:123–127 11. Cauley JA, Lucas FL, Kuller LH, Vogt MT, Browner WS, Cummings SR 1996 Bone mineral density and risk of breast cancer in older women: the study of osteoporotic fractures. JAMA 276:1404 –1408 12. Zhang Y, Kiel DP, Kreger BE, Cupples LA, Ellison RC, Dorgan JF, Schatzkin A, Levy D, Felson DT 1997 Bone mass and the risk of breast cancer among postmenopausal women. N Engl J Med 336:611– 617 13. Johnson BE, Lucasey B, Robinson RG, Lukert BP 1989 Contributing diagnoses in osteoporosis: the value of a complete medical evaluation. Ann Intern Med 149:1069 –1072 14. Caplan GA, Scane AC, Francis RM 1994 Pathogenesis of vertebral crush fractures in women. J R Soc Med 87:200 –202 15. Kleerekoper M, Peterson E, Nelson D, Tilley B, Phillips E, Schork MA, Kuder J 1989 Identification of women at risk for developing postmenopausal osteoporosis with vertebral fractures: role of history and single photon absorptiometry. Bone Miner 7:171–186 16. Food and Nutrition Board, Institute of Medicine 1997 Dietary reference intakes for calcium, magnesium, phosphorus, vitamin D, and fluoride. Washington, DC: National Academy Press 17. Ensrud KE, Duong T, Cauley JA, Heaney RP, Wolf RL, Harris E, Cummings SR 2000 Low fractional calcium absorption increases the risk for hip fractures in women with low calcium intake. Ann Intern Med 132:345–353 18. Borghi L, Schianchi T, Meschi T, Guerra A, Allegri F, Maggiore U, Novarini A 2002 Comparison of two diets for the prevention of recurrent stones in idiopathic hypercalciuria. N Engl J Med 346:77– 84 19. Misael da Silva AM, dos Reis LM, Pereira RC, Futata E, Branco-Martins CT, Noronha IL, Wajchemberg BL, Jorgetti V 2002 Bone involvement in idiopathic hypercalciuria. Clin Nephrol 57:183–191 20. Audran M, Legrand E 2000 Hypercalciuria. Joint Bone Spine 67:509 –515 21. Thomas MK, Lloyd-Jones DM, Thadhani RI, Shaw AC, Deraska DJ, Kitch BT, Vamvakas EC, Dick IM, Prince RL, Finkelstein JS 1998 Hypovitaminosis D in medical inpatients. N Engl J Med 338:777–783 22. Berrino F, Muti P, Micheli A, Bolelli G, Krogh V, Sciajno R, Pisani P, Panico S, Secreto G 1996 Serum sex hormone levels after menopause and subsequent breast cancer. J Natl Cancer Inst 88:291–296 23. Toniolo PG, Levitz M, Zeleniuch-Jacquotte A, Banerjee S, Koenig KL, Shore RE, Strax P, Pasternack BS 1995 A prospective study of endogenous estrogens and breast cancer in postmenopausal women. J Natl Cancer Inst 87:190 –197 24. Dorgan JF, Longcope C, Stephenson HE, Falk RT, Miller R, Franz C, Kahle L, Campbell WS, Tangrea JA, Schatzkin A 1996 Relation of prediagnostic serum estrogen and androgen levels to breast cancer risk. Cancer Epidemiol Biomarkers Prev 5:533–539 25. Greendale GA, Edelstein S, Barrett-Connor E 1997 Endogenous sex steroids and bone mineral density in older women and men: the Rancho Bernardo Study. J Bone Miner Res 12:1833–1843 26. Stone K, Bauer DC, Black DM, Sklarin P, Ensrud KE, Cummings SR for the Study of Osteoporotic Fractures Research Group 1998 Hormonal predictors of bone loss in elderly women: a prospective study. J Bone Miner Res 13: 1167–1174 27. Krall EA, Dawson-Hughes B 1999 Smoking increases bone loss and decreases intestinal calcium absorption. J Bone Miner Res 14:215–220 28. Law MR, Hackshaw AK 1997 A meta-analysis of cigarette smoking, bone mineral density and risk of hip fracture: recognition of a major effect. BMJ 315:841– 846 29. Krall EA, Dawson-Hughes B 1991 Smoking and bone loss among post-menopausal women. J Bone Miner Res 6:331–338 30. Wolf RL, Cauley JA, Baker CE, Ferrell RE, Charron M, Caggiula AW, Salamone LM, Heaney RP, Kuller LH 2000 Factors associated with calcium absorption efficiency in pre- and perimenopausal women. Am J Clin Nutr 72:466 – 471 31. Khosla S, Atkinson EJ, Melton LJ, Riggs BL 1997 Effects of age and estrogen status on serum parathyroid hormone levels and biochemical markers of bone turnover in women: a population-based study. J Clin Endocrinol Metab 82: 1522–1527