3Harvard School of Public Health, Landmark Center, P.O. Box 15677, ... are certified by US National Institute of Standard Technology to avoid matrix ... of organic chemical substances, for example PAHs, in PM without any pre- ... techniques have been introduced to obtain vapor samples ..... The heating program of ASE.
Original Article
Industrial Health 2008, 46, 582–593
A Simple Direct Injection Method for GC/MS Analysis of PAHs in Particulate Matter Mariko ONO-OGASAWARA1*, Toshihiko MYOJO1, 2 and Thomas J. SMITH3 1National
Institute of Occupational Safety and Health, 6–21–1 Nagao, Tama-ku, Kawasaki 214-8585, Japan of Industrial and Ecological Science, University of Occupational and Environmental Health, 1–1 Iseigaoka, Yahatanishi-ku, Kita-kyusyu 807-8555, Japan 3Harvard School of Public Health, Landmark Center, P.O. Box 15677, Boston, MA 02215, USA 2Institute
Received March 6, 2008 and accepted June 12, 2008
Abstract: A simple direct injection method for analysis of polycyclic aromatic hydrocarbons (PAHs) or other organic components of particulate matter by gas chromatography/mass spectrometry (GC/MS) was developed. This method uses a small custom brass capsule to insert a particulate sample deposited on a quartz fiber filter or powdery sample directly into a GC injector inlet. This approach was applied in the analysis of PAHs in diesel emissions and other particulate samples, which are introduced into the GC and analyzed by MS using selected ion monitoring mode. Quantitation is based on the concentration of PAHs in a standard reference material (SRM), which are certified by US National Institute of Standard Technology to avoid matrix effects on extraction efficiency. A standard filter is prepared by deposition of small amount of SRM of diesel particulate or ambient PM on quartz fiber filter. By this method, the linearity for 12 kinds of PAHs (3 to 6 rings) was demonstrated from 0.022 mg to 0.65 mg of SRM 1650. The linearity of BaP, for example, was confirmed from 0.028 to 0.845 ng. The reproducibility of this method determined by analyzing the standard filter was 15.4%. By selecting an appropriate SRM as a standard material, this method is applicable for analyzing PAHs in fine particulate matter of less than 1 µm from various origins. Preliminary results for a series of ambient particulate matter, roadside PM, diesel soot and sidestream smoke, are presented. This method enables analysis of organic chemical substances, for example PAHs, in PM without any pretreatment using organic solvent, and without any expensive modification of GC instrument. Key words: GC/MS, Thermal desorption, PAH, DEP, ETS, Particulate matter
Introduction There is a global concern about adverse health effects of ultrafine particulate matter (PM) originating from combustion source like diesel exhaust particles (DEP) and tobacco smoke. Electrical generators are often used in workplaces and passive smoking is one of the problems in the office environment. DEP and tobacco smoke are classified as Group 2A: probably carcinogenic to humans and Group 1: Carcinogenic to humans, respectively1–3). It is well known that these particles contain small amounts of polycyclic aromatic hydrocarbons (PAHs) and their methylated, oxidized and nitrated compounds, which are *To whom correspondence should be addressed.
considered to contribute the carcinogenicity of the PM. For assessing the work environment and exposure, it is important to conduct chemical characterization not only by measuring mass of PM. For example, in construction work environment though there are various kinds of PM such as diesel exhaust particle and mineral dust, it is difficult to assess the contribution of PM from combustion only by measuring mass of PM. Organic compounds, especially PAHs, are useful index for fine PM from combustion source. In order to determine organic compounds on PM, several off-line techniques have been established, such as liquid chromatography/fluorescent spectrometry and gas chromatography/mass spectrometry (GC/MS) following a pretreatment procedure including solvent extraction and a
SIMPLE DIRECT INJECTION-GC/MS ANALYSIS OF PAH IN PM concentrating process. While solvent extraction has been the primary tool of analysis for organic compounds, it is generally time-consuming and requires a large amount of bulk sample and organic solvents. Furthermore, the efficiency of extraction depends on the solubility of the individual organic components in the selected solvent and the ability of the solvent to penetrate the matrix. To avoid these matrix effects, thermal desorption (TD) techniques have been introduced to obtain vapor samples from aerosol particles suitable for GC and GC/MS analysis, as an alternative to the solvent extraction technique. Recent TD methods are introduced by Chow et al.4). The TD-GC/MS techniques are more convenient than abovementioned solvent extraction techniques because the timeconsuming sample extraction process is not required, and smaller samples may be used. Neusüss et al.5) developed a TD technique based on Curie point pyrolysis. Curie point pylorizer is also used to monitor n-alkanes in roadside aerosols collected on quartz fiber filters6). Another TD system, TDS2 (GERSTEL GmbH & Co.KG, Germany) was also applied to the roadside sample for qualifying wide variety of organic compounds7). Generally, these kinds of TD techniques that are carried out outside the GC injector result in a loss of compounds on the tubing walls of the transfer line. In the following techniques, TD procedure is performed in an injector part of GC system to avoid the loss of compounds by adsorption on the transfer line. Sigman and Ma8) developed a gas chromatographic system utilizing TD carried out in a GC injector for a dry surface wipe for the analysis of explosive traces using surface-abraded Teflon tubing as a solid support for sample. Another approach used a micro-scale sealed vessel for TD to determine the vaporized substances by GC/MS9–11). They quantified PAHs in airborne particulate matter, NIST SRM 1649a. Jing and Amirav12), and Amirav and Dagan13) developed a direct sample introduction (DSI) device for the analysis of trace amounts of semivolatile organic components in PM. The particulate sample is put in a tiny sample vial, which is placed in a sample holder that is then inserted into a GC injector. Falkovich and Rudich14) reported on an assessment of this DSI technique for the analysis of semivolatile organic compounds in the ambient sizesegregated aerosol sample. In the research reported here, we developed a simple TD method to conveniently handle the samples and place them in the GC injector where the semi volatile organic compounds can vaporize for analysis by GC/MS for the quantitation of PAHs in various airborne particulate matter of less than 1 µm. Particulate samples collected on quartz fiber filters are inserted in a small specially designed metal capsule, then the capsule is directly inserted into an injector of GC. Powdery samples are also ana-
583
lyzed according to the same way by samples are plugged with quartz wool inside of the capsule. Three standard reference materials (SRMs), SRM 1649a, 1650 and 2975 (National Institute of Standard Technology, NIST, Gaithersburg, MD) were used for calibration, and evaluation of the method after they were deposited on a quartz fiber filter, as a way to deal with matrix effects. Ambient particulate matter, roadside PM, DEP and simulated environmental tobacco smoke (ETS) collected on quartz fiber filters were preliminary analyzed for PAHs by this method.
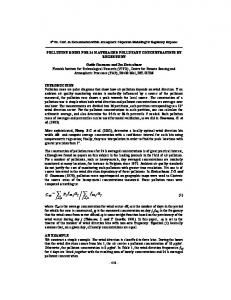
Materials and Methods Direct injection method for GC/MS Our method is simpler than precedent methods and does not require major modification of the GC system. Analysis was performed on a GC/MS system (GCQ Plus, ThermoQuest, U.S.A), which consists of a gas chromatograph (Trace GC 2000) equipped with a mass spectrometry detector (GCQ Plus Mass spectrometer). The inside diameter of the quartz liner in the injector is about 4.8 to 5.0 mm, which is wider than that of other manufacturers’ GCs. The injector’s liner fitting, which is an exchangeable part located between the septum cap and the glass liner, was modified to let the sample capsule easily slide into the liner. Though this fitting originally had a hole to pass a microsyringe needle for injection, the hole was widened to 7 mm in order to pass the sample capsule. The sample capsule is a custom-made brass tube. The size of the brass sample capsule is 4.6 mm in outside diameter and 18 mm in length, which fits inside of a standard quartz liner of a GC injector and easily drops into the bottom of the liner. The photographs of a capsule and an injection liner containing the capsule, which is an image of inside of the GC injector, are shown in the Fig. 1. Standard samples for analysis To evaluate the performance of the method, three kinds of SRMs containing PAHs were used. SRMs 1649a, 1650 and 2975 are distributed by NIST with certified analytical data for various chemical substances such as PAHs and polychlorinated biphenyls. SRM1649a is urban dust and its appearance is gray powder containing coarse particles. SRM 1650 and SRM 2975 are diesel exhaust particle from a heavy-duty truck and a forklift, respectively, and their appearance was a black fine powder. These SRMs have been used as reference materials by previous researchers to evaluate their methods9–11). Matrix effects can be important modifiers of PAH volatilization from particulate samples. To better compensate for matrix effects, we chose to use SRMs as calibration materials rather than the more common spiking solutions of pure
584
M ONO-OGASAWARA et al.
Fig. 1. Photographs of a capsule and GC liner containing the capsule inside.
PAHs onto blank filters. Standard solutions of PAHs (Supelco, Bellefonte, PA) were used for identification of each PAH, after diluted in dichloromethane (analytical grade, Wako Pure Chemical Industries, Osaka, Japan). As ISTD (internal standard), p-terphenyl-d14 (Wako Pure Chemicals) was used as a dichloromethane solution (0.2 µg/ml). Standard filter preparation To evaluate the performance of the method, three kinds of particulate SRMs containing PAHs were used. Standard filters used for evaluation of our method were prepared by deposition of SRMs on quartz fiber filters. Small amounts of each SRM were weighed in small glass containers and then each sample was sucked through a glass capillary (1 mm in nozzle diameter) to deposit them on a filter, as shown in Fig. 2. Dispersed SRMs were collected on 47 mm quartz fiber filters (Whatman QMA, Whatman Inc, Clifton, NJ), which had been cleaned by heating at 400˚C for 2 h to remove any organic residues and weighed before sampling. The filters containing SRMs were reweighed and used as standard filter samples. A part of sample material was lost on inner walls of the filter holder, in particular SRM 1650 and SRM 2975, yet the powdery samples were deposited almost uniformly on the filter.
Fig. 2. Schematic diagram of a standard filter preparation.
Sample collection To check the applicability of this method, PM of less than 1 µm in four typical environment exposure setting was collected on clean quartz fiber filters using a DPM sampler (SKC Inc., Eighty Four, PA U.S.A.) operating at 2 l/min or a Sioutas impactor (SKC Inc.) at 9 l/min with a MP-∑500 pump (Shibata Scientific Technology Ltd, Tokyo, Japan). Sampler and time period for sampling were selected according to the anticipated air concentration. Field and lab blanks were not corrected because pre-cleaned filters were immediately used for sampling after heat treatment. 1) DEP was collected from a diesel-exhaust-gas dilution system (Shibata Scientific Technology Ltd.), which consists of an electric generator YDG200SS of rated output 1.7 kW (Yanmer Co. Ltd., Osaka, Japan), cooling system, dilution tunnel, and exhaustion treatment system. Engine was operated with low sulfur fuel (JIS No.2). DEP was collected for sixty minutes and sampling volume was 0.12 m3. 2) Roadside PM sample was collected for twenty-four hours only in the morning near Ikegami—Shincho
Industrial Health 2008, 46, 582–593
585
SIMPLE DIRECT INJECTION-GC/MS ANALYSIS OF PAH IN PM crossing, Kawasaki, Japan (Aug 29th to 31st, 2004). Environment of this crossing is affected by heavy traffic, especially heavy-duty diesel vehicles6). Sampling volume was 8.1 m3. 3) Ambient particulate matter was collected for two weeks at a sampling port outside of the fourth floor of Japan National Institute of Occupational Safety and Health, Kawasaki, Japan, which is located in a suburban area. Sampling duration was five days (Sep 10th to 15th, 2003) and sampling volume was 15.0 m3. 4) Simulated ETS, mainly sidestream smoke was generated by sequentially lighting five cigarettes and allowing them to burn in a 27 m3 test chamber, a cube three meters on a side. From thirty minutes after igniting the first cigarette, the smoke was collected for ninety minutes. Sampling volume was 0.18 m3. GC/MS conditions The GC column was a HT8 (25 m × 0.22 mm ID, 0.25 µm film thickness, SGE Analytical Science Pty Ltd, Victoria, Australia). A guard column (Fused silica 100% methyl deactivated, 5 m × 0.22 mm, SGE) was installed between the injector and the analytical column to protect the analytical column from accumulation of less volatile compounds desorbed from the injected sample. The temperature program of the GC column oven was as follows: initial temperature was 80˚C for 3 min, increased to 330˚C at a rate of 20˚C/min, then held for 7 min. The flow rate of helium carrier gas was 1 ml/min with pressure compensation. The temperature of GC injector was constant at 300˚C. The splitless time of injection was set for 1 min. The MS source temperature was set at 225˚C and the temperature at the transfer line between the GC and MS was 300˚C. Electron impact ionization (electron energy 70 eV) was used to generate ions. For qualitative analysis, standard solutions were analyzed by the total ion monitoring mode. Mass spectra were confirmed for PAHs in
Fig. 3. Schemes of analytical procedures.
Table 1.
Target polycyclic aromatic hydrocarbons PAHs
Abbreviation
Mass Numbers monitored of rings
bp(˚C)
Phenanthrene
PHE
178
3
338
Anthracene Fluoranthene Pyrene Benzo(a)anthracene Chrysene Benzo(b)fluoranthene Benzo(k)fluoranthene Benzo(e)pyrene Benzo(a)pyrene Indeno(1,2,3-cd)pyrene Dibenzo(a,h)anthracene
ANT FLU PYR BaA CHR BbF BkF BeP BaP IND DBahA
178 202 202 228 228 252 252 252 252 276 278
3 4 4 4 4 5 5 5 5 6 5
340 383 393 425 431
Benzo(ghi)perylene
BghiP
276
6
542
480 493 496 536 535
both solutions and SRMs. For quantitative analysis, 12 peaks of 13 kinds of PAHs are monitored by the selected ion monitoring (SIM) mode with mass numbers listed in Table 1. Calibration curves are prepared by analyzing a certain area of standard filter. When DEP is analyzed, standard filter of SRM 1650 is used. When ambient PM and tobacco smoke are analyzed, the standard filter of SRM 1649a is used to avoid matrix effect. Analytical procedure Analysis of PAHs on particulate matter was conducted by the method as follows (see also Fig. 3). Numbers identifying steps for this procedure, written in parentheses below, correspond to the numbers in Fig. 3: (1) The capsule was filled with sample. For a filter sample, a small piece of filter with a diameter of 4 mm is punched out of a whole filter using the blade-like end of the brass capsule (No.1 in Fig. 3). Alternatively, a square punch, 4 mm × 12 mm, may be used in order to analyze a larger amount of sample. One or two pieces
586
M ONO-OGASAWARA et al.
Fig. 4. Gas chromatograms of the standard filter of SRM 1650, 1649a and 2975.
of punched filter are set in a capsule along the inner wall. Bulk samples of powdery materials are precisely weighed and packed in a brass capsule between quartz wool plugs at upper and lower end of the sample. (2) Three µ l of ISTD was added to the sample with a microsyringe just before the injection, if needed (No.2 in Fig. 3). (3) The capsule was attached to a hand-made injection tool (No.3 in Fig. 3). (4) The septum cap of GC was manually opened and the sample capsule was pushed into a glass liner of the GC (No.4 in Fig. 3). The injector temperature was set at 300˚C. GC analytical program was started just after the insertion, and the septum cap closed. The program is the normal one for this system as described later. The capsule is nearly instantaneously heated to the injector temperature, 300˚C, and the vapors evolved from the sample are introduced into the GC column. This thermal desorption temperature is decided from maximum temperature of the injector and oven on the gas chromatograph and operability. (5) After finishing the analysis, the septum cap was opened once more and the capsule was picked out by another small tool (No.5 in Fig. 3). After the sample is pulled out of the capsule, the capsule is washed with water, sonicated with acetone for 15 min, and finally washing with dichloromethane by an Accelerated Solvent Extraction system, ASE200 (Dionex, Sunnyvale, CA, U.S.A.). The heating program of ASE consists of two steps: The first one is washing with
dichloromethane at 100˚C, 10.3 MPa for 5 min with 1.2 times the cell volume. The second step is washing with dichloromethane at the same temperature and pressure, but with the same volume as the cell.
Results Chromatograms Typical chromatograms of SRMs 1650, 1649a and 2975 of sample filter are shown in Fig. 4. All PAHs from 3 to 6-rings were well resolved and eluted within 30 min. Since BbF and BkF were observed as one peak, they are abbreviated to B(b+k)F. Powdery samples also showed similar chromatograms as filter samples by the same analytical method. Linearity PAHs of 3 to 6-ring are readily determined by this method. In order to check the range of linearity of this method, one or two punched round sheets or a square sheet from the prepared standard filter of SRM 1650, and precisely weighed powdery samples were analyzed. As the regression coefficients for peak heights are better than that of peak areas, all PAHs are calculated by their peak heights. Figures 5 and 6 show the relationship of peak height of each PAH and the weight of SRM1650 injected. The regression coefficients are also shown in the figures. Most of PAHs show fair linearity even if the shapes and numbers of filters are different, and powder samples are included. The linearity was observed for the inject-
Industrial Health 2008, 46, 582–593
587
SIMPLE DIRECT INJECTION-GC/MS ANALYSIS OF PAH IN PM
Fig. 5. Relationships between peak height of gas chromatogram for 3-4 rings of PAHs and injected sample mass of SRM1650.
Fig. 6. Relationships between peak height of gas chromatogram for 5-6 rings of PAHs and injected sample mass of SRM1650.
ed sample mass of SRM1650 from 0.022 to 0.65 mg. By analyzing the standard filter, we confirmed the linearity in the range of smaller amounts than previous research11). The regression coefficients for 6-ring PAHs are worse than other PAHs. The contents of BaP, IND and BghiP were only a few µg/g and lower than other PAHs based on the datasheet attached to the SRM 1650. Moreover, in the chromatogram peaks, these 6-rings PAHs become broader, therefore the detection of these PAHs are difficult. As the contents of ANT and DBahA are not listed in the datasheet, we were not able to determine them. The regression coefficients should be improved when calibration is performed by using the same shape of standard filters are used. Reproducibility In the present method, standard filters are used as the analytical standard for determination. Reproducibility of our method depends on the uniformity of particle dispersion on the filter and stability of GC/MS analysis.
Fig. 7. The order of analysis for confirmation of reproducibility.
Though particles were uniformly deposited by visual check, the uniformity of a standard filter is determined by GC/MS analysis. The practical reproducibility including error of GC/MS analysis of this method is determined by repeated analysis of nine punched pieces from one standard filter of SRM 1650 (Fig. 7). Before the analyses, an internal standard (ISTD) solution was added to the filter pieces to improve reproducibility. The reproducibility is listed in Table 2. Though the reproducibility without ISTD was more than 20%, it was improved by adding ISTD. When the data were recalculated by height corrected with ISTD, the reproducibility was 15.4%. IND and DBahA were not determined when one piece of the standard filter was analyzed. The reproducibility of BghiP was worse than other PAHs, because peaks of chromatograms became broader for 6-ring PAHs. These results show the uniformity of particle dispersion over the filter should be less than 15% considering fluctuation of GC/MS analysis. The standard filters prepared by our method can be used as an analytical standard within the range of error to determine PAHs in particulate matter. Comparison of different SRMs Standard filters of SRM 1649a and 2975 were prepared and PAHs were analyzed by the above method. The results were compared to the calibration curves for SRM 1650. Peak heights and injected PAHs, which are calculated from the injected weights of SRMs and certified concentration of PAHs in the SRM 1649a and SRM 2975, are plotted in Fig. 8 (3 to 4-rings) and Fig. 9 (5 to 6rings). For example, if injected amount of SRM 1649a is 0.05 mg, as BaP content in SRM 1649a is 2.51 µg/g according to the certified value by NIST, injected amount of BaP is calculated as 0.13 ng. The triangle and circles in Figs. 8 and 9 are our results for SRM 1649a and SRM 2975, and the calibration line is that for SRM 1650 with its 95% confidence interval. Concentration of ANT and DBahA for SRM 1650 are not listed in the datasheet,
588 Table 2.
M ONO-OGASAWARA et al. The reproducibility of direct injection GC/MS method (n=5) Area
PHE ANT FLU PYR BaA CHR B(b+k)F BeP BaP IND DBahA BghiP Average
Area corrected by ISTD*1
Height
Height corrected by ISTD*1
Peak area
Stdev
Stdev/Area (%)
Peak height
Stdev
Stdev/Area (%)
Area ratio*2
Stdev
Stdev/Ave (%)
Height ratio*3
Stdev
55,644
6,745.1
12.1
32,851
3,690.0
11.2
2.08
0.268
12.9
2.09
0.196
9.4
22,215 80,153 71,949 26,307 69,486 155,908 56,274 35,615 14,628 40,371
4,836.4 7,072.1 9,673.6 5,129.7 10,637.5 24,144.8 13,834.3 7,480.9 6,669.2 13,636.7
21.8 8.8 13.4 19.5 15.3 15.5 24.6 21.0 45.6 33.8
11,860 2,018.5 47,445 5,860.7 41,296 6,147.0 12,195 2,864.3 26,370 5,526.4 52,209 10,816.7 25,624 5,251.1 121,994 3,844.5 2,995 823.2 7,188 2,501.4
17.0 12.4 14.9 23.5 21.0 20.7 20.5 31.5 27.5 34.8
0.82 2.98 2.67 0.97 2.57 5.77 2.08 1.32 0.53 1.48
0.148 0.172 0.185 0.110 0.200 0.466 0.381 0.200 0.215 0.409
18.0 5.8 6.9 11.3 7.8 8.1 18.3 15.2 40.2 27.6
0.75 3.01 2.61 0.76 1.66 3.28 1.61 0.76 0.19 0.45
0.078 0.296 0.228 0.102 0.216 0.417 0.182 0.187 0.037 0.130
10.4 9.8 8.7 13.4 13.0 12.7 11.3 24.5 19.7 28.9
62,321
13,980.6
22.4
29.3
2.30
0.367
15.9
0.85
0.196
23.0
13,597
3,986.4
21.2
22.0
15.7
Stdev/Ave (%)
15.4
*1ISTD:
3 µl of internal standard, p-terphenyl-d14 of 0.02 µg/ml solution. *2Ave: Averages of the ratio of peak area of each substance to that of ISTD. *3Ave: Averages of the ratio of peak height of each substance to that of ISTD.
therefore, these two PAHs are not plotted in the figures. Contents of larger PAHs in SRM 2975 were too low to detect. In Fig. 8, the plots of SRM 1649a and 2975 nearly coincided with that of SRM 1650 except PHE. This means these PAHs in different SRM evaporate quantitatively and they are well estimated by the calibration curves made from SRM 1650 even though the properties of samples are different. Results of PHE of SRM 1649a are outside of the 95% confidence line. PHE is a most volatile in tested PAHs and it may need more sophisticated injection method or cryo-focus. As PAH concentrations in SRM 2975 are smaller than in other two SRMs, plots of SRM 2975 appeared near the origin. In Fig. 9, most of the analyzed values for SRM1649a are out of 95% confidence line. For B(b+k)F, the certified concentration of BbF was not listed in the datasheet of SRM 1650, the calibration line of SRM 1650 was plotted from the data of BkF only, while SRM 1649a was plotted by the sum of B(b+k)F. In addition, as mentioned before, BbF and BkF are not separated each other, hence some deviation should occur in the case of BbF and BkF. This result is reasonable because actual injected amount of BbF and BkF from SRM 1650 should be larger than plotted. One reason of deviation for other PAHs, concentrations of 6-ring PAHs in SRM 1649a were larger than in SRM 1650, therefore PAHs in SRM 1649a will need to be extrapolated when SRM 1650 is used as the calibration standard. Another reason of the deviation must be from matrix effect that is often observed for the results by solvent extraction method. Peak height of 5 and 6-ring of
PAHs from SRM 1650 is smaller than that from SRM 1649. This means that recovery from DEP is lower than that from ambient PM. This result coincides with the result of solvent extraction method that DEP need to be extracted with the stronger condition than ambient PM. Usually, the recovery of each PAH is corrected by the spiking standard solution. For our method, it is difficult to assess the recovery by the spike method, because recovery from filter, from surface of PM and from inside of PM are expected to be different. From this point of view, we chose the standard filter, which is prepared by depositing SRM on a quartz filter, as a standard for determination. It should be possible to avoid the matrix effect by selecting an appropriate SRM comparable to target samples. For example, when ambient airborne samples are analyzed, SRM 1649a should be selected as the calibration standard because matrix is resemble and concentrations of larger PAHs are usually high in ambient samples. PAH profile of different environmental samples Profiles of PAHs in DEP, roadside PM, ambient PM and tobacco smoke are shown in Fig. 10 (a-d). Vertical scale of these figures is concentration of each PAH in unit mass of PM. Collected amount of PM and injected amount into GC are also shown in the figures. Injected amounts of each sample are 7.0 µg to 60 µg, this means that injected amounts of each PAH are around pg to subng level. Each PM shows different profile as follows: Main components of DEP and heavy traffic roadside PM are three and four rings of PAHs. For suburban ambient PM, three to six rings of PAHs are observed and their
Industrial Health 2008, 46, 582–593
SIMPLE DIRECT INJECTION-GC/MS ANALYSIS OF PAH IN PM
589
Fig. 8. Comparison of analytical results of 3-4 rings of PAHs between SRM 1650, 1649a and 2975.
concentrations are not different each other. Level of PAHs in ambient PM is one-fifth to one-tenth of roadside PM. The profile of tobacco smoke is much different from that of other PM samples. Chrysene is observed in the highest concentration of PAHs, and BaP concentration is higher than BeP.
Discussion A simple direct injection-TD method for particulate samples applied for GC/MS analysis without special
equipment or major modification of instrument was presented in this paper. By this method, semi-volatile organic compounds in PM are analyzed without any pretreatment like solvent extraction. Small piece of filter punched out from filter collecting PM is directly injected into GC injector and heated and evolved organic compounds from PM are analyzed by MS. This method has advantages such as easy operation and no need of solvent extraction. To conduct determination by the TD method, we used standard filters to prepare calibration curves instead of standard solution, which is prepared by depositing SRMs
590
M ONO-OGASAWARA et al.
Fig. 9. Comparison of analytical results of 5-6 rings of PAHs between SRM 1650, 1649a and 2975.
on quartz fiber filter and by weighing mass. A standard solution is usually used by spiking it on filters or PM samples, and calibration conducted and recovery is corrected for each substance. However, even if this correction procedure is conducted, it is difficult to correct matrix effects perfectly. Homogeneous deposition of SRM is necessary for out method. The uniformity of the standard filter was checked by analyzing several small pieces of filters punched out from a sampling filter. Analytical reproducibility shows about 15% including uniformity of standard filter, recovery and the error of GC/MS analy-
sis. As shown in Fig. 9, recoveries of PAHs of higher molecular weight are dependent on sample character because of matrix effect. As the summary of Figs. 8 and 9, the ratios of measured PAHs in SRM 1649a and 2975 using the calibration curves for SRM 1650 to the certified values are listed in Table 3. The recovery of PHE is fluctuated and the value for SRM 1649a is 50% percent higher than that for SRM 1650. The higher value means PHE in SRM 1649a might be more volatile than in SRM 1650, although fluctuation is too large. The reason of the fluc-
Industrial Health 2008, 46, 582–593
591
SIMPLE DIRECT INJECTION-GC/MS ANALYSIS OF PAH IN PM
Fig. 10. The profiles of PAHs in particulate matter from different source. (a) DEP (b)roadside PM (c)suburban ambient PM (d)test ETS. Table 3.
Ratios of PAHs measured amounts calculated from the calibration curves of SRM1650 to the certified value for each SRMs PHE
FLU
PYR
BaA
CHR
BbkF
BeP
BaP
IND
DBahA
BghiP
SRM
1.47
0.84
0.90
0.99
1.19
1.69
1.20
1.31
1.76
3.66
3.91
1649
0.33
0.11
0.06
0.28
0.11
0.43
0.20
0.29
0.12
0.24
0.15
SRM
1.04
1.23
2975
0.39
0.10
(Upper: Average, Lower: Standard deviation, n=3)
tuation should be high volatility of PHE. For IND, DBahA and BghiP, the high ratios mean that these PAHs in SRM 1649a are recovered more easily than from SRM 1650. For SRM 2975, though most of PAH contents are lower than the limit of quantitation for the range of this test, PHE and FLU are recovered almost quantitatively. Because BbkF is the sum of BbF and BkF, the recovery is affected by the contents of each PAH in objective sample. From these values in Table 3, PAHs from FLU to BaP can be measured with not more than 30% of uncertainty. Instead of correcting recovery of each PAH from PM, we propose that the matrix effects could be reduced by selecting a similar nature standard material as objective sample. For example, when urban PM is analyzed, standard filter of SRM1649a is used; and when DEP is analyzed, that of SRM1650 is used.
In order to apply TD-GC/MS for a wide variety of PM, desorption efficiencies should be checked more precisely by other method. In our method, desorption temperature was not changed because of limitation of the maximum temperature of our GC instrument. Recovery should be checked more precisely at higher desorption temperature and other desorption conditions, such as desorption duration and split ratio, with more sophisticated GC system. Improvements to the injection system are needed for more stable operation and higher sensitivity. To reduce the contamination of GC system with oxygen and to avoid touching the hot GC septum cap, the injection port could be modified for backflushing with carrier gas during sample placement in the injector. Our simple method is easily applied in preliminary analysis of PAHs and other organic compounds in various types of PM with the smallest
592 modification of GC system, even though there are drawbacks. This approach also eliminates the large quantities of toxic waste solvents generated in the traditional solvent extraction based analyses. This method is applicable to analyze various environmental PM samples. Typical PM from four different sources with size less than 1 µm was analyzed by this method. For DEP from an electric generator, 3 and 4ring PAHs, PHE, FLU and PYR, were the dominant PAHs (Fig. 10(a)). Although a similar profile is observed for roadside PM polluted with exhaust from heavy-duty diesel (Fig. 10(b)), contents of PAHs, PHE, FLU and PYR are lower than DEP. PAHs of higher vapor pressure could be lost from the roadside PM. The concentrations and profile of PAHs are similar to the results reported by Ochiai et al.7). The profile of PAHs of suburban PM is different from that of roadside PM (Fig. 10(c)). The concentration of PAHs in suburban PM was lower than that of roadside PM and the levels of 5 and 6-ring PAHs are similar to that of 3 and 4-ring PAHs. It could be that 3 and 4-ring PAHs were lost by vaporization from fresh PM, and ambient PM is mixture of various PM, such as mineral dust and aged PM. For example, gasoline engines emit smaller amount of 3 and 4-ring PAHs and larger amount of BghiP than diesel engine15). Chemical components of tobacco smoke are affected by smoking pattern and brand, and they are different for mainstream smoke or sidestream smoke. Environmental tobacco smoke is a mixture of sidestream smoke, exhaled gas from smoker and ambient air. BaA and CHR are dominant in ETS as shown by previous research16, 17). The result by present method also shows BaA and CHR are major components of sidestream smoke (Fig. 10(d)). Further discussion of each location’s environment will be conducted in future. From the occupational hygiene point of view, it is important to monitor PAH concentrations in size-segregated particles from different environments such as factory, construction site, garage and even offices. Exposure to PM from combustion sources can be assessed by checking the profile and concentration of PAHs, and the procedure for PAH analysis becomes easier by applying this method.
M ONO-OGASAWARA et al.
3)
4)
5)
6)
7)
8)
9)
10)
11)
References 1) IARC (International Agency for Research on Cancer) (1989) Diesel and Gasoline Engine Exhausts and Some Nitroarenes. In: IARC monographs on the evaluation of carcinogenic risks to humans, Vol. 46. 41–185, World Health Organization, Lyon. 2) U.S. Environmental Protection Agency (2002) Health Assessment Document for Diesel Engine Exhaust.
12)
13)
USEPA EPA/600/8-90/057F. 01 May 2002, Office of Research and Development, National Center for Environmental Assessment, Washington, DC. IARC (International Agency for Research on Cancer). (2004) Tobacco smoking and tobacco smoke,Vol. 83; In: IARC monographs on the evaluation of carcinogenic risks to humans, World Health Organization, Lyon. Chow JC, Yu JZ, Watson JG, Ho SSH, Bohannan TL, Hays MD, Fung KK (2007) The application of thermal methods for determining chemical composition of carbonaceous aerosols: a review. J Environl Sci Health A 42, 1521–41. Neusüss C, Pelzing M, Plewka A, Herrmann H (2000) A new analytical approach for size-resolved speciation of organic compounds in atmospheric aerosol particles: methods and first results. J Geophys Res 105, 4513–27. Fushimi A, Hasegawa S, Tanabe K, Kobayashi S (2007) Investigation of characterization method for nanoparticles in roadside atmosphere by thermal desorption-gas chromatography/mass spectrometry using a pyrolyzer. Sci Total Environ 386, 83–92. Ochiai N, Ieda T, Sasamoto K, Fushimi A, Hasegawa S, Tanabe K, Kobayashi S (2007) Comprehensive twodimensional gas chromatography coupled to high-resolution time-of-flight mass spectrometry and simultaneous nitrogen phosphorous and mass spectrometric detection for characterization of nanoparticles in roadside atmosphere. J Chromatogr A 1150, 13–20. Sigman ME, Ma CY (1999) In-injection port thermal desorption for explosives trace evidence analysis. Anal Chem 71, 4119–24. Hall PA, Watson AFR, Garner GV, Hau K, Smith S, Waterman D, Horsfield B (1999) An investigation of micro-scale sealed vessel thermal extraction-gas chromatography-mass spectrometry (MSSV-GC-MS) and micro-scale sealed vessel pyrolysis-gas chromatography-mass spectrometry applied to a standard reference material of an urban dust/organics. Sci Total Environ 235, 269–76. Waterman D, Horsfield B, Leistner F, Hall K, Smith S (2000) Quantification of polycyclic aromatic hydrocarbons in the NIST standard reference material (SRM1649a) urban dust using thermal desorption GC/MS. Anal Chem 72, 3563–7. Waterman D, Horsfield B, Hall K, Smith S (2001) Application of micro-scale sealed vessel thermal desorption—gas chromatography—mass spectrometry for the organic analysis of airborne particulate matter: linearity, reproducibility and quantification. J Chromatog A 912, 143–50. Jing H, Amirav A (1997) Pesticide analysis with the pulsed-flame photometer detector and a direct sample introduction device. Anal Chem 69, 1426–35. Amirav A, Dagan S (1997) A direct sample introduction device for mass spectrometry studies and gas chromatography mass spectrometry analyses. Eur Mass Spectrom 3, 105–11.
Industrial Health 2008, 46, 582–593
SIMPLE DIRECT INJECTION-GC/MS ANALYSIS OF PAH IN PM 14) Falkovich AH, Rudich Y (2001) Analysis of semivolatile organic compounds in atmospheric aerosols by direct sample introduction thermal desorption GC/MS. Environ Sci Technol 35, 2326–33. 15) Rogge WF, Hildemann LM, Mazurek MA, Caw GR (1993) Sources of fine organic aerosol. 2. Noncatalyst and catalyst-equipped automobiles and heavy-duty diesel trucks. Environ Sci Technol 27, 636–51.
593
16) Gundel L, Kariyawasam R, Mahanama R, Daisey J (1995) Semivolatile and particulate polycyclic aromatic hydrocarbons in environmental tobacco smoke: cleanup, speciation, and emission factors. Environ Sci Technol 29, 1607–14. 17) Keller A, Siegmann HC (2001) The role of condensation and coagulation in aerosol monitoring. J Expo Anal Environ Epidemiol 11, 441–8.