A finite element approach to dynamical diffraction problems Ari-Pekka Honkanena, , Claudio Ferrerob and Jean-Pierre Guigayb, Vito Mocellac* a University of Helsinki, Department of Physics, PO Box 64, FI-00014 Helsinki, Finland b ESRF- The European Synchrotron, Grenoble, France
c CNR-IMM Consiglio Nazionale delle Ricerca- Istituto per la Microelettronica e Microsistemi
* Correspondence e-mail:
[email protected]
Abstract A finite element approach to solve numerically the Takagi-Taupin equations expressed in a weak form is presented and applied to simulate X-ray reflectivity curves, spatial intensity distributions and focusing properties of bent perfect crystals in symmetric reflection geometry. The proposed framework encompasses a new formulation of the Takagi-Taupin equations, which appears to be promising in terms of robustness and stability and supports the Fresnel propagation of the diffracted waves. This method, based on the COMSOL Multiphysics package is very flexible and has the potential of dealing with dynamical X-ray or neutron diffraction problems related to crystals of arbitrary shapes and deformations. The theoretical models have been implemented in a software solution meant to be made available to the relevant user community. 1. Introduction The Takagi-Taupin equations (TTE) are partial differential equations (PDE) which describe the dynamical Bragg diffraction in a deformed crystal (Takagi, 1962; Takagi, 1969; Taupin, 1962; Authier, 2004; Apolloni et al., 2008). Unfortunately, analytical solutions exist only for a few simple cases (Guigay et al., 2008; Morawe et al., 2008). In order to fully appreciate the nuances of realistic systems, one has to generally resort to numerical solution of the TTE (Hoszowska et al., 2001; Mocella et al., 2001). An approximate approach to solve diffraction curves of large crystals was introduced recently (Honkanen et al., 2014, Honkanen et al., 2016), and an iterative method starting from an integral expression of the TTE and involving a series expansion is used by Yan & Li (Yan et al., 2014). Traditionally, the TTE are solved (Epelboin, 1985; Epelboin, 1996; Epelboin et al., 1999) using a finite difference (FD) scheme easily implementable on a Cartesian mesh, but not on an arbitrary (e.g. deformed) mesh. The crystal surface is considered as flat, so that the inner deformed structure is taken into account, but not the possibly deformed shape of the crystal surface. Moreover, FDs neither allow simulating cases in which mixed transmission and reflection geometries are present. Furthermore, the incident wave is usually considered to be either a plane wave referring to an infinitely distant point-source or a so-called “spherical wave” referring to a 1
point-source located on the crystal surface, whereas the intermediate case of an arbitrary finite distance between the source and the crystal applies to many actual situations (Lagomarsino et al., 2002). Conversely, a finite element method (FEM) based on a weak numerical form of the differential TTE can potentially deal very well with cases of any incident wave and a crystal of any shape. A great advantage of this approach is that FEM implementations (Reddy, 2006; Oden & Reddy, 2012) used for engineering problems are readily available and can be applied to X-ray diffraction problems (Mocella et al., 2003; Mocella et al., 2015). One of the benefits of using FEM is that it supplies a great deal of flexibility in the selection of discretisation, both in the elements that may be used to discretise space and the so called basis and test functions. Smaller elements in a region where the gradient of the sought-after function is large could be easily used. Another considerable advantage of FEM is that its theory is well established, due to the close relationship between the numerical and the weak formulation of a PDE problem. In the present work, the reliability of FEM calculations implemented using a commercial software package (COMSOL Multiphysics®, http://www.comsol.com) is verified in the case of Bragg reflection from both a perfect and a cylindrically bent crystal plate. Bent crystals have frequently been used as focusing elements on X-ray or neutron beamlines both in reflection and transmission geometry (e.g. Tolentino et al., 1987; Chukhovskii et al., 1999; Podorov et al., 2001; Mocella et al., 2004; Mocella et al., 2008; Nesterets et al., 2008; Sutter et al., 2010; Guigay & Ferrero, 2016). In the next section, we propose to a FEM computational framework, in which the TTE are written in a form different from the most usual one, since this choice has proven to promote the stability of the numerical process. The incident wave is defined by its complex amplitude in a plane perpendicular to the direction of incidence corresponding to the exact Bragg condition; the reflected wave is similarly defined by its complex amplitude in a plane perpendicular to the direction of the Bragg-reflected wave. This allows expressing the boundary conditions on the crystal (curved) surface in a convenient way. 2. Takagi-Taupin equations Let us consider a crystal in Bragg diffraction geometry in which the incident beam is represented by e.g. a s-polarised monochromatic modulated plane wave of the form (the π-polarisation case can be described likewise)
y inc (r ) = exp(iko .r ) Einc (r )
(1)
in which ko = k = 2p / l , l being the X-ray wavelength The Bragg-reflected wave in air can also be expressed in an analogous form
2
y out (r ) = exp(ikh .r ) Eout (r )
(2)
in which kh = ko + h ( h is the Bragg diffraction vector of the crystal without deformation). The wave-field in the crystal is formally expressed by
y (r ) = exp(iko .r ) Eo (r ) + exp(ikh .r ) Eh (r ) (3) Definition (3) and the following expression of the crystal polarisability
c (r ) = c0 + ch exp[-ih.(r - u )] + ch exp[ih.(r - u )] + .....
(4)
where u ( r ) is the displacement field in the case of a deformed crystal, are to be included in the general wave equation
Dy + k 2 [1 + c (r )]y (r ) = 0
(5)
Formula (4) is a modified Fourier expansion limited to the terms which are relevant in the frame of the 2-beams dynamical theory; from (3) and (4), we obtain
c (r )y (r ) » [ co Eo + ch exp(ih.u ) Eh ]exp(iko .r ) + [ co Eh + ch exp(-ih.u ) Eo ]exp(ikh .r ) (6) The second order derivatives of the amplitudes Eo ,h (r ) can be neglected in the Laplacian term of (5) because Eo ,h (r ) are supposed to be slowly varying, as compared to exp(iko ,h .r ) . Hence, the following approximation applies:
Dy » [2iko .¶Eo - ko2 E0 ]exp(iko .r ) + [2ikh .¶Eh - kh2 Eh ]exp(ikh .r )
(7)
From (6) and (7), we obtain:
2ko .¶Eo = i[k 2 (1 + c0 ) - ko2 ]Eo + ik 2 ch Eh exp[ih.u (r )]
(8a)
2kh .¶Eh = i[k 2 (1 + c0 ) - kh2 ]Eh + ik 2 ch Eo exp[-ih.u (r )] Note
that
(8a)
can
be
simplified
taking
(8b) into
account
that
ko2 = k 2 and
that
(k 2 - kh2 ) / 2kh » k - kh » k Dq sin 2q B , where q B is the Bragg angle and Dq = q - q B , q being the glancing angle of incidence of the wave-vector ko on the Bragg reflecting planes. It is convenient to consider Eo ,h (r ) as functions Eo ,h ( so , sh ) of the oblique coordinates so and sh along the directions
(ko , kh ) and to use the relation ko ,h .¶F = ko ,h ¶ o ,h F ( so , sh ) valid for any function F ( so , sh ) with
3
gradient ¶F , as shown in Appendix B; here and henceforth, the notation ¶ o ,h F ( so , sh ) means partial derivatives with respect to so and to sh, respectively. Equations (8a, 8b) become therefore:
2¶o Eo = ik c0 Eo + ik ch Eh exp[ih.u (r )]
(9a)
2¶ h Eh = i[k co + 2(k - kh )]Eh + ik ch Eo exp[-ih.u (r )]
(9b)
The case of p-polarisation can be included in this formalism by replacing the coefficients c h ,h by
C c h,h , with C = 1 or cos 2q B in case of s- or p-polarisation, respectively. Using the notations c0,h,h = C c0,h,h (k / 2) , b = k Dq sin 2q B and introducing the functions so + sh ]Eo ( so , sh ) 2 s +s Dh ( so , sh ) = exp[ik c o o h + ih.u ( so , sh )]Eh ( so , sh ) 2 Do ( so , sh ) = exp[ik c o
(10a) (10b)
equations (9a, 9b) can be rewritten in the following form:
¶ o Do = ich Dh
(11a)
¶ h Dh = i[b + ¶ h (h.u )]Dh + ich Do
(11b)
Equations (11a, 11b) are the most usual form of the TTE. The explicit expression of the deformation term for a thin crystal plate is reported in Appendix A. Actually, it is more convenient to use a modified expression in terms of the functions
T ( so , sh ) = Do exp(-ish b ) = Eo exp[ik co ( so + sh ) / 2 - ish b ]
(12a)
D(so , sh ) = Dh exp(-ish b ) = Eh exp[ik co (so + sh ) / 2 - ish b + ih.u (so , sh )]
(12b)
The TTE are then written as:
¶ oT = ich D ¶ h D = i¶ h (h.u ) D + ichT
(13a) (13b)
Let us point out an equivalent, simpler and more direct approach to obtain (13a, 13b) by imposing the Bragg condition ko = kh = k in (3), with accordingly different modulation functions satisfying equations similar to (9a, 9b) without the term i 2(k - kh ) Eh in (9b).
4
Choosing the origin of coordinates in a point O of the crystal entrance surface ( r = rsurf ), the boundary condition on this surface in case of equations (11) is:
Do (rsurf ) = Einc (rsurf ) exp[ik c o
so + sh ]surf 2
(14)
and in case of equations (13):
T (rsurf ) = Einc (rsurf ) exp[ik co
so + sh - ish b ]surf 2
(15)
t
A O ) 2qB
5
M
O 2qB
N
)
B
x
Figure 1 (a | top): the incident amplitude Einc (r ) is shown to have the same value in the point M of the crystal surface and in the point A on the axis Ot ; (b | bottom): the reflected amplitude Eout (r ) is shown to have the same value in the point N of the crystal surface and in the point B on the axis Oξ.
The incident amplitude Einc (rsurf ) on the crystal surface is obtained as follows. Since exp(iko .r ) = 1 along the axis Ot perpendicular to ko , the incident wave-function (1) becomes
Einc (t ) on this axis.
The same wave-function at any point M of the crystal surface in the vicinity of O (see Fig.1a, where M is projected onto the point A on the axis Ot ) is given by Einc (t ) exp(ik AM ) = Einc (t ) exp(iko .rsurf ) . This means that Einc (rsurf ) = Einc (t ) . Noting that OA = sh sin 2q B , it is straightforward to recover that:
Einc (rsurf ) = Einc (t = sh sin 2q B ) . In the case of a point-source S at a distance p from the crystal we obtain: Einc (rsurf ) = exp(ikt / 2 p) = exp[ik (sh sin 2qB ) / 2 p]surf , in the frame of paraxial optics. 2
2
Let us consider the axis Oξ perpendicular to kh . Having shown that the incident amplitude Einc (r ) on the crystal entrance surface and on the axis Ot has the same value at points having the same tcoordinate, we can similarly show that the Bragg reflected amplitude Eout (r ) has the same value at points which have the same x-coordinate on the crystal surface and on the axis Ox (Fig.1b). This
6
allows obtaining the reflected amplitude along Ox, Eout (x ) = Eout ( so sin 2q B ) surf from the solution
D ( r ) of the TTE as follows: Eout (x ) = D( so sin 2q B ) surf exp[-ik c o ( so + sh ) / 2 + ish b - ih.u ( so , sh )]surf
(16)
3. Short description of the FEM method We stated that (13a, 13b) are a good basis for the FEM implementation, as they exhibit better stability than calculations based on (11a, 11b). This is due to the b term that is proportional to Dq in (11b); when this term increases, it is likely to produce rapid oscillations and therefore numerical instabilities. Following a well-established FEM procedure, both sides of equations (13a, 13b) are multiplied by test functions w ( so , sh ) and are integrated over a closed domain W with contour G
òò d W[¶ T - ic D]w = 0
(17a)
òò d W[¶ D - ic T - iD¶(u.h )]w = 0
(17b)
o
h
W
h
h
W
The test functions w as well as D and T are assumed to belong to an infinite dimensional Hilbert space, denoted by H. Actually, the application of FEM on these functions converts them to functions in a finite dimensional function space and then in ordinary Euclidian vectors (in a vector space) that can be managed via numerical methods. ˆh be the unit vectors along the axis Oso and Osh . According to the formulas in Let sˆo and s Appendix B, we can use
w¶ oT = ¶ o (wT ) - T ¶ ow = ¶.(sˆowT ) - T ¶ ow , w¶ h D = ¶ h (w D) - D¶ hw = ¶.(sˆhw D) - D¶ hw n being the unit outward normal on the contour G,
òò d W¶.(sˆ wT ) =ò dl n.sˆ wT , òò d W¶.(sˆ w D) =ò dl n.sˆ w D o
W
o
G
h
W
h
G
One obtains finally:
7
òò d W[T ¶ w + ic w D] = ò dl n.sˆ wT o
o
h
W
(18a)
G
òò d W[ D¶ w + ic T + iD¶ h
W
h
h
(h .u )] = ò dl n.sˆhw D (18b) G
Equations (18a, 18b) represent the so-called “weak or variational formulation” of the differential equations (13a, 13b). It is required that these equalities hold for all test functions in the Hilbert space H. The formulation is called “weak” because it relaxes the requirement expressed by (13a, 13b), where all the terms of the PDE must be defined in each point (pointwise formulation). The relations in (18a) and (18b) instead only entail equality in an integral sense. As an example, a first derivative discontinuity of the solution function does not preclude integration, it introduces however a distribution (in mathematical sense) for the second derivative. It is important to notice that in such a case (13a, 13b) become immaterial at the discontinuity point. Note that, in contrast to (17a, 17b), (18a, 18b) do not contain derivatives of the functions T (r ) and D ( r ) . They can be implemented in a FEM code, using a mesh of two-dimensional elements (often triangles, but also rectangles or even higher order elements are used) adapted to the crystal shape in a quite straightforward fashion. Mesh refinement tools (typically to produce denser meshes or to mix different types of elements) with the aim of leading to smaller errors affecting the numerical solution are easily provided by the COMSOL user interface. Let n be the number of knots of the mesh ( i = 1, 2,..., n ). The solution is expressed as
T (r ) = å i Ti Ni (r ) and D(r ) = å i Di Ni (r ) , where Ti and Di are coefficients to be determined. Ni (r ) are the basis (or shape) functions related to the i-th knot. Customarily, they are polynomial (e.g. B-splines) functions of degree one or higher: degree one appeared to be suitable for the purposes of this work. The basis functions range from the value 1 at the i-th knot to 0 on the border formed by the neighbouring knots which are the apices of the triangles sharing the i-th knot as apex. The wellknown Galerkin method (used in this work) utilizes a set of test functions identical to the basis functions, i.e.
w j (r ) = N j (r ) . Equations (13a, 13b) are then transformed into a system of 2n algebraic
linear equations with Ti and Di as unknown coefficients. One of the most outstanding assets of FEM is its ability to choose test and basis functions among a wide host of functions. It is often beneficial to select test and basis functions with a very small geometrical support region to allow for local changes in the final solution. It should be reminded that all the highlighted features reported above are not present in FD, thus making the FD solution of the same problem by far more laborious
8
and less efficient than the analogous FEM solution. The boundary conditions in the case of an arbitrary crystal shape are schematically depicted in Fig. 2.
A B
W G
D
C
Figure 2 Illustration of the boundary conditions in the case of a crystal with arbitrary shape: T (r ) = Tinc (r ) on the DAB portion of the crystal boundary and D(r ) = 0 on the ADC portion. 4. Application to Bragg diffraction by a cylindrically bent crystal in symmetric Bragg geometry The calculations in this section take into account the curvature of a cylindrically bent crystal surface, the incident beam hitting the crystal concave side. However, the bending radius amounts typically to a few meters and the width of the incident beam on the crystal surface is smaller than 1 mm in real experiments, such that the maximum surface deviation from a flat profile would be about 0.1 µm, unlikely to have an appreciable influence. We have verified that the results of our calculations do not practically change if the crystal surface is considered to be flat: in such a case, noting the geometrical relations x = (so + sh )cos q B and z = (so - sh )sin q B , the equations (13a, 13b) have to be solved along with the boundary condition:
co x 2 sin 2 q B ( x - a) 2 T ( x, z = 0) = exp[ik + ikx(Dq sin 2q B + )] 2p 2cos q B w2
9
(19)
where p is the distance between a point-source and the crystal, Dq = q - q B is the angular deviation from the Bragg direction of the ray incident on the centre O of the crystal surface (s. Fig. 3). The third term in the exponent of (19) is a Gaussian window with a displacement a from the central position in the x-direction. The case T ( x, z = 0) = exp[ikx(Dq sin 2q B + c o /(2cos q B )) - x / w ] referring to an 2
2
infinitely distant source, is the case of incident wave considered in (Gronkowski & Malgrange, 1984) and (Gronkowski, 1991). The bent crystal surface may be represented as z = x 2 / 2 R or so = sh + sh cos q B / 2 R tan q B and the 2
boundary condition along the bent surface can be written in terms of sh = t / sin 2q B as:
Einc ( so , sh ) = exp[ik
( sh sin 2q B ) 2 ( s sin 2q B - a sin q B ) 2 s +s + i b sh - h + ik c o o h ] 2 2p ( w sin q B ) 2
(20)
Once the numerical solution of (13a, 13b) is obtained, the expressions of Eo ,h (r ) are subsequently recovered via (12a, 12b).
Detector plane at distance q from O
q
h
####⃗ 𝑘"
Crystal curved surface
x
O z
ξ
10
####⃗ 𝑘%
Figure 3 Schematic drawing of the investigated Bragg symmetric reflection with incoming beam on the concave side of the cylindrically bent crystal (dimensions are not to scale). In order to describe the propagation of the reflected beam in air, we use the rectangular coordinates (x, q) defined by the axis Ox and Oq perpendicular and parallel to 𝑘" , respectively (see Fig.3). The reflected wave amplitude Y (x , 0) has the same value as the function Eh in the point of the crystal surface with the same x-coordinate. The wave amplitude in any plane perpendicular to the reflected direction at distance q from the crystal is obtained through the Fresnel diffraction integral:
Y(x , q) =
1
ik
dx ¢Y(x ¢,0) exp[ (x - x ¢) ] 2q lq ò 2
(21)
4.1. Reflectivity curves of an undeformed crystal In order to validate our FEM method, we simulated the Si 111 reflectivity curve (RC) of an undeformed crystal plate for an incoming X-ray beam energy E=8 KeV (𝜃' =14.31 deg =0.25 rad), the incident beam being a plane wave multiplied by a Gaussian window (FWHM=100 µm) centred on the crystal surface, and compared it with the RC obtained using XOP (Sanchez del Rio & Dejus, 2011; Sanchez del Rio et al., 2015) under the same conditions. For the sake of computational efficiency only 400 µm total surface width were taken into account, as the incident wave intensity falls rapidly down to negligible values beyond the standard deviation of the Gaussian envelope of the beam. The RCs computed with different mesh sizes are presented in Fig. 4a: accurate results are obtained with a mesh size three times smaller than the extinction length. A natural choice in the FEM framework would be to modify the mesh size locally, according to the variation rate of the solution. Using the “boundary layer” option available in COMSOL improves the accuracy of the solution in the central part of the RC, but causes slight deviations in the tails (Fig. 4b), raising the requirement of a deeper investigation of the meshing process, which is however outside the scope of the present work.
11
Figure 4 (a | left): RC FEM simulations of a 100 µm thick perfect undeformed Si 111 plate for an 8 keV incident plane wave modulated by a Gaussian window (FWHM=100 µm) on the crystal surface. The curve obtained using XOP is shown as a reference. The strong artefacts seen for the 5 µm triangular mesh size are rapidly reduced by reducing the size down to 1 µm or by using the COMSOL boundary layer option depicted in (b | right) together with a 1.75 µm mesh without boundary layers, to be compared to the value of the extinction length Lx (Lx =3.40 µm), cf. also Appendix A.
4.2. Reflectivity curves of cylindrically bent crystals The crystal orientation is varied via the factor exp[i b x] of (16). As seen in Fig.5, the bent crystal RC with the source on the Rowland circle ( R = 5 m, p = R sin q B = 1.236 m) is similar to the unbent crystal RC with the source at infinite distance, with a “Darwin plateau” width around the expected value of 7.12 arcsec (=33.94 µrad). The largest deviation seen on the RC left-hand side may be related to the so-called mirage effect (Gronkowski & Malgrange, 1984; Gronkowski, 1991; Authier, 2004). The RC displacement towards larger incident angles, when the source is moved away from the Rowland circle, comes from the Gaussian window offset position a = 125 µ m . If the source is at infinity, this shift is given by a / R which amounts to 5.15 arcsec=24.24 µrad, in good agreement with the value estimated from Fig.5.
12
Figure 5 FEM simulation of Si (111) RC for a cylindrically bent crystal (radius of curvature R = 5 m, Poisson ratio n = 0.27, crystal thickness t=100 µm, 400 µm simulated crystal width) for various source distances (p=1.236, 2.5 , 5 , ¥ m). The X-ray energy is E=8 KeV. The FWHM of the Gaussian window on the crystal is 100 µm, with an offset a=125 µm to the left from the centre of the simulated crystal width. The on-Rowland-circle distance is p=1.236 m. The grid element size is 1 µm. The XOP reference curve is the same as in Fig.4. The change in the angle of incidence on the local reflecting plane along the beam path through a bent crystal of thickness t is t /( R tan q B ) = 16.2 arcsec (= 77.57 µrad) in the conditions of Fig.5 (for comparison, the corresponding Darwin width is equal to 7.12 arcsec(=33.94 µrad)). Some widening effect is therefore expected in the wings of all the bent crystal RCs of Fig.5, as compared to the unbent crystal RC with the source at infinite distance; this is clearly seen in Fig.5. Fig.6 is an illustration of the “mirage effect” mentioned above. The incident cylindrical wave, which is approximately a plane wave with incidence angle outside the Darwin range, excites a wave-field presenting a varying direction of propagation. This is due to the changing orientation of the locally reflecting plane along the beam trajectory in the crystal.
13
Figure 6 Map of the total beam intensity inside the cylindrically bent crystal showing clearly the “mirage effect”; Dq = -1.55 arcsec(=7.51 µrad). Same parameters as in Fig.5; source on the Rowland circle. 4.3. Reflected intensity distribution on the crystal surface Figs. 7a and 7b show the phase and intensity distributions, respectively, computed using 1 µm mesh grid for both unbent and bent crystals. The source is on the Rowland circle of the bent crystal with a centred Gaussian window of 200 µm FWHM and the X-ray energy is the same as above, i.e. E=8 KeV. The numerical artefacts which appear in the surface intensity behaviour obtained with a 2.5 µm mesh grid have no influence on the focus distribution (see Fig.8a). The comparison with the incident intensity distribution indicates an almost total reflection in the bent crystal case, whereas in the unbent case the reflected intensity drops faster on the right-hand side, owing to the fact that in this configuration the flat reflecting planes depart, from a certain point on, from the Darwin region.
14
Figure 7 Reflected phases (a | left) and intensities (b | right) on the crystal surface; point-source on Rowland circle; centred Gaussian window of 200 µm FWHM on the crystal surface; other parameters as in Fig.5. Notice the numerical artefacts in the 2.5 µm grid size FEM simulation.
Figure 8 (a | left) Computed intensity distribution in the focal position on Rowland circle, same parameters as in fig.7. Notice that the two focal spot distributions for 1 µm and 2.5 µm grid size overlap. (b | right). Effect of displacement of the detector from the focal position.
Fig. 9 shows the reflected intensities on the crystal (Si 111, E=8 KeV) surface, with a point-source on the Rowland circle and a varying Darwin range, i.e. 3.06 < Dq < 10.18 arcsec (14.54 < Dθ < 48.48 µrad). In the case Dq = 5 arcsec (=24.24 µrad), there is almost total reflection, as seen from the blue curve, which shows only a small difference compared to the dashed curve representing the incident intensity on the crystal surface; the chosen grid element size is 1 µm and the Gaussian window has a FWHM of 100 µm with a=125 µm offset. In the case Dq = 1 arcsec (=4.84 µrad), partial reflection near the crystal surface is observed and the incident beam at exact Bragg incidence penetrates to some extent below the crystal surface. Hence, the second peak observed on the right-hand side of the green curve of fig. 9a is due to the mirage effect, which also produces a double peak in the focus position (Fig. 9b).
15
Figure 9 (a | left) FEM simulation (1 µm grid size) of the reflected surface intensity distributions for different angles of incidence, with a point-source on Rowland circle and Gaussian window on the crystal surface of 200 µm FWHM and a=125 µm offset; (b | right) corresponding focus profiles; the double peak in the Dq = 1 arcsec (= 4.85 µrad) case is due to the mirage effect. Concerning Fig. 10a ( Dq = 5 arcsec(=24.24 µrad), centred Gaussian window of FWHM=200 µm), the changes in the shape of the reflected intensity distribution when the source is moved far away from the Rowland circle are a decreased intensity on the left-hand side and the occurrence of oscillations on the right-hand side. This can be interpreted as follows: the rays incident on the lefthand side are outside the Darwin range, hence they are weakly reflected at their incoming position and submitted to the mirage effect; at their emerging point, they interfere with the rays reflected on the right-hand side, producing the observed intensity oscillations. The respective intensities at the focus location are depicted in Fig. 10b.
16
Figure 10 (a | left) FEM simulation (1 µm grid size) of reflected surface intensity distributions for different distances of the source compared with the incident wave intensity; centred Gaussian window of 200 µm FWHM on the crystal surface. Dq = 5 arcsec(=24.24 µrad); (b | right) corresponding focus profiles (detector position according to the lens equation (23)).
4.4. Phase distribution of the reflected beam on the crystal surface and focusing properties As seen from Fig.7a, the phase distribution of the reflected beam on the bent crystal surface shows a parabolic shape from which the focal distance can be readily estimated by using the formula
j ( x) = p ( x sin q B ) 2 / l f . A focal distance f = 1.234 m is thereby obtained (as expected for the source on the Rowland circle). The bent crystal focusing effect is demonstrated by Fig. 8b, showing that the beam size increases almost symmetrically with respect to the exact Rowland circle location when the detector is moved 10 cm inside or outside the Rowland circle. There is no real focusing in the unbent crystal case, because of the sign of the concavity. Real focusing in the bent crystal case is related to the reversal of the sign of concavity shown in Fig. 7a. The focusing effect is essentially due to the deformation phase factor:
exp(-ih.u ) = exp(-i
hx 2 kx 2 ) = exp(-i ) 2R R sin q B
(22)
Thus, a phase modulation of the reflected wave brings on a focal point at the distance
q = R sin q B / 2 : this is the distance predicted in the case of an infinitely distant source by the lens equation (Chukhovskii & Krisch, 1992), which in the present case (symmetric reflection) reads:
1 1 2 + = p q R sin q B
17
(23)
Equation (23) can actually be retrieved via the following simple approach (see Fig.3): supposing that the crystal acts on the incident cylindrical wave-front as a simple mirror, thus producing a reflected wave-front of the kind exp(ikx 2 / 2 p) ; taking also the phase factor (22) into account, one finds
ikx 2 1 2 exp[ ( )] . This means that the wave-front is focussed at the distance 2 p R sin q B
q=(
2 1 - ) -1 , which is identical to the lens equation (23). R sin q B p
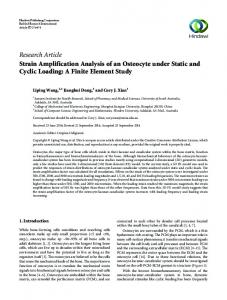
5. Application to experiments For the sake of generality of our approach, all calculations in the previous sections were performed under ideal or simplified conditions: e.g. monochromatic beam, no thermal load effects, perfectly cylindrical curvature, no mounting inaccuracies, and limited size of the incoming beam footprint on the crystal surface. The investigation of all these effects would depend strongly on each individual beamline optical setup to be examined, and this would be far out of the scope of the present research. However, the results of our simulations can be effectively used e.g. to predict the lowest size limits of the focal spots produced by bent crystals in given optical arrangements. Bearing in mind this point of view, we considered the example of a knife-edge scanning measurement carried out at the dispersive EXAFS beamline ID24 of the ESRF (Hagelstein et al., 1995). The aim of the experiment was to determine the focus width using the Si 111 reflection of a symmetrically cut curved polychromator at a mean photon energy E=7 keV. The source was a secondary source (just downstream from a demagnification mirror), the size of which was evaluated to be between 40 and 45 µm2. The distance to the curved polychromator was about p=30 m and the focal distance was found to be q=0.75 m. The radius of curvature was estimated to be approximately R=5.3 m. The illuminated area on the crystal was about 15 cm. Following the simulation schemes described in the former sections (taking a point source) and using the same parameters as in the ID24 experiment, we first checked whether our simulations would be able to determine a focal distance matching the experimental one. The correctness of the prediction is demonstrated by Fig. 11 showing focal spot distributions evaluated at different distances: clearly, q=0.75 m appears to be the optimal distance to minimise the focus size, in perfect agreement with the experimental findings. The calculated profile, as anticipated, is significantly narrower (Fig. 12): one can state that FWHMexp=2.76 µm, whereas FHWMcalc=1.40 µm. The latter value could be thought of by the experimenter as an ideal target to assess the attained level of mounting accuracy of the setup.
18
All the computations were performed assuming an illuminated crystal area of 300 µm. Much larger areas would not make much sense, since the simulations assume a monochromatic incoming plane wave. The small side peak on the left of the central one (Fig. 12) might be the signature of the intensity spread due to the Johann error (Wang et al., 2010).
Figure 11 Focal spot intensities (a.u.) versus position on the detector, calculated for different qvalues. Used reflection: Si 111 at E=7 KeV; radius of curvature of the crystal R=5.3 m; centred Gaussian window’s FWHM=300 µm on the crystal surface.
19
Figure 12 Experimental (blue curve) and theoretical (black curve) profiles. Used reflection: Si 111 at E=7 keV; radius of curvature of the crystal R=5.3 m; centred Gaussian window’s FWHM of 300 µm on the crystal surface. 6. Conclusion and outlook A general approach to solving numerically the Takagi-Taupin equations (TTE) in their integral representation via FEM, as implemented in the COMSOL Multiphysics package, is presented. This provides a wide flexibility in the numerical solution of dynamical diffraction problems for both perfect and deformed crystals of any arbitrary shape. The solution is computationally efficient and comparable to the classical albeit less flexible and powerful finite difference approach in conventional cases of simplistic geometries, i.e. 2-D Cartesian systems with mostly straight line boundaries. In particular, we have shown the versatility of the FEM computational frame in elucidating a wealth of noteworthy, yet hitherto not utterly explained aspects of the focusing behaviour of cylindrically bent crystals in symmetric Bragg geometry. The outreach of our approach is meant to go far beyond the limited scope of the present work in order to encompass a vast class of numerical problems (not only 2-D but also 3-D) related to solving X-ray and neutron dynamical diffraction problems in Bragg and Laue geometry based on the solution of the TTEs, which can be tackled only numerically. Since FEM is one of the most powerful methods known to successfully address boundary and/or initial value problems described by PDEs and the COMSOL Multiphysics package allows integrating easily user-defined equation systems into 20
its kernel and to show promptly the results thanks to its built-in graphical facilities, it is hoped to disclose end encourage the application of this more general technique among the relevant scientific community. To this purpose, we have devised an open access location of our COMSOL files. They can be freely downloaded from: https://github.com/aripekka/fem-takagi-taupin. Acknowledgment We are greatly indebted to Olivier Mathon (ESRF, Grenoble) for the provision of the experimental data reported in the text.
21
Appendix A: Deformation field According to the conventional elastic theory of thin crystal plates of thickness t (Nesterets & Wilkins, 2006), the deformation field (ux, uz) along (x, z) is given by: ux =
x t (z - ) R 2
,
uz = -
1 2 t [ x +n ( z - ) 2 ] 2R 2
where υ is the Poisson ratio ( u = 0.27 in our calculations). In the case of symmetric Bragg geometry, one obtains h.u =
h 2 [ x +n ( z - t / 2) 2 ] 2R
Note the resulting expression of the deformation term in (11b):
¶(h.u ) ¶(h.u ) ¶(h.u ) h = cos q B sin q B = [n ( z - t / 2)sin q B - x cos q B ] ¶sh ¶x ¶z R
n sin 2 q B - cos 2 q B n sin 2 q B - cos 2 q B ¶ 2 (h.u ) , where d is the interplanar distance of the =h = 2p ¶so ¶sh R Rd 2 considered Bragg reflection. Deformations are considered to be weak when ¶ (h.u ) L2ex