markets, public safety, collective animal behavior, social media, and other group dynamics as measurements ... However, the rules governing the crowd may not be well-designed for all ..... (13) combines the stochastic pricing model with the crowd interaction model where the price ..... For example, apps can be designed to.
A Model of Synchronization for Self-Organized Crowding Behavior Jake J. Xia1 Abstract A general model for synchronized crowding behavior is proposed for understanding and forecasting market instability, drawing similarities from examples such as wildebeests' herding and bridge swaying. Interaction among agents is described as a feedback loop linking individual agent’s decision and observation, with influence of external forces. Agents adapt to environment and switch between two distinctive states, normal and reactive. When in reactive state, agents become more responsive to observation. Transition from normal to reactive state is typically driven by loss-avoiding motivations. After sufficient number of agents switch to reactive state, crowd synchronization happens. An order parameter is introduced in this paper to quantify the level of synchronization. It is shown that crowd synchronization is a function of percentage of agents in reactive state. Further, such behavior is shown to be driven by the most active agents (with the highest volatility). A tipping point is identified when crowd becomes self-amplifying and unstable. By applying this model, financial bubbles, market momentum and volatility patterns are simulated. This model has potentially broader applications in studying financial markets, public safety, collective animal behavior, social media, and other group dynamics as measurements become possible for agents’ states in addition to observations such as prices. KEY WORDS: synchronization, self-organized, crowd dynamics, feedback loop, normal and reactive states, switch, order parameter, tipping point, stability, financial bubbles, momentum, and volatility. Significance Statement Crowding behavior is an important phenomenon in many fields. In financial markets, it is directly affecting the system stability. Everyone wants to understand how crowding behavior is caused and developed. This work is attempting to propose a general theoretical framework which can unify different empirical explanations. Drawing from similarities of several examples in biology and physics such as wildebeests’ herding and London Millennium Bridge swaying, I proposed a common framework to explain crowding behavior in financial markets. This physical model is different from a typical finance research approach. The key difference from this model and many previously proposed models is that no probability distribution is assumed, no specific functional dependence of price over time (such as power law) is needed.
1
Chief Risk Officer and Managing Director of Harvard Management Company, also Research Affiliate at Massachusetts Institute of Technology’s Laboratory for Financial Engineering. Address for correspondence: Harvard Management Company, 600 Atlantic Avenue, Boston MA 02210. This manuscript is a revised version of a working paper of 2006.
1
I.
Introduction
Background Synchronization is a common phenomenon observed in many different fields. Among a large group of self-organized autonomous agents, each member has similar individual goals but the group as a whole has no shared common goal. These groups are sometimes called leaderless but coherent multi-agent systems in social studies, or self-propelled entities and active matters in physics. In this paper, we use the term “self-organized crowd” as a generic description for any groups with no central organization, and call members in a crowd “agents”. Examples of synchronization of self-organized crowd can be found in animal herding, bridgeswaying with a large crowd on top [Strogatz et al 2005], traffic jams, trends in social media, neural stimulation, and financial market bubbles. Often agents in a self-organized crowd can have spontaneous behaviors such that the whole group is unintentionally synchronized. If interaction between agents exceeds a certain level, the crowd can become unstable. Damages to agents can occur in the process. With external intervention or internal attenuation, the crowd can eventually revert back to its normal state with a low level of synchronization. In contrast, organized groups have total objectives, clear definition of roles, order-following rules, and usually have leaders. These groups have enhanced power compared with each individual’s capabilities, as they typically aim to maximize the total outcome while rendering individual objectives secondary. The goal of this paper, however, is not to debate the pros and cons of organizations. Instead, this paper will focus on studying self-organized crowding behavior. Agents in a self-organized crowd (e.g. in many capitalist markets) are governed by individual objectives and some basic rules. In normal circumstances, each agent usually does not have complete information, but tries to make rational decisions. Such system is normally efficient and balanced. Each individual tries to optimize for self-interests, which usually leads to a positive outcome for the group. However, the rules governing the crowd may not be well-designed for all circumstances. During panicking situations and if information is not available, agents may revert to instinctive reactions. They are affected by each other’s sentiment, and the natural tendency is to believe the majority is right. Animal spirits (such as greed and fear) can overtake agents’ rational thinking. Agents’ decisions become reflective to their surroundings. When in danger, survival instincts trump all other considerations. This situation forces most agents to adapt to the environment and be short-term focused. As a result, the group outcome will become sub-optimal. In the worst case, a crisis may happen. In daily life, many systems are designed by assuming a low synchronization of the crowd. For example, banks operate on the basis assuming not all depositors will take money out at the same time. If the crowd is synchronized, bank-run happens and poor liquidity can lead to bankruptcy. Insurance companies operate under similar assumptions. Another example is that our road system is designed by assuming only a small percentage of all cars will drive at the same section of roads at the same time. If the crowd is synchronized, a traffic jam happens. Such diversification or low synchronization is an important assumption in many social systems. Therefore, detecting signs of possible synchronization is critical to avoid system-overload.
2
The objective of modeling self-organized crowd is to better understand the interaction between agents and vulnerability of the crowd, so that we can monitor the stability of a crowd. This is a difficult problem to solve as behaviors of live agents are hard to predict. One has to deal with uncertainties due to high level of complexity and reflexivity, and lack of information of each individual. At group level, some behavioral patterns are more universal and stable. When certain conditions are met, an eventual outcome can be forecasted, though predicting the exact timing is still not possible. Review Crowd behavior was first studied in psychology and sociology. For example, Sigmund Freud in his paper “Group Psychology and Analysis of the Ego” highlighted people’s inability to resist emotional contagion in a group. Crowd provides a momentary release of otherwise repressed impulses confined within individuals. Psychologist William McDougall particularly studied selforganized crowd behaviors. He stated that the greater the number of people can be observed with the same emotion, the greater the contagion. Perhaps the most cited work was by Gustave Le Bon in his 1896 book "The Crowd, a study of the popular mind” [Le Bon 1896]. Unconscious action or mania of crowd is due to psychology. For the need of social belonging, people give up their own rational thinking to the crowd thinking. Crowd has a transitory collective mind, as coupling among the crowd converge members to one idea. Losing conscious personality or diversity causes high correlation [Hebb 1949]. On the other hand, the wisdom of the crowds is also used as a better predictor in many statistical measurements, under certain limitations [Lorenz et al 2011]. In biology, collective animal behavior such as bird flocking, insect swarming, fish shoaling or schooling, and animal herding have long been observed and studied. At micro level with bacteria or neurons, similar emergent behavior arises from simple rules that are followed by elements without central coordination. In physics, self-propelled entities or active matters are studied by many researchers [Vicsek et al 1995]. In physical systems, particles are coupled at the micro level. Macro behavior emerge from the micro-level interactions. While in social systems, agents are more likely coupled through the macro properties. Crowd study has also been more active in public safety and traffic planning in recent years. Computer simulations are applied to these complex systems. Bubbles in financial markets are reoccurring phenomena which attracted many researchers’ attention [Campbell et al 1997, Focardi & Fabozzi 2014, Barberis et al 2016], especially after the global financial crisis in 2008. Herd behavior has been studied more in economics and financial markets [Scharfstein & Stein 1990, Shiller 2000, Shleifer 2000, Lo 2005]. Statistical methods are usually used to detect patterns displayed in historical data. Many big data projects apply regression or machine-learning techniques. Price change over time is fit with various distributions. Quantitative models are also used to predict these patterns [Gabaix et al 2003]. For example, Log-Periodic Power Law Singularity (LPPLS) model [Sornette 2002] simulates financial bubbles by studying the time dependence of price, where a hazard rate is linked to a critical time that describes the likely timing of bubble bursting.
3
In many statistical studies, causal relationships are not easily established. Lack of fundamental understanding can lead to incorrect predictions as false patterns are not distinguished. As lessons learned in weather forecasting, it is important to understand the local interactions [Silver 2012]. Agent-based model attempts to capture the causal relationships in financial markets [Farmer 2002, Bouchaud 2010, Helbing & Balietti 2011]. Schematic diagrams are used to track the exact details of inter-linkage between different players in a specific ecosystem. Outcome under different initial and boundary conditions can be simulated. Such results are practically useful but hard to generalize, as they depend on the specifics of agents’ roles and market microstructure. A generic model is needed to capture the common behavior of self-organized crowds in different applications. Instead of modeling all the specific relationships between the agents, we need to capture the fundamental and universal nature in all self-organized crowds. A theoretical framework is needed to unify various work done in different fields. Cross-disciplinary comparison can deepen our understanding of a specific problem. Once a general framework is established, new directions of possible applications can be explored. With that in mind, I attempted to propose in this paper an intuitive model which builds on top of previous work in various fields, with a specific application for financial markets. Is it ever possible to predict, and possibly influence, the behavior of the crowds that represent the financial markets? Can we quantify the level of fragility of markets (not timing of bubble bursting which depends on specific triggers)? How does each agent’s behavior affect the overall condition? Traditionally, market observations such as time series of prices and covariance are the main measurements used because they are readily available. Going forward, can we collect specific information of market participants to better understand their decision-making process? How are market participants’ mindsets affected by their observations? The model presented in this paper is motivated by these questions and intended to bring these ideas in an investment management context.
II.
The Crowd Interaction Model
As discussed earlier, a self-organized crowd has a number of agents who have similar individual goals and constraints to survive and gain (take risk and reward). Agents use historical experience to adapt and extrapolate when making decisions. Their action is determined by observations, external forces, and their own conditions. An agent’s tendency of getting ahead of others for survival drives the response function of the agent. The crowd problem here is defined as N agents interacting with continuous dynamics in an environment where external forces and observations of agents’ own actions change over time. From the first principle, the basic dynamic equation is that an agent’s action (to buy or sell) is determined by external news which he cannot influence and observations which are influenced by his and others’ actions. The result of such interaction is that the agents become indirectly coupled via observations.
4
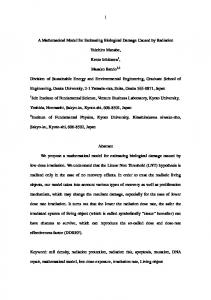
Figure 1. Interaction Loop of Agent, Observation and External Force multiplier
external force
E
multiplier
C
agent’s action
A
observation
O
S B multiplier
Figure 1 describes the interaction of agents, observation, and external force, which looks similar to the feedback loop in electronic circuits. There are three dynamic quantities in this model: S, O and E. S is the action (to buy or sell) of an agent. Later we will use Si to denote action of agent i, use S without subscript to denote the aggregated actions of all agents. O is the macro observation that agents see and influence locally. E is the total external force which is not affected by the agent’s decision. These three quantities S, O and E are connected through three response coefficients, A, B and C. A is the sensitivity of observation O to agent’s action Si. B is the sensitivity of agent’s action Si to observation O. C is the sensitivity of agent’s action Si to external force E. In a linear interaction model, A, B, and C are the multiplying constants which determine the amount of impact. In general, these can be any mathematical operators A, B, and C on S, O, and E. They can be non-linear and time-dependent. As we discuss later in different applications, A, B, and C can indeed take different forms operating on S, O, and E. Note that S is determined by E and O, and O is determined by S. In previous work [Vicsek et al 1995, Helbing et al 2011], interaction was specifically modeled depending on the physical distance. Close neighbor’s actions are affecting O and S more than other agents. Here O is generalized to include both local observation influenced by nearby agents and overall observation all agents can see and influence. For example, on a swaying bridge, pedestrians are influenced by the total sway of the bridge as well as the immediate neighbors’ behaviors. It is important to point out that the linkage in many self-organized crowds does not depend on physical distance. For example, in financial markets, all participants can observe and influence prices of the whole market, thanks to modern communication technology. Neighbors’ actions are actually less important. dS and dO denote the incremental changes of S and O at a particular time interval t to t+dt. We assume each individual agent i’s incremental decision dSi has different sensitivity or reaction functions Ci and Bi to dE and dO respectively. For simplicity, we further assume A is the same
5
for all agents, i.e. effect on observation is the same for all agents per unit of action. This is a reasonable assumption, though later results do not depend on it. For example, every $ purchase of a stock has the same effect on the price. Additional details can be modeled when special agents’ (e.g. leaders’) effect needs to be differentiated. Here we simply treat a larger agent as having a bigger number of agent units. N is total number of unit agents in the crowd. From the flow chart in Figure 1, basic mathematical relationships of the model can be described below. 𝑑𝑑𝑑𝑑𝑖𝑖 = 𝐶𝐶𝑖𝑖 𝑑𝑑𝑑𝑑 + 𝐵𝐵𝑖𝑖 𝑑𝑑𝑑𝑑 + 𝜀𝜀𝑖𝑖
(1)
𝑑𝑑𝑑𝑑𝑖𝑖 = 𝐶𝐶𝑖𝑖 𝑑𝑑𝑑𝑑 + 𝐵𝐵𝑖𝑖 𝑑𝑑𝑑𝑑
(1’)
𝑑𝑑𝑑𝑑 = 𝐴𝐴 ∑𝑵𝑵 𝒊𝒊=𝟏𝟏 𝑑𝑑𝑑𝑑𝑖𝑖 = 𝐴𝐴 𝑑𝑑𝑑𝑑
(2)
𝐶𝐶 = ∑𝑵𝑵 𝒊𝒊=𝟏𝟏 𝐶𝐶𝑖𝑖
(4)
In equation (1), 𝜀𝜀𝑖𝑖 is a random noise, describing other random decisions by the agents which are not determined by dE or dO. For simplicity, in later discussion, we often assume the impact of 𝜀𝜀𝑖𝑖 is small compared with the first two terms and drop 𝜀𝜀𝑖𝑖 in modified equation (1’). However, the random noise 𝜀𝜀𝑖𝑖 is important when correlation between agents and synchronization are considered.
Equation (1’) is the basic interacting dynamics that each agent makes an individual decision based on the external force and observation. We also assume that agents’ actions are additive,
𝑵𝑵 𝑵𝑵 𝑑𝑑𝑑𝑑 = ∑𝑵𝑵 𝒊𝒊=𝟏𝟏 𝑑𝑑𝑑𝑑𝑖𝑖 = �∑𝒊𝒊=𝟏𝟏 𝑑𝑑𝑑𝑑𝑖𝑖 � 𝑑𝑑𝑑𝑑 + �∑𝒊𝒊=𝟏𝟏 𝑑𝑑𝑑𝑑𝑖𝑖 � 𝑑𝑑𝑑𝑑 = 𝐶𝐶 𝑑𝑑𝑑𝑑 + 𝐵𝐵 𝑑𝑑𝑑𝑑
𝐵𝐵 = ∑𝑵𝑵 𝒊𝒊=𝟏𝟏 𝐵𝐵𝑖𝑖
(3)
(5)
No specific forms of A, B, and C need to be pre-assumed. They are not always constants. Intuitively, agents’ actions have the same directional impact on observation, i.e. A>0. Agents usually have a positive aggregated response to external forces, i.e. C>0. Agents’ responses to observation can vary, where B can be positive, 0 or negative, depends on agents’ aggregated behavior at a particular time. For example, crowd can be inhomogeneous, i.e. dSi is responding differently depends on the position in the crowd. S and O are functions of location and time. Bi and Ci are different for different agents. Heterogeneity is usually important in understanding crowd synchronizations. For example, in agent-based models, specific linkages between agents need to be modeled to understand the channels of propagation of market stresses. Some agents may receive additional info of E and O than others. Heterogeneity and randomness also in principle tend to prevent homogeneity and synchronization. In modern financial markets, however, as price observation becomes available to everyone in almost real time, a typical feedback loop between agents’ action and observation captures the important macro features of markets. This is similar to mean field theory or effective
6
medium theory in physics such as Curie-Weiss theory of magnetism. Macro properties are captured in these models. The entire system can be simplified to a single feedback loop. For an organized group, there are usually leaders and organizational rules. A, B, and C are predecided (typically from top down) to coordinate and achieve goals for the whole group. Selforganized crowd can adapt to changes by varying B and C over time under different conditions. Special Case of Instantaneous Response If the crowd system has zero response time, i.e. the agent can observe its own action instantaneously, we can combine equations (2) and (3) and get 𝐴𝐴𝐴𝐴
𝑑𝑑𝑑𝑑 = 1−𝐴𝐴𝐴𝐴 𝑑𝑑𝑑𝑑
(6)
Under normal conditions, feedback coefficient AB0 and AB>0, the crowd displays a momentum behavior. As long as the external force persists in the same direction or is small comparing with observation, the observed behavior will trend in the same direction. If B=0 and hence AB=0, there is no endogenous reaction, observation simply responds to exogenous signals. If B1, dO can grow exponentially. Examples For a herd of wildebeests, S is the decision to run that determines running speed. O is the average running speed of the group. E is the signal of predators’ approaching. Not all wildebeests can sight the lions, hence they also watch others’ reaction. When startled, they all run. If B increases value and AB is larger than 1, without lion’s attack, the whole herd can self-stimulate and run faster and faster. For the sway of London Millennium Bridge [Strogatz et al 2005], S is pedestrian’s timing of gait that determines the phase difference with bridge sway. O is the magnitude and phase of sway. E is wind or other factors affecting pedestrians. When the sway is strong enough, pedestrians are forced to balance themselves by stepping in sync with the sway, which in turn causes bigger sway. Such sway can be self-induced when AB is greater than 1. In social media, S is people’s decision to join a popular behavior that determines the amount and bias of opinion to post. O is the observed posts. E is the news from outside the social group. When large enough of your “friends” joined a popular movement, you either join them or be left out and become less popular. Your action to join further inflates the popularity. For financial markets, S is people’s decision to buy or sell that determines the amount of transactions. O is the price. E is the news. When Bi0, the player is a momentum follower. When market crashes, investors are forced to cut losses as their financial freedom is threatened. When bubble keeps expanding, fund managers are forced to follow the hypes, otherwise their career is at risk. There are some similarities between this interactive model and the Hamiltonian function of the Ising model in physics. Aggregated response (or energy) of a lattice of magnetic dipole moments of atomic spins (which can be up or down, +1 or -1) is determined by the coupling of adjacent sites and response to external magnetic fields. Our crowd model describes the interaction of price and external news. If the random noise is included, Equation (9) can be rewritten in a more general form using equation (1), 𝑑𝑑𝑑𝑑(𝑡𝑡 + 𝑑𝑑𝑑𝑑) = 𝐴𝐴𝐴𝐴𝐴𝐴𝐴𝐴(𝑡𝑡) + 𝐴𝐴𝐴𝐴𝐴𝐴𝐴𝐴(𝑡𝑡) + 𝐴𝐴𝐴𝐴
(11)
𝐴𝐴𝐴𝐴 = µ 𝑑𝑑𝑑𝑑 + 𝜎𝜎 𝑑𝑑𝑑𝑑
(12)
Where ε is the sum of all 𝜀𝜀𝑖𝑖 ‘s. 𝐴𝐴𝐴𝐴 is a stochastic process that can be modeled as a Wiener process,
Where µ is a drift rate parameter, Z is a standard Wiener process or Brownian motion, typically assumed as normal distribution, and σ is the standard deviation or volatility of the time series. Equation (11) becomes
8
𝑑𝑑𝑑𝑑(𝑡𝑡 + 𝑑𝑑𝑑𝑑) = 𝐴𝐴𝐴𝐴𝐴𝐴𝐴𝐴(𝑡𝑡) + 𝐴𝐴𝐴𝐴𝐴𝐴𝐴𝐴(𝑡𝑡) + µ 𝑑𝑑𝑑𝑑 + 𝜎𝜎 𝑑𝑑𝑑𝑑
(13)
O(t+dt) not only depends on the starting point O(t), but also the history of O(t) before t. Equation (13) combines the stochastic pricing model with the crowd interaction model where the price change depends on the previously change and external news. Equation (11) describes essentially a first-order autoregressive time series, characterized by a momentum behavior. The crowd model presented here also provides an intuitive explanation of stochastic volatility as described in ARCH/GARCH models [Engle 2001].
III.
Two States of Coupling
With the framework presented in previous section, we next model the coupling coefficients B and C in equation (9), where we will focus on understanding the how B change with O. Here we introduce an important hypothesis that agents in a crowd switch in between two distinctive states, normal and reactive. In reactive state, coupling coefficients Bi and Ci increase values. Total B and C also increase. In following discussion, we focus on the feedback coefficient Bi of observation. Similar analysis can be applied to the responding coefficient Ci to external forces. The two-state hypothesis is easy to understand as the underlying drivers are linked with survival instincts. For example, when sensing danger animals switch to reactive state and run for their life. In financial markets, when pain thresholds are reached, investors abandon rational strategies and switch to react. For example, when loss exceeds a significant portion of an investor’s wealth, especially when leverage is used, the investor will be forced to sell when market is going down further. When a bubble is expanding, investors will also be forced to buy to stay with peers to protect their jobs. This is another form of stopping out, but on relative basis to peers. Everyone has a limit of loss tolerance. Evolution selected ones with strong survival bias. In normal state, agents pursue different strategies and different time horizons. For example, in financial markets, value investors act like contrarians and hold for longer time than the momentum traders. Balance between various strategies ensures price stability. Higher leverage makes coupling responses stronger. Margin calls or peer pressure can force players to capitulate and focus on short-term survival. The dual-mode of behavior has deeper psychological roots, as discussed in the work of Kahneman, D. [Kahneman 2013]. People have two distinctive thinking modes: slow and fast. In “normal” state, people take time and apply logical thinking. In “reactive” state, people use experience quickly to extrapolate decisions. In a brain, prefrontal cortex is responsible for slow, complex and logical analysis, while limbic system is for fast, simple and intuitive evaluation, and emotional reactions. Under different conditions, decisions are made by different parts of the brain. The two-state assumption is also very similar to the Ising model in physics.
9
Figure 2a illustrates the dynamic process when an agent gets close to his pain thresholds. The increased response is shown in a steeper slope of S vs O. B is no longer a constant, it becomes nonlinear and dependent to levels of O and the change dO. Such increased responses exist on both downside and upside of market moves. The reaction decreases after stop-loss levels are cleared. It stabilizes in these hysteresis loops. Figure 2a. Agent’s reaction to observation increases if close to loss threshold
S B=dS/dO Reactive State
Normal State
BL
BH O N
Exact conditions under which an agent switches states depend on the agent’s specific situation. Estimation of probability of switch is possible by monitoring the agent’s emotional reactions Data can be collected via Twitter, Facebook, social media posting, and questionnaire etc, [Azar & Lo 2016]. In general, the closer an agent is to his pain threshold (in O) and the bigger change of observation (dO), the more likely the agent will switch to reactive state. The focus of this paper is not to study the conditions under which each agent switch states, rather to model the overall impact of such switches. When in normal state, Bi takes a set of lower values of {BL}, indicating low coupling. The set of values {BL} are usually around zero. When in reactive state, Bi takes a higher set of values of {BH}, indicating high coupling and agents will try to follow the change in environment when in reactive state. The set of values {BH} are always positive and greater than {BL}. Number of agents in reactive state NH, and number of agents in normal state NL depend on changes of external force E(t) and observation O(t). NH+NL=N. In simulated results later in this paper, NH is assumed to be simply proportional to magnitude of dO. Equation (5) shows that total net feedback parameter B is the sum of all the individual agent’s feedback coefficients Bi. Bi has two sets of values: low coupling {BL} with NL number of agents and high coupling {BH} with NH number of agents. Let BH be the average of all {BH} and BL be the average of all {BL}. Hence, 𝑁𝑁
𝐵𝐵
𝐻𝐻 𝐻𝐻 𝐵𝐵 = ∑𝑵𝑵 𝒊𝒊=𝟏𝟏 𝐵𝐵𝑖𝑖 = 𝑁𝑁𝐻𝐻 𝐵𝐵𝐻𝐻 + 𝑁𝑁𝐿𝐿 𝐵𝐵𝐿𝐿 = 𝑁𝑁𝐻𝐻 (𝐵𝐵𝐻𝐻 − 𝐵𝐵𝐿𝐿 ) + 𝑁𝑁𝑁𝑁𝐿𝐿 = 𝑁𝑁𝑁𝑁𝐿𝐿 [ 𝑁𝑁 ( 𝐵𝐵 − 1) + 1] 𝐿𝐿
(14)
10
Equation (14) shows that B is a linear function of NH/N or percentage of agents in reactive state. B is also proportional to the size of the crowd N and magnitude of BH. BH>0. Typically BL