Exploring the relationship between technological improvement and innovation diffusion: An empirical test
JongRoul Wooa, and Christopher L. Mageea,b
a
Institute for Data, Systems, and Society, Massachusetts Institute of Technology, 77 Massachusetts
Avenue, Cambridge, MA 02139-4307, United States
b
SUTD-MIT International Design Center, Massachusetts Institute of Technology, 77 Massachusetts
Avenue, Cambridge, MA 02139-4307, United States
Corresponding author. E-mail:
[email protected]; Tel.: +1-617-386-3392 1
Abstract It is now clear that different technological domains have significantly different rates of performance improvement. Theoretically, such differing rates should influence the relative rate of diffusion of the products since improvement in performance during the diffusion process increases the desirability of the product diffusing. However, there has not been a broad empirical attempt to examine this effect and to explain the underlying cause. Therefore, this paper reviews the theoretical basis and focuses upon empirical tests of this effect and its underlying cause. The results for 18 different diffusing products show the expected relationship-faster diffusion for more rapidly improving products- between technological improvement and diffusion with strong statistical significance. The empirical examination also demonstrates that performance improvement does not slow down in the latter parts of diffusion when penetration does slow down. This finding is also consistent with theories of diffusion based upon utility but not with ideas that explain performance increases as due to competition among firms.
Keywords: Innovation diffusion; Technology adoption; Technological improvement; Empirical test Classification codes: O31; O33
2
1. Introduction It is widely accepted that technological change is a major source of economic growth (Romer, 1990; Solow, 1957). Although invention and innovation are essential aspects of technological change, diffusion is critical to economic or social impact since innovations must spread across their potential markets over time to have such impact. Because of this importance of the diffusion process in technological change, there have been many technological change studies geared toward understanding diffusion. First, it has been observed that the diffusion pattern of successful innovations over time generally follows an S-curve, but diffusion rates at similar phases of the process vary considerably for different innovations (Geroski, 2000; Hall, 2005). Other studies have identified the factors affecting diffusion rates and variation in the diffusion rates for different innovations. Most of these studies have taken a static view of diffusing innovations and emphasized the effects of economic and social environment factors on diffusion rates (e.g., Griliches, 1957; Mansfield, 1961; Rogers, 1995). Griliches (1957) and Mansfield (1961) in particular have argued theoretically and found empirical support that innovations with higher profitability or user utility spread faster in their potential markets. Meanwhile, it is well established that the performance of all technological domains that have been measured increase exponentially over time by different rates (Magee et al., 2016). Whether and how these different rates affect diffusion of related innovations has not been analyzed in any depth. Intuitively, one might speculate that such differing rates could influence the relative rate of diffusion since higher performance increases the desirability of the innovation diffusing. Thus, an initial diffusion rate would be more strongly accelerated for an innovation that improves more rapidly if diffusion depends upon profitability or utility as determined by Griliches (1957) and Mansfield (1961). However, most empirical studies that have explored the factors affecting diffusion rates have assumed that
3
diffusing innovations are constant over time. Thus, there is little empirical evidence to clarify the relationship of technological improvement with innovation diffusion rates. Therefore, several important questions remain: 1) What is theoretically expected of the relationship between technological improvement and diffusion? 2) How can the relationship be explained theoretically? 3) Can we empirically test the relationship between technological improvement and diffusion? This study answers these research questions by reviewing the theoretical basis and empirically testing the relationship between technological improvement and diffusion. Therefore, we attempt to simultaneously advance the theoretical and the empirical foundations. The remainder of this paper is organized as follows. Section 2 describes our theoretical framework and develops the hypotheses to be tested. Section 3 presents the data and methods used in this study. Section 4 presents empirical results on the relationship of technological improvement and innovation diffusion. Section 5 interprets the results and discusses their implications. Section 6 provides conclusions.
2. Theory and hypotheses Innovative products are designed to perform specific functions based on related technological domains and are then released into the market. For example, the automobile is a transportation artifact based on the internal combustion engine as a key technology, and the mobile phone is a communication device based on wireless telecommunication technology as a key technology . It is well known that the adoption of new products over time follows an S-curve and diffusion rates vary across products (Geroski, 2000; Hall, 2005). There are two theoretical frameworks for modeling the S-curve of diffusion. First, the most widely used model is based on epidemic theories,
4
which assume that consumers have the same taste and that the new product is constant over time (Mansfield, 1961; Griliches, 1957). In this model, people adopt the new product through the influence of existing adopters. As time passes, more and more consumers adopt the product, leading to an increase in the diffusion rate; but as the market becomes saturated, the diffusion rate decreases again. Second, an alternative model assumes that consumers’ tastes follow a normal distribution and the performance and cost of new product changes over time (Davies, 1979; Geroski, 2000). This model assumes that consumers adopt the new product when their utility for this product exceeds their threshold level. Each of these theoretical frameworks reinforces the S-curve of the diffusion process and essentially accounts for the decreasing rate (or second part of the S) by market saturation. Most empirical studies, however, explain variation in the diffusion rates for different products based on the former theoretical framework (e.g., Bayus, 1992; Clark et al., 1984; Fisher and Pry, 1971; Griliches, 1957; Mansfield, 1961; 1989; Olshavsky, 1980). They have found empirical support for diffusion rates to vary by different prices or investments, user utility or profitability, and the potential market environment of products. For example, Mansfield (1961) explains differences in diffusion rates across industry products using a simple linear model composed of profitability, investment, and variables related to industry environment. Although the effect of improvement in technological performance during the diffusion process on the diffusion rate have been overlooked in previous empirical studies, the theoretical frameworks suggest that accounting for technological improvement during the diffusion process would have an effect. The diffusion of new products in the potential market follows the S-curve described above, whereas the improvement of a technological domain of a product over time is known to increase exponentially, as shown in the following equation (1), and the rate of technological improvement varies
5
across technological domains (Moore, 1965; Sahal, 1979; Koh and Magee, 2006; 2008; Magee et al., 2016).
𝑃𝑖 (𝑡) = 𝑃𝑖 (𝑡0 )exp(𝑘𝑖 (𝑡 − 𝑡0 )) (1)
Where 𝑃𝑖 (𝑡) and 𝑃𝑖 (𝑡0 ) represent technological performance at time t and at a reference time 𝑡0 , respectively, for technological domain i, the exponential constant 𝑘𝑖 denotes the relative change of performance per year and can be referred to as the technological improvement rate. Since performance is usually measured by output divided by cost (or price), the utility or attractiveness of the product to all consumers is increased over time in accordance with equation (1). As such, technological improvements are largely time-based, and the diffusion of a product will be affected by the improvement rate of its core technological domain. This can be gleaned through increasing performance trends (quality adjusted price) of the computer and microprocessor, as reported by Stoneman and Toivanen (1997), but empirical evidence concerning the effect of increased performance across a set of products is currently lacking. Thus, in this study we present a Poisson regression model to conduct an empirical test for the theoretically expected relationship of diffusion rates with technological improvement by extending Mansfield (1961)’s test model as the following equation (2). We use the Poisson regression approach in this study because our dependent variable 𝑇𝑖 is a type of count data and takes only nonnegative integer values (Cameron and Trivedi, 2013).
𝑇𝑖 = f (𝑁𝑖 , 𝐶𝑖 ,
d ln 𝑃𝑖 (𝑡) dt
d ln 𝑃𝑖 (𝑡)
) = exp (𝑚 + 𝛼𝑁𝑖 + 𝛽𝐶𝑖 + 𝛾 (
6
dt
)) = exp(𝑚 + 𝛼𝑁𝑖 + 𝛽𝐶𝑖 + 𝛾𝑘𝑖 ) (2)
Where 𝑇𝑖 represents the time it takes to go from one penetration level to another. That is, it indicates the diffusion time of product i. 𝑁𝑖 is a dummy variable indicating a type of market where product i spreads (households or another market). 𝐶𝑖 represents the price level of product i. Lastly, 𝑘𝑖 is the improvement rate of the product’s core technological domain. Based on the above theoretical discussion and the test model, our first hypothesis suggests the relationship of technological improvement with diffusion rates as follows:
Hypothesis H1. New products that are based on faster-improving technological domains are spread more rapidly in potential markets (i.e., in the test model, 𝛾 < 0; new product diffusion time 𝑇𝑖 is expected to decrease with their core technological improvement rates 𝑘𝑖 ).
Some recent studies in technological progress argue that key technical characteristics of technological domains determine the rates of technological improvement, rather than contextual reasons such as investment in research and development (R&D) and organizational aspects (Basnet and Magee, 2016; Benson and Magee, 2015). If we extend this to the theoretical frameworks of the diffusion process described above, we see that the differences in improvement rates of technological domains give different intensity stimuli to demand for related new products, because technological domains have different improvement rates according to their fundamental technical differences. There are also theoretical studies that discuss the diffusion process through the interaction of supply and demand factors, and these studies suggest another path for how incremental technological improvements might come about and affect the diffusion process (Agarwal and Bayus, 2002; Metcalfe 1981; Stoneman and Ireland, 1983). Agarwal and Bayus (2002) in particular show that firm entry into a new market is more powerfully correlated than price reductions to sales takeoff of consumer and
7
industrial products. They interpret this result that as a new product is first released into the potential market, it usually takes a primitive form and the demand for it is low; but as firms enter the new market in the diffusion process, non-price competition among firms such as R&D directed towards technological improvements intensifies, which causes firms to launch new products with improved technologies to differentiate themselves, which subsequently increases the demand. This is consistent with our hypothesis H1, in that it emphasizes the significant influence of technological improvement on demand growth at the initial stage of diffusion process. However, this differs from the above-mentioned theoretical framework in that the non-price competition is a major driver of technological improvement rather than technical characteristics of the domain. Based on the discussion so far, an empirical test to determine which of these two theoretical possibilities can better explain the relationship presented in hypothesis H1 is set up by hypothesis H2. According to the latter theoretical framework, technological performance improves rapidly due to intense non-price competition among firms in the initial stage of the diffusion process, then in the later stage of diffusion process, the technological performance improvement pace is reduced as the competition relaxes, but if the rate of technological improvement is determined by the technical characteristics of the technology domain as suggested in the former theoretical framework, then technological improvement will continue to increase regardless of the competitive dynamics in the diffusion process. Therefore, hypothesis H2 is set as follows:
Hypothesis H2. In the early stage of the diffusion process, the technological performance increases at a faster rate, but the rate of technological improvement decreases in the later stage of the diffusion process.
8
3. Data and methods 3.1. Innovation diffusion 3.1.1. Defining and measuring diffusion rate Previous diffusion studies indicate that innovation diffusion follows a S-curve function over time such as the logistic function and define diffusion rate with using speed and penetration ceiling parameters of this function (e.g., Griliches, 1957; Mansfield, 1961; 1989; Olshavsky, 1980). This definition and measure of diffusion rate has been widely used in previous studies, but there are a number of problems which can increase the statistical noise greatly in our empirical test of the relationship between technological improvement rates and diffusion rates. First, this measure of diffusion rate can only assess an average diffusion speed of the entire diffusion process, so such a measure cannot examine changes in diffusion speed over time. Moreover, to use the parameters of logistic function as a comparable measure of diffusion rate, it is necessary to reliably estimate these parameters. However, if there is insufficient data for the entire diffusion process, or if the diffusion data deviate somewhat from the logistic function, the parameters cannot be estimated reliably. In addition, the speed parameter is associated with diffusion speed in reaching the penetration ceiling (which is hard to objectively determine), so if the level of ceiling among innovations is different, it is difficult to say that the diffusion rate is measured on the same basis. Therefore, this study more simply characterizes diffusion rate as the time it takes to go from one penetration level to a higher level. When we use this kind of measure for diffusion rate, we do not need to estimate speed and penetration ceiling parameters of the logistic model and can avoid over-restrictive parametric specification. Moreover, the diffusion rate can be defined according to the penetration interval. In this study, we use the time it takes to go from 0% (market entry) to 10% as the diffusion rate of early stage and the time from 10% to 30% and the time from 30% to 50% as the diffusion rate of later
9
stages.
3.1.2. Diffusion rate data In this study, we collect United States penetration or adoption data for 18 innovative products from various sources. The data include products launched on the market from the early 1900s to the late 1990s. Sixteen of these are products spreading to households, 1 is a product spreading to farms and 2 are products spreading to hospitals; all of which reached penetration or adoption level of more than 50%. The diffusion rate of these products is measured in terms of the time (years) required to reach 10% penetration from the market entry, from 10% to 30%, and from 30% to 50% according to the definition of diffusion rate described above. The diffusion data used in this study are summarized in Table 1.
Table 1. Summary of diffusion data No. Product
1.
Automobile
2.
Washing Machine
3.
Refrigerator
4.
Home Air Conditioning
5.
Dishwasher
6.
Clothes Dryer
7. 8. 9.
Videotape Recorder Personal Computer Laptop
Measure % of Households % of Households % of Households % of Households % of Households % of Households % of Households % of Households % of Households
Time from A to B (years)
Year of Market Entry
Source
0→ 10%
10→ 30%
30→ 50%
1898
17
6
5
Cox and Alm (1997)
1904
26
26
9
Cox and Alm (1997)
1918
13
6
5
Cox and Alm (1997)
1929
28
12
5
Cox and Alm (1997)
1912
50
10
25
Cox and Alm (1997)
1936
19
11
7
Cox and Alm (1997)
1965
19
3
2
Euromonitor (2017)
1975
11
10
4
Euromonitor (2017)
1981
19
6
4
Euromonitor (2017)
10
10. 11. 12. 13. 14. 15.
% of Households % of CD Player Households % of Internet Households % of Digital Camera Households % of Tablet Households DVD % of Player/Recorder Households Mobile Phone
1983
11
4
3
Euromonitor (2017)
1983
6
4
2
Euromonitor (2017)
1989
6
4
2
Euromonitor (2017)
1990
11
3
2
Miranda and Lima (2013)
1994
8
5
5
Euromonitor (2017)
1997
3
2
2
Euromonitor (2017)
16.
Tractor
% of Farms 1903
25
16
7
17.
Computerized Tomography (CT) scan
% of Hospitals
1973
4
6
5
18.
Magnetic Resonance Imaging (MRI)
% of Hospitals
1980
9
6
9
Olmstead and Rhode (2000) Hillman and Schwartz (1985), Comin and Hobijn (2009), OECD (2017) Comin and Hobijn (2009), OECD (2017)
3.2. Technological improvement 3.2.1. Defining and measuring technological improvement rate Products perform a specific generic function based on a technological domain which is a particular, recognizable body of scientific knowledge (Magee et al., 2016). In this study, we define metrics of the generic functions for core technological domains of products which have the factors affecting adoption decision of products (Koh and Magee, 2006; 2008; Benson and Magee, 2015; Magee et al., 2016), in order to assess the rate of technological improvement related to new product diffusion. We assume that such technological performance metrics follow the exponential function over time as equation (1). Previous studies have empirically confirmed that the exponential relationship between technological performance and time and that the percentage change of performance per year is 11
constant (Moore, 1965; Sahal, 1979; Koh and Magee, 2006; 2008; Benson and Magee, 2015; Magee et al., 2016), that is consistent with the most widely assumed mechanism of invention-combinatorial progress (Basnet and Magee, 2016; Youn et al, 2014). Thus, this study defines the exponential constant ki (i.e. relative change per year) of equation (1) as the technological improvement rate.
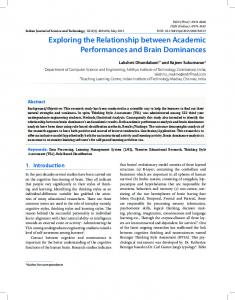
3.2.2. Technological improvement rate data We define performance metrics for core technological domains of products included in our diffusion data and collect the performance data from Magee et al. (2016). Magee et al. (2016) present performance trend data in 71 metrics for the 28 technoloigcal domains collected from a variety of sources. The performance data and the method used to collect the data is described in detail in Magee et al. (2016). The technological performance data matched with diffusing products are summarized in Table 2; two examples of
technological performance over time are plotted in Figure 1.
Table 2. Technological performance data Product
Core Technological Domain
Metric
1.Automobile
Piston Engine
W/kg
2.Washing Machine, 3.Refrigerator, 4.Home Air Conditioning, 5.Dishwasher, 6.Clothes Dryer
Electrical Motor
W/kg
7.Videotape Recorder
Data range 18961971
Improvement rate k (%) 5.09
18811993
2.93
Magnetic Information Storage Mbits/cc
19522004
23.76
8.Personal Computer, 9.Laptop, 14.Tablet
Microprocessor
#/die
19722006
36.33
10.Mobile Phone
Wireless Telecommunication
Kbps
11.CD Player, Optical Information Storage 15.DVD Player/Recorder 12
Mbits/cc
19462009 19812004
25.99 27.15
12.Internet
Electrical Telecommunication (Internet Backbone)
Kbps
13.Digital Camera
Camera Sensitivity
mV/micron2
16.Tractor
Tractor Engine
17. CT
CT scan
18. MRI
MRI
HPhr/gallon 1/resolution ·scantime 1/resolution ·scantime
19652004 19872008 19201964 19712006 19802006
35.93 15.56 2.77 36.72 45.74
Source: Magee et al. (2016)
Figure 1. Technological performance (log) over time
4. Analysis results 4.1. Correlation analysis First, to examine the relationship between technological improvement and diffusion and to test hypothesis H1, we analyze the correlation between product diffusion rate and technological improvement rate and graph the scatter plots between them. The correlation analysis results are shown in Table 3 and the scatter plots are shown in Figure 2. 13
Table 3. Correlation analysis results Mean
SD
Min
Max
Improve ment rate k
Improvement 20.53 15.60 2.77 45.74 1 rate k Time from 0 15.58 11.42 3 50 -0.6563** to 10% Time from 10 7.78 5.86 2 26 -0.5293* to 30% Time from 10 13.50 9.34 4 35 -0.5401* to 50% Time from 30 5.72 5.32 2 25 -0.3651 to 50% *significant at the 0.05 level; **significant at the 0.01 level
Time from 0 to 10%
Time from 10 to 30%
Time from 10 to 50%
1 0.5401*
1
0.7993**
0.8518**
1
0.8080**
0.3942
0.8172**
Figure 2. Scatter plots between diffusion time and technological improvement rate
14
Time from 30 to 50%
1
According to the correlation analysis results and scatters plots, there is a negative correlation between product diffusion time and technological performance improvement rate. In particular, they show a stronger negative correlation in the early stage (from 0% to 10% penetration) than in the later stage of diffusion process. In other words, the strength of the relationship between product diffusion rate and product improvement rate decreases gradually from the early stage to the later stage of diffusion process. This is expected since the effect of the performance improvement is tempered at the later stages by saturation effects. Therefore, both the sign and the fall-off of the correlation with penetration are consistent with our hypothesis H1.
4.2. Regression analysis Next, we empirically test the relationship of diffusion rates with technological improvement using equation (2), a Poisson regression model proposed in this study. In the model, the product diffusion time from 0% to 10%, from 10% to 30%, and from 30% to 50% are used as dependent variables, respectively. Then, the relative rate of technological improvement, types of market where products spread (household or another market), and level of price are used as explanatory variables. Specifically, products 1 – 15 in Table 1 are set as household adoption products, and products 1 – 10 among these household adoption products are classified as high-priced and the remaining products are classified as low-priced1. We estimate our Poisson regression models using the Huber-White sandwich estimator to ensure robust confidence intervals and guarding against over-dispersion and violations of model assumption (White, 1980). Table 4 reports the Poisson regression analysis results. Each column in Table 4 presents the estimates from a different model. The basic models 1-1, 2-1, and 3-1 have product diffusion time from
Constant 2015 $1000 is the arbitrary cut-off price between high priced and low priced, and selling price is based on a rough estimate of the average selling price in constant 2015 dollars within the product and across time (Olshavsky, 1980). 1
15
0% to 10%, from 10% to 30%, and from 30% to 50% as dependent variable, respectively, and contain only Improvement Rate as an explanatory variable. The models 1-2, 2-2, and 3-2 include additional explanatory variables to control product type and price level in each basic model.
Table 4. Poisson regression analysis results
Improvement Rate No Household Adoption (farms, hospitals) High Priced (among household adoption) Constant
Model 3-2 (Time from 30 to 50%) -0.0169 (0.0104)
Model 1-1 (Time from 0 to 10%)
Model 1-2 (Time from 0 to 10%)
Model 2-1 (Time from 10 to 30%)
Model 2-2 (Time from 10 to 30%)
Model 3-1 (Time from 30 to 50%)
-0.0322** (0.0084)
-0.0232** (0.0069)
-0.0266** (0.0092)
-0.0215** (0.0075)
-0.0224 (0.0141)
-
0.5404* (0.2532)
-
0.8825** (0.2010)
-
0.9475** (0.3651)
-
0.7801** (0.2066)
-
0.6261* (0.2671)
-
0.7186* (0.3156)
3.3080** (0.1877) 0.3060
2.5604** (0.2405) 0.3901
2.5181** (0.2339) 0.1676
1.8789** (0.2735) 0.2391
2.1477** (0.3531) 0.0956
1.4268** (0.3624) 0.1645
Pseudo R2 Log-70.4718 -61.9345 -53.2279 -48.6597 -53.8476 likelihood Notes: the numbers in parentheses are the standard errors of the estimated coefficients. *significant at the 0.05 level ** significant at the 0.01 level.
-49.7483
According to the regression analysis results, Improvement Rate is in the expected direction for all models and is significant in the models 1 and 2. That is, technological improvement rates are significantly related to diffusion rates in the early stage of the diffusion process; diffusion time tends to become shorter as technological improvement rates increase. In addition, Both slope and pseudo R2 increase for these regressions as we proceed to smaller penetration levels (models 1-1 > 2-1 > 3-1 and 12 > 2-2 > 3-2). This result suggests that the relationship between technological improvement rates and diffusion rates is stronger at the beginning of the diffusion process. Thus, hypothesis H1 is strongly 16
supported; new products that are based on faster-improving technology domains spread more rapidly in potential markets. In addition, new products spreading across farms or hospitals are found to spread relatively slower than products spreading among households. Moreover, high priced household products tend to spread slower in the market.
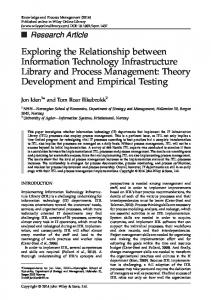
4.3. Statistical sign test We examine if the rate of technological improvement decreases in the later stage of diffusion process or not, to test our hypothesis H2. First, the diffusion process of products and their technological improvment are graphically plotted over time as shown in Figure 3. These graphs do not show qualitative decrease in the rate of technological improvement in the later stage of diffusion process.
Figure 3. Diffusion and technological improvement (log) over time 17
Next, the sign test and the Wilcoxon signed rank test (Wilcoxon, 1945) which are statistical methods to test for consistent differences between pairs of observations, are performed to statistically test our hypothesis H2. The null hypothesis of these two tests is that there is no difference between the rates of technological performance of the early and later stages of diffusion process. Then, the alternative hypothesis of the Wilcoxon signed rank test is that there is a difference between them, whereas the alternative hypothesis of the sign test is set up that there is a negative difference beteween these (i.e., the rate of technological improvement decreases in the later stage of the diffusion process). If the null hypothesis is rejected and the alternative hypothesis is accepted in both tests, we can say that our hypothesis H2 is statically accepted. Table 5 reports difference in the technological improvement rate between the early and later stages of diffusion process for the statistical tests and the results of the tests.
Table 5. Difference in the technological improvement rate between the early and later stages of diffusion Early stage (until Later stage (until 50%) Differe 10%) Technological Product nce Domain (metric) Time Improvement Time Improvement (k2-k1) range rate k1 (%) range rate k2 (%) 1.Automobil 18961896Piston Engine (W/kg) 11.81 7.92 -3.89 e 1915 1925 2.Washing Electrical Motor 188118815.50 3.52 -1.98 Machine (W/kg) 1929 1966 3.Refrigerato Electrical Motor 188118815.50 5.00 -0.50 r (W/kg) 1929 1940 4.Home Air Electrical Motor 188118813.90 3.10 -0.80 Conditioning (W/kg) 1964 1979 5.Dishwashe Electrical Motor 188118813.52 2.93 -0.59 r (W/kg) 1966 1993 6.Clothes Electrical Motor 188118813.90 3.10 -0.80 Dryer (W/kg) 1964 1979 7.Videotape Magnetic Information 1952195215.62 14.55 -1.07 Recorder Storage (Mbits/cc) 1986 1992 8.Personal Microprocessor 1972197238.18 31.79 -6.39 Computer (#/die) 1985 1999 Microprocessor 197219729.Laptop 31.79 36.33 +4.54 (#/die) 1999 2006 18
10.Mobile Telephone 11.CD Player 12.Internet 13.Digital Camera 14.Tablet
Wireless Telecommunication (Kbps) Optical Information Storage (Mbits/cc) Electrical Telecommunication (Kbps) Camera Sensitivity (mV/micron2) Microprocessor (#/die)
19461993
15.49
19462001
18.8
+3.31
19811990
34.3
19811995
25.73
-8.57
19651994
32.15
19652002
32.8
+0.65
15.84
-0.78
36.33
+3.96
27.15
+2.90
19872000 19722001
15.DVD Player/Recor der
Optical memory (Mbits/cc)
19812000
16.Tractor
Tractor Engine (HPhr/gallon)
17.CT
CT (1/mm·s)
18.MRI
MRI (1/mm·s)
19201929 19711976 19801993
1) Sign test Null hypothesis: k2-k1 = 0 vs. Alternative hypothesis: k2-k1 < 0 p-value = 0.2403
16.62 32.37 24.25
19872006 19722006 19812004
19203.92 1954 1971180.84 84.51 1985 198015.81 45.74 2006 2) Wilcoxon signed rank test Null hypothesis: k2-k1 = 0 vs. Alternative hypothesis: k2-k1 ≠ 0 p-value = 0.4996 3.87
+0.05 -96.33 +29.93
Note: we also conducted the sign test and the Wilcoxon signed rank test using the data excluding technological domains like electrical motor and microprocessor which match with multiple products to clearly identify the relationship between diffusion process and technological performance progress, but the implication of those results was the same as with the presented results. As the p-values of the sign test and the Wilcoxon signed rank test turn out to be 0.2403 and 0.4996 respectively and are greater than the 0.05 significance level, we cannot reject the null hypothesis and accept the alternative hypotheses, suggesting that our hypothesis H2 is not supported and there is no observed difference between the rates of technological performance of the early and later stages of diffusion process.
19
5. Discussion and implications The results based on 18 products and their core technological domains and the associated statistical tests of our hypotheses provide answers to the research questions presented in this study. First, it is expected that the technological improvement rate affects the relative rate of diffusion of the products according to the previous theoretical discussion in the diffusion literature (Davies, 1979; Geroski, 2000; Hall, 2005; Mansfield, 1961). To statistically test this theoretically expected relationship, we set up our hypothesis H1 that new products based on faster-improving technological domains are spread more rapidly in a potential market. Our correlation and regression analysis results confirm that this hypothesis is significantly supported by empirical evidence. Our first finding adds to the limited empirical evidence on the relationship of technological improvement with diffusion. Additionally, from our correlation and regression analysis results, we find that the intensity of the relationship between technological improvement and diffusion becomes weaker toward the later stage of the diffusion process. It is quite possible that the entry of saturation effects diminish the effect of improved performance. However, it might also be interpreted that the technological improvement gives a greater stimulus to the demand of the related product in the early stage of diffusion process than in the later stage. We can speculate that this occurs because innovators and early adopters accepting a new product in the early stage of the diffusion process are enthusiastic about new technology and high performance, but the majority adopters and laggards accepting the product in the later stage of the diffusion process place more emphasis on low price and stability of the product as Rogers (1995) argues. Second, according to the existing theoretical argument, the underlying cause of technological improvement and its effect on diffusion can be explained by 1) key technical characteristics of technological domains (Basnet and Magee, 2016; Benson and Magee, 2015) or 2) firm entry and nonprice competition among firms in the diffusion process (Agarwal and Bayus, 2002; Metcalfe 1981;
20
Stoneman and Ireland, 1983). According to the first framework, the performance of the product improves continually at a rate determined by its technical characteristics and it stimulates the demand for the product. On the other hand, according to the second framework, firm entry and competition among firms in the early stage of the diffusion process cause R&D directed towards technological improvement of the product which similarly increases the demand for the product. According to this explanation, the rate of technological improvement of the product decreases at the late stage of the diffusion process as firm entry and competition are reduced. In order to determine which of these two theoretical possibilities can better explain the relationship of technological improvement with diffusion, our hypothesis H2 was set up that the rate of technological improvement slows down in the later stage of the diffusion process as expected frm the second framework when new entrants decrease and the competition among firms relaxes. Our statistical sign tests rejected hypothesis H2 and indicate that there is no difference between the rates of technological performance of the early and the later stages of the diffusion process. That is, the results provide empirical evidence that the second framework is not a likely explanation for the observed effect in H1. Although our model effectively assumes that more rapid diffusion is due to more rapid increases in technical performance, some might want to consider the opposite direction for causation- more rapid diffusion for any reason leads to more rapid increases in performance improvement. This argument could be based, for example, upon “production learning” leading to faster improvement. However, the results here indicating that performance improvement does not fall off at the later stages of diffusion (or even after diffusion is complete) is a strong counter-argument to this hypothesis. Moreover, the results in Funk and Magee (2015) and Magee et al. (2016) are even stronger counter-arguments to reversing the direction of causation based upon production since those works show that time rather than production is the key determinant of technological improvement and this is consistent with such rates being
21
determined mostly by fundamental technical factors (Basnet and Magee, 2016). Based on our accumulated knowledge to this point, we can summarize that the technological domains of products continue to improve at different rates according to their technical characteristics and the differences in improvement rates of technological domains of products give different intensity stimuli to demand for the products. Thus, new products that are based on faster (slower) improving technological domains spread more rapidly (slowly) in a potential market. However, such relationships weaken when the markets become saturated, even though the technological domains of products continue to improve at specific rates during the diffusion process. In such cases, diffusion of much improved versions of the initial products occur but this is either not counted as diffusion or accounted for by diffusion of a newly named product (desktops-laptops-handheld smart phone, etc.).
6. Conclusions This study reviews the theoretical basis and studies 18 products and their related technological domains to explore the relationship of technological improvement with innovation diffusion and its underlysing cause. Two key findings emerge from our empirical analyses:
We find that new products that are based on faster (slower) improving technological domains are spread more rapidly (slowly) in a potential market. Moreover, the intensity of the relationship between technological improvement and diffusion becomes weaker toward the later stage of the diffusion process.
We find that there is no difference between the rates of technological performance of the early and later stages of the diffusion process. This result can be interpreted as: technological domains of
22
products continue to improve at different rates according to their technical characteristics regardless of the diffusion progress and the differences in improvement rates of technological domains of products give different intensity stimuli to the demand for the products.
23
Acknowledgments The authors gratefully acknowledge the support of the SUTD/MIT International Design Center.
24
References Agarwal, R., & Bayus, B. L. (2002). The market evolution and sales takeoff of product innovations. Management Science, 48(8), 1024-1041. Basnet, S., & Magee, C. L. (2016). Modeling of technological performance trends using design theory. Design Science, 2, e8. Bayus, B. L. (1992). Have diffusion rates been accelerating over time?. Marketing Letters, 3(3), 215226. Benson, C. L., & Magee, C. L. (2015). Quantitative determination of technological improvement from patent data. PloS one, 10(4), e0121635. Cameron, A. C., & Trivedi, P. K. (2013). Regression analysis of count data. New York: Cambridge university press. Clark, W. A., Freeman, H. E., & Hanssens, D. M. (1984). Opportunities for revitalizing stagnant markets: An analysis of household appliances. Journal of Product Innovation Management, 1(4), 242-254. Comin, D. A., & Hobijn, B. (2009). The CHAT dataset (No. w15319). National Bureau of Economic Research. Cox, W. M., & Alm, R. (1997). Time Well Spent: The Declining Real Cost of Living in America. Dallas: Federal Reserve Bank of Dallas Annual Report. Davies, S. (1979). The Diffusion of Process Innovations. Cambridge: Cambridge University Press. Euromonitor. (2017). Passport Global Market Information Database. http://www.euromonitor.com/passport-gmid (Accessed on 02 Jan 2017). Fisher, J. C., & Pry, R. H. (1971). A simple substitution model of technological change. Technological forecasting and social change, 3, 75-88.
25
Funk, J. L., & Magee, C. L. (2015). Rapid improvements with no commercial production: How do the improvements occur?. Research Policy, 44(3), 777-788. Geroski, P. A. (2000). Models of technology diffusion. Research policy, 29(4), 603-625. Griliches, Z. (1957). Hybrid corn: An exploration in the economics of technological change. Econometrica, 25(4), 501-522. Hall, B. H. (2005). Innovation and diffusion. In J. Fagerberg, D. C. Mowery, & R. R. Nelson (Eds.), The Oxford handbook of innovation (pp. 459–484). New York: Oxford University Press. Hillman, A. L., & Schwartz, J. S. (1985). The Adoption and Diffusion of CT and MRI in the United States: A Comparative Analysis. Medical care, 23(11), 1283-1294. Koh, H., & Magee, C. L. (2006). A functional approach for studying technological progress: Application to information technology. Technological Forecasting and Social Change, 73(9), 1061-1083. Koh, H., & Magee, C. L. (2008). A functional approach for studying technological progress: Extension to energy technology. Technological Forecasting and Social Change, 75(6), 735-758. Magee, C. L., Basnet, S., Funk, J. L., & Benson, C. L. (2016). Quantitative empirical trends in technical performance. Technological Forecasting and Social Change, 104, 237-246. Mansfield, E. (1961). Technical change and the rate of imitation. Econometrica, 29(4), 741-766. Mansfield, E. (1989). The diffusion of industrial robots in Japan and the United States. Research Policy, 18(4), 183-192. Metcalfe, J. S. (1981). Impulse and diffusion in the study of technical change. Futures, 13(5), 347-359. Miranda, L. C., & Lima, C. A. (2013). Technology substitution and innovation adoption: The cases of imaging and mobile communication markets. Technological Forecasting and Social Change, 80(6), 1179-1193. Moore, G. E. (1965). Cramming more components onto integrated circuits. Electronics Magazine. 38(8).
26
OECD. (2017). OECD Health Statistics. http://dx.doi.org/10.1787/data-00541-en (Accessed on 06 April 2017) Olmstead, A. L., & Rhode, P. W. (2000). The Diffusion of the Tractor in American Agriculture: 191060 (No. w7947). National Bureau of Economic Research. Olshavsky, R. W. (1980). Time and the Rate of Adoption of Innovations. Journal of Consumer Research, 6(4), 425-428. Rogers, E. M. (1995). Diffusion of Innovations (4th ed.). New York: Free Press. Romer, P. M. (1990). Endogenous technological change. Journal of political Economy, 98(5), 71-102. Sahal, D. (1979). A theory of progress functions. AIIE Transactions, 11(1), 23-29. Solow, R. M. (1957). Technical change and the aggregate production function. The review of Economics and Statistics, 39(3), 312-320. Stoneman, P., & Ireland, N. J. (1983). The role of supply factors in the diffusion of new process technology. The Economic Journal, 93, 66-78. Stoneman, P., & Toivanen, O. (1997). The diffusion of multiple technologies: an empirical study. Economics of Innovation and New Technology, 5(1), 1-17. White, H. (1980). A heteroskedasticity-consistent covariance matrix estimator and a direct test for heteroskedasticity. Econometrica, 48, 817-838. Wilcoxon, F. (1945). Individual comparisons by ranking methods. Biometrics bulletin, 1(6), 80-83. Youn, H., Strumsky, D., Bettencourt, L. M., & Lobo, J. (2015). Invention as a combinatorial process: evidence from US patents. Journal of The Royal Society Interface, 12, 20150272.
27