ORIGINAL RESEARCH published: 28 June 2017 doi: 10.3389/fmars.2017.00198
Exploring the Relationship between Macrofaunal Biodiversity and Ecosystem Functioning in the Deep Sea Elisa Baldrighi 1*, Donato Giovannelli 1, 2, 3, 4 , Giuseppe D’Errico 5 , Marc Lavaleye 6 and Elena Manini 1* 1
Institute of Marine Sciences (ISMAR), Italian National Research Council (CNR), Ancona, Italy, 2 Institute of Earth, Ocean and Atmospheric Science, Rutgers University, New Brunswick, NJ, United States, 3 Program in Interdisciplinary Studies, Institute of Advanced Studies, Princeton, NJ, United States, 4 Earth and Life Science Institute (ELSI), Tokyo Institute of Technology, Tokyo, Japan, 5 Department for Life and Environmental Science (DISVA), Polytechnic University of Marche, Ancona, Italy, 6 Department of Marine Ecology, Royal Netherlands Institute for Sea Research (NIOZ), Texel, Netherlands
Edited by: Cinzia Corinaldesi, Università Politecnica delle Marche, Italy Reviewed by: Jeroen Ingels, Florida State University, United States Americo Montiel, University of Magallanes, Chile *Correspondence: Elisa Baldrighi
[email protected] Elena Manini
[email protected] Specialty section: This article was submitted to Deep-Sea Environments and Ecology, a section of the journal Frontiers in Marine Science Received: 26 September 2016 Accepted: 09 June 2017 Published: 28 June 2017 Citation: Baldrighi E, Giovannelli D, D’Errico G, Lavaleye M and Manini E (2017) Exploring the Relationship between Macrofaunal Biodiversity and Ecosystem Functioning in the Deep Sea. Front. Mar. Sci. 4:198. doi: 10.3389/fmars.2017.00198
The global scale of the biodiversity crisis has stimulated research into the relationship between biodiversity and ecosystem functioning (BEF). Even though the deep sea is the largest biome on Earth, BEF studies in deep-sea benthic ecosystems are scant. Moreover, the small number of recent studies, which mostly focus on meiobenthic nematodes, report conflicting results that range from a very clear positive relationship to none at all. In this BEF study, the deep-sea macrofauna were used as a model to investigate the structural and functional diversity of macrofauna assemblages at three depths (1,200, 1,900, and 3,000 m) in seven open-slope systems from the North-Eastern Atlantic Ocean to the Central-Eastern Mediterranean Sea. The presence and nature of BEF relationships were studied considering two spatial scales, the large and the basin scale, in different environmental settings. Total benthic biomass and macrofaunal predator biomass were used as proxies to assess ecosystem functioning. Ecosystem efficiency was expressed as macrofaunal biomass to biopolymeric carbon content ratio, macrofaunal biomass to prokaryotic biomass ratio, macrofaunal biomass to meiofaunal biomass ratio, and meiofaunal biomass to prokaryotic biomass ratio. On both large and basin spatial scales, some significant relationships between macrofaunal diversity and ecosystem functioning and efficiency were reported. When significant, the nature of BEF relations was positive and exponential or linear supporting the general idea that a higher diversity can enhance ecosystem functioning. Other BEF relationships were explained by the effect of environmental variables. More data from different deep-sea systems are needed, to better elucidate the consequences of biodiversity loss on the ocean floor. Keywords: deep-sea, biodiversity, ecosystem functioning, macrofaunal, relationship
Frontiers in Marine Science | www.frontiersin.org
1
June 2017 | Volume 4 | Article 198
Baldrighi et al.
Macrofauna Diversity - Ecosystem Functioning Relationship
INTRODUCTION
independent variables of functional traits, including feeding guilds, reproduction strategy, bioturbation mode and/or body shape (e.g., Ieno et al., 2006; Carvalho et al., 2013; Pape et al., 2013; Piot et al., 2014; Quéiros et al., 2015), and biological traits analysis (e.g., Bremner et al., 2003; Bolam and Eggleton, 2014) have been applied to express functional diversity. Nevertheless, there is currently no universally accepted methodology for selecting the most appropriate traits for a given study (Bolam, 2013), and quite often the selection is heavily affected by the limited biological information that is available for benthic invertebrate taxa (Bremner, 2008). The deep sea is the most extensive environment on the planet (Ramirez-Llodra et al., 2010), and is a key contributor to ecosystem services and functions, such as ocean carbon cycling (Snelgrove et al., 2014). It is well established that the deep sea is characterized by a relatively high diversity (Grassle and Maciolek, 1992; Rex and Etter, 2010) that varies depending on the habitat being investigated (Levin et al., 2001), spanning from a relatively low diversity with a high level of endemism (e.g., chemosynthetic habitats; Levin et al., 2000) to a rich spatial and faunal diversity, such as that characterizing biogenic habitats (Roberts et al., 2006; Serpetti et al., 2013). Even though the amount of marine systems investigation has risen steeply over the past few years (Worm et al., 2006; Mora et al., 2011), deep-sea BEF studies (>200 m depth) are quite recent (Danovaro et al., 2008a; Leduc et al., 2013; Narayanaswamy et al., 2013; Pape et al., 2013; Zeppilli et al., 2016). A positive and exponential BEF relationship, reported for deep-sea benthic communities (e.g., Danovaro et al., 2008a; Narayanaswamy et al., 2013), has been explained by the prevalence of mutualistic rather than competitive interactions between organisms (Loreau, 2008). It has been suggested that complementarity relationships between species are predominant in the more diverse systems (like deep-sea systems), with facilitation and resource partitioning leading to overall higher function (Loreau, 2000). The strength and the nature of BEF relationships differs strongly among habitats (Danovaro, 2012; Lefcheck and Duffy, 2014; Thurber et al., 2014) and can be influenced by environmental factors (e.g., water depth, temperature, input of organic carbon from the surface) that have a major influence on both deep-sea biodiversity (Tittensor et al., 2011) and ecosystem function (Smith et al., 2008). In addition, a positive BEF relationship may only apply to low-diversity assemblages due to increased competition or to greater functional redundancy in more diverse assemblages (Leduc et al., 2013). It is often assumed that a positive relationship between biodiversity and ecosystem function can reach saturation (Loreau, 2008); after saturation has been reached, some species with particular ecological traits have the potential to enhance overall ecosystem functioning (Cardinale et al., 2007). Most deep-sea BEF investigations have used the meiofauna, particularly nematodes, as model taxa (Danovaro et al., 2008a; Leduc et al., 2013; Pape et al., 2013; Pusceddu et al., 2014b; Yasuhara et al., 2016; Zeppilli et al., 2016), whereas comparatively few studies have examined how microbial and viral components (Danovaro et al., 2008b), or of larger epifauna (Amaro et al.,
The Earth is experiencing a pervasive and uncontrolled loss of species, raising grave concerns about the deterioration of ecosystem functions and services (Hooper et al., 2005). This scenario has stimulated research into biodiversity-ecosystem function (BEF) relationships, in order to clarify how ecosystems work and respond to change, and to establish whether and how biodiversity matters (Loreau, 2010). Ecosystem functioning is a general concept that refers to the overall performance of ecosystems (Jax, 2005). It has been posited as incorporating a variety of ecosystem processes (such as biogeochemical cycles), properties (e.g., pools of organic matter) and goods (e.g., food), individually or in combination (Armstrong et al., 2012). Describing or measuring ecosystem functioning is difficult, particularly given the breadth of the notion, and often a precise definition is not provided at all (Bremner, 2008). Over the past few decades a large body of work—most of it performed in terrestrial environments or in the laboratory, where manipulative experiments can be performed under controlled conditions (Mora et al., 2011)—has explored BEF relationships (see Cardinale et al., 2011; Tilman et al., 2014 for reviews). BEF studies conducted in terrestrial, freshwater, and marine systems (Tilman et al., 2014) have shown that biodiversity affects ecosystem functioning. Overall, the relationship is positive, especially where heterogeneous systems (e.g., biogenic habitats; Miller et al., 2012) and long timescales are involved (Cardinale et al., 2007). Such a positive effect is often related to the fact that different species play complementary rather than competitive roles (Gamfeldt et al., 2014). However, not all studies report the same general trend, and conflicting results have been described in small-scale experiments and large-spatial scale observations (Mora et al., 2014; Lefcheck and Duffy, 2015). Experimental studies have usually reported that species diversity exerts a saturating effect, whereas field work has tended to describe a positive effect on ecosystem functioning. In addition, a neutral or a negative effect has been described in several studies, suggesting that a positive effect is not the rule (Lefcheck and Duffy, 2014). Another important issue when assessing the existence and nature of BEF relationships is the temporal (Yasuhara et al., 2016) and spatial (Venail et al., 2008) scale of the investigation. Accordingly, a major challenge to understanding the effects of biodiversity on ecosystem functioning is to establish whether the patterns observed in the small scale also apply to the larger scale, and vice versa (Biles et al., 2003). Numerous BEF studies have related taxon diversity, primarily taxon richness, to the rate of ecosystem processes, using this diversity measure as a surrogate for functional diversity (Naeem and Wright, 2003). The notion of functional diversity incorporates interactions among organisms and their environment into a concept that can depict ecosystem level structure in marine environments (Bremner et al., 2003). Since functional diversity provides a direct mechanistic link between diversity and ecosystem functioning, a growing amount of research is being devoted to assessing the effect of functional—rather than taxon—diversity on ecosystem functioning (Petchey et al., 2004; Reiss et al., 2009). Numerous
Frontiers in Marine Science | www.frontiersin.org
2
June 2017 | Volume 4 | Article 198
Baldrighi et al.
Macrofauna Diversity - Ecosystem Functioning Relationship
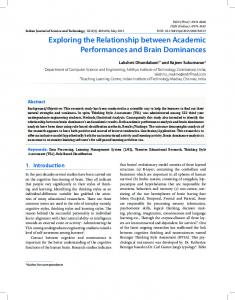
were collected in 7 open-slope areas: 1 in the North Eastern Atlantic (ATL), 3 in the Western Mediterranean basin (wM1, wM2, and wM3), and 3 in the Central-Eastern Mediterranean basin (c-eM1, c-eM2, and c-eM3) (Figure 1). In each area, 3 stations were sampled at 3 different depth ranges: upper bathyal (1,200 m), mid-bathyal (1,800–1,900 m), and lower bathyal (2,400–3,000 m). Since the sample at the lower bathyal depth (ceM1) could not be collected, this station was replaced with one at a depth of 2,120 m (Table S1). The Atlantic sampling area was on the Galicia Bank, a seamount situated on the Iberian margin about 200 km off the Galician coast. The Bank, whose summit is found at a depth of 620 m, is separated from the shallower parts of the continental margin by the Galicia Interior Basin (Pape et al., 2013), whose approximate depth is 3,000 m. Water current velocities on top of the seamount range from 5 to 30 cm s-1 (Pape et al., 2013), which is sufficient to influence organic matter deposition. Such currents result in very low phytopigment and biopolymeric organic carbon concentrations and in the presence of coarse sediments at 1,200 m depth (Table S1). The deep Mediterranean Sea is a highly oligotrophic environment, where nutrient depletion in surface waters combines with high water temperature, promoting the degradation of sinking organic matter (Sardà et al., 2004). The Mediterranean basin is characterized by a trophic gradient between the less productive eastern basin and the more productive western basin (D’Ortenzio and Ribera d’Alcalà, 2009; Giovannelli et al., 2013; Table S1), where the greater nutrient inputs are due to river runoff, the inflow of Atlantic surface water, and the outflow of relatively nutrient-rich Levantine Intermediate Water through the Strait of Gibraltar (Bergamasco and Malanotte-Rizzoli, 2010). The Mediterranean open-slope systems selected for the present study are characterized by a high percentage of silt sediment at all depths. Bottom-water temperature and salinity increase significantly from west to east, with values ranging respectively from 13.1◦ C and 38.5◦ C in the
2010), influence ecosystem functioning. In this study, BEF relationships were explored by focusing on the structural and functional diversity of the macrobenthic fauna. Macrobenthos have recognized ecological roles in key processes such as bioturbation (Meysman et al., 2006; Loreau, 2008; Braeckman et al., 2010), sediment oxygenation, and as a food source for higher trophic levels (Gage and Tyler, 1991), and have often been studied in shallow-water and freshwater BEF investigations (Gamfeldt et al., 2014; Lefcheck and Duffy, 2014). However, to the best of our knowledge, they have never been studied in deepsea BEF research. Since setting up deep-sea in situ experiments is difficult and costly, the observational—correlative approach (Loreau, 2008) was employed to answer the following questions: (i) Is there a relationship between deep-sea macrofaunal diversity and ecosystem functioning and efficiency? (ii) Does macrofaunal functional diversity have a stronger link to ecosystem functioning than does macrofaunal diversity per se? (iii) Can the spatial scale of the investigation (i.e., large vs. basin scale) and related environmental factors influence BEF relationships?
MATERIALS AND METHODS Study Area and Sampling Strategy Biological and environmental samples were collected during several cruises in the framework of the ESF EuroDEEP BIOFUN project (“Biodiversity and Ecosystem Functioning in Contrasting Southern European Deep-sea Environments: from Viruses to Megafauna”), whose main aim was to explore possible links between biodiversity patterns and ecosystem functioning in relation to environmental conditions, through analyzing organisms ranging from viruses to megafauna. Sampling was conducted at selected deep-sea sites along a gradient of increasing oligotrophy from west to east—from the Galicia Bank in the Atlantic Ocean to the Levantine Basin—at depths of 1,200, 2,000, and 3,000 m. Sediment samples
FIGURE 1 | Map of the study area and sampling sites. Purple circle, Galicia Bank—Atlantic Ocean (ATL); red circles, Western Mediterranean basin (wM1, 2, 3), yellow circles, Central-Eastern Mediterranean basin (c-eM1, 2, 3).
Frontiers in Marine Science | www.frontiersin.org
3
June 2017 | Volume 4 | Article 198
Baldrighi et al.
Macrofauna Diversity - Ecosystem Functioning Relationship
chlorophyll-a and phaeopigment concentrations was designated as chloroplastic pigment equivalents (CPE). Total phytopigment concentrations were converted to carbon (C) equivalents using a conversion factor of 40 (De Jonge, 1980) and expressed as mgC g−1 . Biopolymeric organic carbon (BPC) was calculated as the sum of the carbon equivalents of carbohydrates, proteins, and lipids (Fabiano et al., 1995). The protein to carbohydrate (PRT: CHO) ratio was then calculated and used as a descriptor of the nutritional value of sediment organic matter. PRT: CHO ratios >1.0 indicate relatively high quality and high food availability (Pusceddu et al., 2010). The total prokaryotic number (TPN) was determined by acridine orange staining (Luna et al., 2002) and analyzed using epifluorescence microscopy (magnification, 1,000 x). Total prokaryotic biomass (TPB) was estimated using an ocular micrometer; prokaryotic cells were assigned to different size classes (Fry, 1990) and converted to biovolumes based on the assumption that they had an average carbon content of 310 fgC µm−3 (Fry, 1990). For meiofauna analysis, the fraction remaining on the 20-µm sieve was resuspended and centrifuged using Ludox HS40 (Danovaro, 2010). Meiofaunal biomass was estimated as described by Danovaro (2010). Macrofaunal organisms were sorted under a stereomicroscope and identified to the lowest possible taxonomic level. For each species, the total number was calculated and the wet weight biomass measured and expressed respectively as abundance and biomass per m2 . Wet biomass (g wet weight m−2 ) was converted to ash-free dry weight and organic carbon content using standard conversion factors (Rowe, 1983).
wM area to 14.7◦ C and 38.8◦ C in the Eastern Mediterranean basin (Baldrighi et al., 2014; Table S1). At each station, sampling involved 3 independent box-corer deployments for macrofauna (entirely sieved) and 3 deployments for meiofauna, microbial components, and environmental variables (n = 3 replicate samples for each parameter). Macrofauna samples were collected with a cylindrical box-corer with an internal diameter of 32 cm at all stations except for ATL, wM2 and c-eM2, where its internal diameter was 50 cm, accounting for a surface area of 803.84 cm2 and 1,962.5 cm2 , respectively. Data of macrofaunal abundance, biomass and diversity as well as data of environmental parameters characterizing the Mediterranean basin from west to east have previously been shown in Baldrighi et al. (2014). Data of meiofauna abundance, structural and functional diversity from the Mediterranean basin have been presented in Baldrighi and Manini (2015) and the relationship with macrofaunal structural and functional diversity has been investigated. In the present study, the same dataset has been used, with the addition of new data from the Atlantic area (i.e., macrofaunal diversity, benthic biomass, environmental features) and ecosystem functioning and efficiency proxies. We adopted a new approach of investigation aimed at finding BEF relations. A complete species list is provided in Table S2.
Processing of Environmental and Biological Samples For grain size, biochemical composition of organic matter, and microbial component analysis, sediment subsamples from each box-corer were collected using plexiglass cores with an internal diameter of 3.6 cm. The top 1 cm of a sub-sample from each boxcorer was collected and frozen at −20◦ C to analyze chlorophyll-a, phaeopigment, and organic matter content. Replicates of about 1 ml wet sediment were fixed using buffered formaldehyde and stored at +4◦ C until processing for total prokaryotic abundance and biomass determination (Giovannelli et al., 2013). The top 20 cm was preserved at +4◦ C for grain size analysis. For meiofauna analysis, sediment from each box-corer was collected using a plexiglass tube with an internal diameter of 3.6 cm and immediately fixed in 4% buffered formalin and Rose Bengal. Once in the laboratory, only the top 5 cm was sieved through a 300-µm and subsequently a 20-µm mesh sieve. Meiofaunal samples were obtained from 6 of the 7 areas (meiofauna data not available from c-eM2 slope area). For macrofauna analysis, the top 20 cm of sediment from each box-corer and the overlying water were sieved through a 300-µm mesh sieve to retain all macrobenthic organisms (here considered sensu lato, including nematodes, copepods, foraminifera, etc.) (Baldrighi and Manini, 2015). The residue left in the sieve was immediately fixed in buffered formalin solution (10%), and stained with Rose Bengal. For grain size analysis, aliquots of fresh sediment were sieved through a 63-µm mesh. The two fractions (>63 µm, sand; 0.50), as recommended by some authors (e.g., Quinn and Keough, 2009), identified significant correlations between SR and two descriptors: EPR and EDF.
TABLE 2 | Complete list of significant and non-significant BEF relations reported (A) on large spatial scale and (B) on basin spatial scale. BEF relation
AIC values Linear Power Exponential
(A) Large N◦ taxa—total biomass ns spatial SR—total biomass ** scale ES(50) —total biomass ns
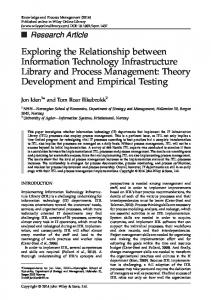
RESULTS Relationship between Biodiversity and Functioning on the Large Spatial Scale The presence of a BEF relationship on the large spatial scale was investigated by testing the effect of different structural and functional macrofauna diversity indices on ecosystem functioning and efficiency proxies (Table 2A). The assessment of collinearity between structural and functional diversity indices with the VIF test using a threshold level of 2.5, indicated that SR exhibited a significant degree of collinearity with EPR(20) and EDF(30) (VIF = 2.7 and 2.8, respectively). This finding was expected because EPR(20) and EDF(30) are both related to the number of species (SR). Analysis of the full dataset (ATL, wM, and c-eM, see Table S5 for total macrofauna abundances) showed that macrofaunal SR was the only diversity index to be positively related to total benthic biomass, and that ES(50) was related to macrobenthic predator biomass (Figure 2A, Table 3). The exponential model was the one that best described these relationships (Tables 2A, 3). The relationships between other diversity indices and benthic biomass were explained by the environmental cofactors (water depth, longitude, food availability, and grain size; Table 4A). The energy flow through the biotic ecosystem was quantified using the ratio of macrobenthic biomass to the amount of biopolymeric carbon (MBM:BPC), the ratio of macrofaunal biomass to prokaryotic biomass (MBM:TPB), the ratio of macrofaunal biomass to meiofaunal biomass (MBM: MEB), and the ratio of meiofaunal biomass to prokaryotic biomass (MEB:TPB) as proxies. On the large scale, macrobenthic biodiversity was not significantly related to any of these proxies of ecosystem efficiency (Table 2A), and most of its variability was explained by environmental covariates (Table 4A). Macrofaunal functional diversity was expressed as trophic diversity, EDF(30) , EPR(20) , and BP. A BEF relationship was found only when EDF(30) was considered, and it was significant and exponential (Figure 2B, Tables 2A, 3). None of the other functional diversity indices used had any effect on ecosystem functioning, or else the relationships were explained by a covariate effect (Table 4A).
Frontiers in Marine Science | www.frontiersin.org
Significance
N◦ taxa—predators biomass
ns
SR—predators biomass
ns
ES(50) —predators biomass
*
N◦ taxa—MBM:TPB
ns
SR—MBM:TPB
ns
ES(50) —MBM:TPB
ns
N◦ taxa—MBM:BPC
ns
SR—MBM:BPC
ns
ES(50) —MBM:BPC
ns
N◦ taxa—MBM:MEB
ns
SR—MBM:MEB
ns
ES(50) —MBM:MEB
ns
N◦ taxa—MEB:TPB
ns
SR—MEB:TPB
ns
ES(50) —MEB:TPB
ns
2−1 —total biomass
ns
651.7
653.2
431.2
479.7
480.1
380.2
748.4
746.6
431.2
389.0
554.8
596.6
EPR(20) —total biomass ns EDF(30) —total biomass
*
BP—total biomass
ns
2−1 —predators biomass
ns
EPR(20) —predators biomass
ns
EDF(30) —predators biomass
ns
BP—predators biomass
ns
2−1 —MBM:TPB
ns
EPR(20) —MBM:TPB
ns
EDF(30) —MBM:TPB
ns
BP—MBM:TPB
ns
2−1 —MBM:BPC
ns
EPR(20) —MBM:BPC
ns
EDF(30) —MBM:BPC
ns
BP—MBM:BPC
***
2−1 —MBM:MEB
ns
EPR(20) —MBM:MEB
ns
EDF(30) —MBM:MEB
ns
BP—MBM:MEB
ns
2−1 —MEB:TPB
ns
EPR(20) —MEB:TPB
ns
EDF(30) —MEB:TPB
ns
BP—MEB:TPB
ns (Continued)
6
June 2017 | Volume 4 | Article 198
Baldrighi et al.
Macrofauna Diversity - Ecosystem Functioning Relationship
TABLE 2 | Continued BEF relation
TABLE 2 | Continued Significance
AIC values
BEF relation
Significance
Linear Power Exponential Basin
Linear Power Exponential Basin
(B)
BP—MBM:TPB N◦ taxa—total biomass
ns
AIC values
ns
All basins
All basins
2−1 —MBM:BPC ns
All basins
EPR(20) — MBM:BPC
ns
All basins
SR—total biomass ***
238.3 256.6
134.3
Western
ES(50) —total biomass
281.1 179.6
281.4
Western
EDF(30) — MBM:BPC
ns
All basins
N◦ taxa— ns predators biomass
All basins
BP—MBM:BPC
SR—predators biomass
ns
*
ns
All basins
2−1 —MBM:MEB ns
All basins
All basins
EPR(20) — MBM:MEB
ns
All basins
ES(50) —predators ns biomass
All basins
EDF(30) — MBM:MEB
*
246.7 224.5
134.3
N◦ taxa— MBM:TPB
ns
All basins
BP—MBM:MEB 2−1— MEB:TPB
*
245.2 213.5
143.7
ns
All basins
SR—MBM:TPB
***
EPR(20) — MEB:TPB
ns
All basins
ES(50) —MBM:TPB **
80.4
94.2
134.3
Western
88.8
94.2
56.9
Western
Western Western
N◦ taxa— MBM:BPC
ns
All basins
EDF(30) — MEB:TPB
ns
All basins
SR—MBM:BPC
ns
All basins
BP—MEB:TPB
ns
All basins
ES(50) — MBM:BPC
ns
All basins
N◦ ns taxa—MBM:MEB
All basins
SR—MBM:MEB
ns
All basins
ES(50) — MBM:MEB
ns
All basins
N◦ taxa—MEB:TPB
ns
All basins
SR—MEB:TPB
ns
All basins
ES(50) —MEB:TPB ns
All basins
2−1 —total biomass
ns
All basins
EPR(20) —total biomass
*
106.2
76.1
106.4
Atlantic
EDF(30) —total biomass
*
107.9 106.2
59.8
Atlantic
***
241.4 253.6
93.9
Western
BP—total biomass ns
All basins
2−1 —predators biomass
ns
All basins
EPR(20) — predators biomass
ns
All basins
EDF(30) — predators biomass
ns
All basins
BP—predators biomass
ns
All basins
2−1 —MBM:TPB
ns
All basins
EPR(20) — MBM:TPB
ns
All basins
EDF(30) — MBM:TPB
ns
All basins
The AIC values for the significant relations are reported. In bold the model that best describes the nature of the relations between macrofaunal diversity and ecosystem functioning and/or efficiency. Species richness (SR), expected species richness (ES(50) ), expected richness of deposit feeders (EDF(30) ), expected richness of predators (EPR(20) ), bioturbation potential (BP), trophic diversity (Θ −1 ). Macrobenthic biomass to biopolymeric carbon ratio (MBM:BPC), macrobenthic biomass to prokaryotic biomass (MBM:TPB), macrobenthic biomass to meiobenthic biomass (MBM:MEB) and meiobenthic biomass to prokaryotic biomass (MEB.TPB). Significance: ***P < 0.001; **P < 0.01; *P < 0.05; ns, not significant.
On the large spatial scale, BP was the only functional parameter to be positively and linearly correlated with ecosystem efficiency as measured by the MBM:BPC ratio (Tables 2A, 3). In all the other cases (Table 4A), its effect was overridden by covariate effects. In summary, 4 of the 42 BEF relationships tested in the study indicated that macrofauna diversity significantly affected ecosystem functioning and efficiency (Table 2A). However, the collinearity between SR and EDF(30) suggests that their number may in fact fall to 3/42.
Basin-Scale BEF Relationships The relationships identified on the basin scale among macrofaunal structural and functional diversity, and ecosystem functioning and efficiency are reported in Table 2B. Each slope system yielded different results (Table 5). The number of significant relationships was highest in the w-M basin, where macrofaunal diversity was positively related to ecosystem function and efficiency (Figure 3, Table 5). In the other slope areas, the effect of the environmental variables attenuated the BEF relationships (Table 4B). The nature of the relationships ranged from linear to exponential, according
(Continued)
Frontiers in Marine Science | www.frontiersin.org
7
June 2017 | Volume 4 | Article 198
Baldrighi et al.
Macrofauna Diversity - Ecosystem Functioning Relationship
matter exports to the seafloor (Levin and Sibuet, 2012). Slope sediments host a large quantity of marine biodiversity and are repositories of deep-sea biomass, and their benthic communities are characterized by a high spatial heterogeneity (Coll et al., 2010). The factors commonly invoked as drivers of the spatial distribution and diversity of deep-sea benthic fauna include substrate heterogeneity (Etter and Grassle, 1992), water circulation (Tyler, 2003), oxygen availability (Levin and Sibuet, 2012), productivity and microbial activity (Tyler, 2003), and food resources (Menot et al., 2010). Since the stations sampled in this study lay along a west-east axis encompassing different trophic and oceanographic conditions, environmental factors were expected to influence BEF relationships. The large spatialscale analysis, spanning the area from the Atlantic Ocean to the Central-Eastern Mediterranean Sea, detected two significant and exponential relationships between macrofaunal diversity and ecosystem functioning. An exponential relationship between BEF has been described for various organism size classes (Mora et al., 2014); positive interspecies interactions between organisms, such as facilitation, have been suggested to sustain such relationships (Danovaro et al., 2008a). However, the diversity indices used in the present study were not all significantly related to the ecosystem functioning measures. In fact, the existence of a BEF relationship appeared to be closely linked to the diversity and ecosystem functioning measures used (Gamfeldt et al., 2014), which are often context-dependent (O’Connor and Donohue, 2013). These findings are in line with other work (Pape et al., 2013; Cusson et al., 2015; Poorter et al., 2015), where not all diversity measures correlated with ecosystem functioning. On the large spatial scale, macrofaunal diversity—ecosystem efficiency relations were not significant. We chose our ecosystem efficiency proxies following the idea that the positive influence exerted by biodiversity on ecosystem efficiency can lead to an efficient use of available food sources and their conversion to higher biomass values (Naeem et al., 1994). Indeed, the ratio of macrobenthic biomass to biopolymeric carbon has been suggested as a proxy of ecosystem efficiency (Danovaro, 2012). This proxy has been reported to have both a positive relationship with benthic diversity (Danovaro et al., 2008a; Zeppilli et al., 2016) and no relationship at all (Leduc et al., 2013). The ratio of macrobenthic to microbial biomass and of macrofaunal to meiofauna biomass can also be employed as proxies to quantify the energy flow through an ecosystem, i.e., how efficiently it works (Cardinale et al., 2012): the higher the ratio, the more efficient the system. Similarly, the meiofaunal biomass to prokaryotic biomass ratio was used as a further proxy of ecosystem efficiency, because of the efficient carbon recycling and strong contribution to total secondary production provided by the meiofauna (De Mesel et al., 2006). Yet, all these proxies may be a gross oversimplification, because the energy flow through an ecosystem is a complex and commonly indirect flow from the smaller to the larger organisms, and is influenced by numerous biotic interactions (Piot et al., 2014), abiotic variables (Snelgrove et al., 2014; Tilman et al., 2014) and the life history of present organisms (Cusson and Bourget, 2005). This may explain the lack of significant diversity—ecosystem efficiency relationships. Moreover, we hypothesize that including
FIGURE 2 | Large spatial-scale relationships between macrofaunal biodiversity and ecosystem functioning and efficiency. (A) Relationship between species richness (SR) and ecosystem functioning expressed as total benthic biomass (mgC/m2 ). The equation of the fitting line is y = e∧(−1.08+0.13x) (N = 64; R2 = 0.98; P < 0.001). (B) Relationship between functional diversity, expressed as expected richness of deposit feeders (EDF(30) ), and ecosystem functioning (total benthic biomass). The equation of the fitting line is y = e∧(2.64−0.16x) (N = 64; R2 = 0.89; P < 0.001).
to the proxies that were applied to quantify biodiversity (Table 2B). In regard to macrofaunal functional diversity, significant and exponential relationships were found among EPR(20), EDF(30) and ecosystem functioning in the w-M and ATL area (Figures 4A–C, Table 5). In the c-eM basin, macrofauna diversity did not significantly affect ecosystem functioning and efficiency (Table 2B). Macrofaunal functional diversity only showed an exponential relationship with the MBM:MEB ratio, one of the proxies of ecosystem efficiency, and only in the wM basin (Table 5). A null relationship, that was mostly explained by the effect of environmental factors in the c-eM basin, was found in the ATL area (Table 4B). According to the present findings, the environmental variables governed all the BEF relationships in the c-eM basin and most of the relationships detected in the ATL area (Table 4B). In the wM slope area the environmental effect seemed to be slightly less marked despite the small number of significant relationships out of the number of BEF relationships assessed (Table 2B).
DISCUSSION Does Large Spatial-Scale Sampling Hamper Identification of BEF Relationships? Continental slopes are ideal sites to investigate BEF relationships, since they account for more than 20% of total marine productivity and for a significant proportion of the organic
Frontiers in Marine Science | www.frontiersin.org
8
June 2017 | Volume 4 | Article 198
Baldrighi et al.
Macrofauna Diversity - Ecosystem Functioning Relationship
TABLE 3 | Large-scale analysis. Independent variable
df
SR
Covariables
7
Regression
1
36,756.46
Residual
44
4,522.36
Total
52
Covariables
7
Regression
1
392.79
Residual
53
98.58
Total
61
Covariables
7
Regression
1
28,146.22
Residual
44
4,718.05
Total
52
Covariables
7
Regression
1
0.00037
Residual
53
0.00004
Total
61
ES(50)
EDF(30)
BP
MS
Pseudo-F
P
Dependent variable
Best model
8.13
**
Total benthic biomass
Exponential
3.98
*
Predators biomass
Exponential
5.97
*
Total benthic biomass
Exponential
9.70
***
MBM:BPC
Linear
Significant relations detected between macrofauna biodiversity (i.e., structural and functional diversity) and ecosystem functioning and efficiency (i.e., Dependent variables), after the removal of covariables’ effect (i.e., depth, longitude, temperature, biopolymeric organic C and chloroplastic pigment equivalent content, protein to carbohydrate ratio). The linear, power and exponential models were used to assess the presence and the nature of the relations. Best model: referred to linear, power or exponential model that, according to the AIC test (see Section Statistical Analysis), can better explain the presence of a relation between different measures of macrofauna diversity and each one of the dependent variables considered. Independent variables: Structural diversity as species richness (SR) and expected species richness (ES(50) ); functional diversity as expected richness of deposit feeders (EDF(30) ) and bioturbation potential (BP). Ecosystem efficiency as macrobenthic biomass to biopolymeric carbon ratio (MBM:BPC). In the regression analyses, all tests were based on Euclidean distances calculated among observations from untransformed data. df, degrees of freedom; MS, mean square; Pseudo-F, statistic; P, probability level (***P < 0.001; **P < 0.01; *P < 0.05).
did not correlate with higher biomass values. Moreover, there was no correlation between predator number (ind m−2 ) and their biomass (R2 = 0.03, p > 0.05); in particular, the wM slope systems were characterized by a large number of predators and a high EPR(20) , whereas their biomass values were lower than those measured in the Atlantic slope area. Mediterranean benthic organisms have been reported to have a generally smaller size than those inhabiting the Atlantic Ocean (Sardà et al., 2004; Tecchio et al., 2011; Pape et al., 2013), and significantly lower macrobenthic biomass values have been described in the Mediterranean basin compared with the Atlantic sector (Tselepides et al., 2000; Coll et al., 2010; Baldrighi et al., 2014). The bioturbation activity of organisms can affect both the abiotic and biotic components of a system (Quéiros et al., 2015), and is one of the functional traits of benthic organisms that may sustain mutualistic interactions on the basis of BEF relationships (Loreau, 2008). On the large spatial scale, bioturbation was positively and linearly correlated with ecosystem efficiency. The biogenic activities (e.g., burrowing, reworking, and displacing of sediment particles) of benthic organisms are fundamental processes with implications for a wide range of ecosystem-related functions, such as organic matter recycling (Thurber et al., 2014). The linear relationship identified in this study indicates that all organisms contribute similarly to ecosystem efficiency (Naeem et al., 1995). This finding seems to support the notion that
a larger number of sites could lead to potentially different BEF relationships. Because functional diversity provides a direct, mechanistic link between diversity and ecosystem functioning, numerous studies have found that functional diversity affects ecosystem functioning more strongly than taxon diversity (Reiss et al., 2009; Mineur et al., 2014). The functional diversity of organisms can be expressed in several ways, and different effects on ecosystem functioning can be identified depending on the measure employed (Naeem et al., 1995; Hiddink et al., 2009). Most of the functional diversity indices used in this study rely on the trophic diversity of macrobenthic organisms [trophic diversity index, EDF(30) and EPR(20) ], a key functional trait (Dunne et al., 2002; Carvalho et al., 2013). A significant and exponential BEF relationship was detected between EDF(30) and total benthic biomass, and it was also identified between SR and total biomass. This finding may be wholly explained by the collinearity between SR and EDF(30) . Unexpectedly, however, while collinearity existed there was no relationship between EPR(20) and benthic biomass. This can probably be attributed to the fact that deposit feeders, which are the most abundant trophic group in the samples collected, may play a far from negligible role in ecosystem functioning. No relationship, but merely a weak positive trend, was detected between EPR(20) and predator biomass; indeed, higher numbers of predator species
Frontiers in Marine Science | www.frontiersin.org
9
June 2017 | Volume 4 | Article 198
Baldrighi et al.
Macrofauna Diversity - Ecosystem Functioning Relationship
TABLE 4 | Biodiversity and functional diversity effects on ecosystem functioning and efficiency, before and after covariables removal, at (A) large spatial scale and (B) basin- spatial scale. Area code
Emerged relationship
Before
Best model
R2
p
After R2
p
(A) ES(50) vs. Total biomass
0.67
***
Exponential
0.10
0.08
Taxa richness vs. Total biomass
0.26
**
Power
0.02
0.59 0.66
ES(50) vs. MBM:BPC
0.27
**
Linear
0.01
ES(50) vs. MBM:TPB
0.25
**
Exponential
0.02
0.58
ES(50) vs. MBM:MEB
0.67
***
Exponential
0.10
0.14
BP vs. prokaryotic biomass
0.44
**
Exponential
0.02
0.13
BP vs. MBM:MEB
0.25
**
Linear
0.02
0.22
BP vs. MBM:TPB
0.25
**
Linear
0.02
0.13
(B) Atlantic Ocean
ES(50) vs. Total biomass
0.48
*
Galicia Bank
SR vs. Total biomass
0.83
***
Power
0.02
0.75
Exponential
0.01
0.41
SR vs. Predators biomass
0.98
***
Exponential
0.19
0.66
ES(50) vs. MBM:MEB
0.98
***
Exponential
0.14
0.33
SR vs. MBM:MEB
0.96
***
Exponential
0.01
0.34
EDF(30) vs. Predators biomass
0.84
***
Exponential
0.2
0.07
Western
SR vs. Predators biomass
0.37
**
Linear
0.08
0.09
Mediterranean
Taxa richness vs. Total biomass
0.70
***
Power
0.01
0.23
EPR(20) vs. Total biomass
0.65
***
Linear
0.00
1.00
EDF(30) vs. Predators biomass
0.65
***
Exponential
0.06
0.20
Central-Eastern
ES(50) vs. Total biomass
0.56
**
Linear
0.01
0.83
Mediterranean
SR vs. Total biomass
0.99
***
Exponential
0.00
0.97
SR vs. Predators biomass
0.92
***
Exponential
0.01
0.78
Taxa richness vs. Total biomass
0.70
***
Linear
0.01
0.23
ES(50) vs. MBM:MEB
0.64
**
Exponential
0.18
0.12
SR vs. MBM:MEB
0.65
**
Exponential
0.10
0.25
Taxa richness vs. MBM:MEB
0.64
**
Exponential
0.06
0.40
EPR(20) vs. Total biomass
0.70
***
Linear
0.01
0.35
EPR(20) vs. Predators biomass
0.90
***
Exponential
0.11
0.06 0.15
EPR(20) vs. MBM:TPB
0.76
***
Exponential
0.02
EPR(20) vs. MBM:MEB
0.64
**
Exponential
0.20
0.11
EDF(30) vs. Total biomass
0.62
**
Linear
0.01
0.91
Biodiversity expressed as expected species richness (ES(50) ); species richness (SR) and richness of macrofaunal taxa. Functional diversity expressed as bioturbation potential (BP); expected deposit feeders (EDF(30) ) and expected predators (EPR(20) ) species richness. Ecosystem functioning expressed as total benthic biomass; macrobenthic predators biomass and prokaryotic biomass. Ecosystem efficiency expressed as macrobenthic biomass on biopolymeric carbon ratio (MBM:BPC); macrobenthic biomass on prokaryotic biomass ratio (MBM.TPB) and macrobenthic biomass on meiofaunal biomass (MBM:MEB). Best model: referred to linear, power, exponential models according to the AIC test (see Section Statistical Analysis). P, probability level (***P < 0.001; **P < 0.01; *P < 0.05); R2 , regression coefficient.
bioturbation facilitates organic matter recycling and uptake by higher trophic levels (Quéiros et al., 2015). On the large spatial scale, the significant relationships we identified between macrofauna’s structural and functional diversity and ecosystem functioning and efficiency were positive and linear or exponential. This result is in line with previous findings (e.g., Mora et al., 2014; Zeppilli et al., 2016), supporting the idea of a positive influence of deep-sea (macro-) faunal diversity on the functioning of ecosystem. An assumption of this work was that the steep environmental gradients
Frontiers in Marine Science | www.frontiersin.org
characterizing the Atlantic—Central-Eastern Mediterranean transect would influence large-scale BEF relationships (Cusson et al., 2015). Since the values of BEF measures can be affected by environmental variables, it is conceivable that BEF relationships reflect the covariation of different factors, as found by the present study. Indeed, temperature, food availability, and substrate heterogeneity are among the features that determine the distribution and diversity of deep-sea benthic populations on the broad spatial scale (Levin et al., 2001). Similarly, the lack of significant associations between functional diversity (except
10
June 2017 | Volume 4 | Article 198
Baldrighi et al.
Macrofauna Diversity - Ecosystem Functioning Relationship
TABLE 5 | Basin-scale analysis. Independent variable
Basin
SR
Western
ES(50)
SR
ES(50)
EDF(30)
EPR(20)
EDF(30)
BP
EDF(30)
Western
Western
Western
Atlantic
Atlantic
Western
Western
Western
df
MS
Covariables
6
Regression
1
4,426.99
Residual
19
302.71
Total
26
Covariables
6
Regression
1
1,691.67
Residual
19
446.68
Total
26
Covariables
6
Regression
1
10.00
Residual
19
0.91
Total
26
Covariables
6
Regression
1
8.06
Residual
19
1.02
Total
26
Covariables
5
Regression
1
5,475.90
Residual
1
12.29
Total
7
Covariables
5
Regression
1
5,449.19
Residual
1
38.99
Total
7
Covariables
6
Regression
1
4,266.45
Residual
19
311.16
Total
26
Covariables
6
Regression
1
37.40
Residual
19
6.36
Total
26
Covariables
6
Regression
1
25.47
Residual
19
5.49
Total
26
Pseudo-F
P
Dependent variable
Best model
14.62
***
Total benthic biomass
Exponential
3.79
*
Total benthic biomass
Power
10.95
***
MBM:TPB
Linear
7.93
**
MBM:TPB
Exponential
445.60
*
Total benthic biomass
Exponential
139.75
*
Total benthic biomass
Power
13.71
***
Total benthic biomass
Exponential
5.9
*
MBM:MEB
Exponential
4.64
*
MBM:MEB
Exponential
Significant relations detected between macrofaunal biodiversity (i.e., structural and functional diversity) on ecosystem functioning and efficiency, after the removal of covariables’ effects (i.e., depth, longitude, temperature, biopolymeric organic C and chloroplastic pigment equivalent content, protein to carbohydrate ratio). Best model: referred to linear, power, exponential models according to the AIC test (see Section Statistical Analysis). Structural diversity as species richness (SR) and expected species richness (ES(50) ); functional diversity as expected richness of deposit feeders (EDF(30) ); expected predators richness (EPR(20)) and bioturbation potential (BP). Ecosystem efficiency as macrobenthic biomass to prokaryotic biomass ratio (MBM:TPB) and macrobenthic biomass to meiobenthic biomass ratio (MBM:MEB). In the regression analyses, all tests were based on Euclidean distances calculated among observations from untransformed data. df, degrees of freedom; MS, mean square; Pseudo-F, statistic; P, probability level (***P < 0.001; **P < 0.01; *P < 0.05).
2009). Belly and Snelgrove (2016) showed how macrofaunal functional diversity and environmental variables can equally explain the majority of variability in some key ecosystem processes. Most deep-sea communities are usually food-limited
for EDF(30) ) and ecosystem functioning found in this study may therefore be due to the influence of environmental variables on the majority of macrofaunal functional and ecosystem functioning measures (Cardinale et al., 2000; Hiddink et al.,
Frontiers in Marine Science | www.frontiersin.org
11
June 2017 | Volume 4 | Article 198
Baldrighi et al.
Macrofauna Diversity - Ecosystem Functioning Relationship
FIGURE 3 | Basin-scale relationships between macrofauna biodiversity and ecosystem functioning and efficiency. (A) Relationship between expected species richness (ES(50) ) and ecosystem functioning, expressed as total benthic biomass (mgC/m2 ). The equation of the fitting line is y = x∧1.43 (N = 27; R2 = 0.32; P < 0.01). (B) Relationship between expected species richness (ES(50) ) and ecosystem efficiency, expressed as macrobenthic biomass to prokaryotic biomass (MBM: TPB). The equation of the fitting line is y = e∧(−1.90+0.12x) (N = 27; R2 = 0.33; p < 0.01).
BEF Relationships on the Basin Spatial Scale
(Levin et al., 2001), and their reliance on the relatively small input of organic carbon from the surface and the particulate organic carbon flux are held to exert a strong influence on deep-sea biodiversity (Tittensor et al., 2011) and ecosystem function (Smith et al., 2008). Moreover, besides food availability, gradients in other drivers such as sediment heterogeneity, oxygen availability, and hydrodynamic regimes (Levin et al., 2001) are also capable of affecting local diversity by influencing the rates of local processes (Rex and Etter, 2010) and consequently BEF relationships. Notably, the functional diversity indices employed did not describe ecosystem functioning more exhaustively than the traditional biodiversity indices. A possible explanation for this is that they do not encompass the full array of key macrobenthic functional traits that underpin ecosystem functioning and efficiency processes. Yet another more targeted approach, which focuses on biological traits analysis and has been proposed for the study of functional diversity (Bremner et al., 2003; Bremner, 2008; Bolam and Eggleton, 2014), also entails some limitations since our understanding of benthic functional diversity is still scant (Bolam et al., 2010). Furthermore, identification of the traits that have a direct and indirect functional role in ecosystems is highly problematic (Pakeman, 2011). The limitations are even greater where deep-sea organisms are concerned, given the poor state of current knowledge regarding their diversity and functional diversity (e.g., Smith et al., 2008; Ramirez-Llodra et al., 2010; Levin et al., 2015).
Frontiers in Marine Science | www.frontiersin.org
It has been suggested that BEF relationships are spatial-scaleand context-dependent (Tylianakis et al., 2008; Zeppilli et al., 2016), and that their nature is related to the system analyzed and the organisms involved (Ieno et al., 2006; Poorter et al., 2015). Analysis of the basin scale data documented a slightly different situation for each of the three slope systems. In the w-M basin, macrofaunal diversity exerted a positive effect on ecosystem function and efficiency, whereas in the other areas the effect of environmental variables explained all (c-eM basin) or nearly all (ATL) BEF relationships. The nature of the relationships identified in the Western Mediterranean basin ranged from linear to exponential, depending on the proxies that were applied to quantify biodiversity. However, irrespective of their nature, some BEF relationships were detected in the western basin but not on the large scale. According to Barnes and Hamylton (2015), the spatial scales on which biodiversity interacts with ecosystem functioning are crucial to understand the significance of BEF relationships. Also in our case, it may be speculated that some BEF relationships identified on the basin scale (the w-M basin) were not detected on the larger scale due to a masking effect exerted by environmental features. Environmental drivers, number of species, and functional diversity affect ecosystem functioning in different ways and with different strength, based on the spatial scale (Cardinale et al., 2007; Poorter et al., 2015). However, a significant relationship between macrofauna diversity
12
June 2017 | Volume 4 | Article 198
Baldrighi et al.
Macrofauna Diversity - Ecosystem Functioning Relationship
granulometric analysis cannot completely catch the seafloor morphologies even on a small spatial scale. Indeed, these seafloor structures are pivotal in shaping the BEF relations, by selecting the species responsible for the effect of ecosystem functioning (Zeppilli et al., 2016). Nonetheless, the presence and shape of BEF relationships can vary when different components (meiofauna, macrofauna, fish) are taken into account (Pusceddu et al., 2014a). This suggests that different environments (i.e., basins) may involve different functional structures of macrobenthic communities. O’Connor and Crowe (2005) concluded that different species play idiosyncratic roles, explaining why no relationship is found between species richness and ecosystem functioning in some cases. Furthermore, the inclusion of more sampling sites in the Atlantic area might lead to different BEF relationships.
FINAL REMARKS In the present study, some significant relationships between macrofaunal diversity and ecosystem functioning and efficiency were reported. The nature of BEF relations was positive and exponential or linear, as already documented in various systems at different spatial and time scales and encompassing diverse faunal components and systems (e.g., Mora et al., 2014; Pusceddu et al., 2014a; Yasuhara et al., 2016). The role of positive ecological interactions in ecosystem functioning and efficiency provides an explanation for a positive and exponential BEF relation (Cardinale et al., 2002). Many other relationships emerged between macrofaunal BEF and efficiency, and they were influenced by the effect of environmental variables on both large and basin scales. Another aspect that deserves consideration is that the the majority of deep-sea investigations, like the present study, are time-scale limited. Recent experiments (Gravel et al., 2010; Reich et al., 2012) and studies (Yasuhara et al., 2016) have shown that evolutionary and long-term responses may have effects on BEF relationships. Functional diversity as assessed in the present study did not appear to be more effective in influencing ecosystem processes than is structural diversity per se. The challenge for future investigations is to identify functional traits that affect ecosystem processes in multiple environmental contexts. It is generally assumed that the vast majority of species in the deep sea are rare (Gaston, 1994). In general, the number of rare species in marine systems seems to increase with withinsite and between-site heterogeneity, and to be characterized by habitat-specific species with restricted ranges (Mouillot et al., 2013). Key ecosystem processes may be threatened by the loss of species, many of which may be “rare” and perform specific functions (Mouillot et al., 2013). Some studies have reported that their loss can in fact influence local ecosystem processes and that rare species can contribute significantly to long-term and large-scale ecosystem functioning (Lyons et al., 2005). Altogether, the consequences of losing rare species on ecosystem functioning are still to be explored (Jain et al., 2014). We believed that further research devoted to the investigation of the effect of biodiversity, particularly functional diversity, on ecosystem functioning cannot avoid including the issue of “rarity.”
FIGURE 4 | Basin-scale relationships between macrofauna functional diversity and ecosystem functioning. Relationship between functional diversity, expressed as expected richness of deposit feeders (EDF(30) ) and expected predator richness (EPR(20) ), and ecosystem functioning, expressed as total benthic biomass (mgC/m2 ). The equations of the fitting line are respectively (A) y = e∧(6.67−4.83x) (N = 9; R2 = 0.98; p < 0.01) and (B) y = x∧2.71 (N = 9; R2 = 0.61; p < 0.05) in the Atlantic Ocean and (C) y = e∧(−1.60+2.82x) (N = 27; R2 = 0.98; p < 0.01) in the Western Mediterranean basin.
and ecosystem functioning was not found in the other two areas (ATL and c-eM basin), as on the large scale. In the deep Mediterranean Sea, the west-east gradient of decreasing surface water productivity is reflected by both a decreasing amount of food reaching the seafloor (D’Ortenzio and Ribera d’Alcalà, 2009), and in a decreasing abundance of deep-sea benthic populations (Coll et al., 2010; see also Table 2). The environmental effects were strong in the c-eM basin, where most relationships were context-dependent. Indeed, environmental conditions, such as food depletion or current regime have been reported to be major factors influencing and structuring benthic populations in the Eastern Mediterranean (Tselepides et al., 2000; Króncke et al., 2003; Tecchio et al., 2011; Giovannelli et al., 2013). Furthermore, Zeppilli et al. (2016) showed that the high sea floor heterogeneity along an open slope system may shape BEF relationships, even on a very small spatial scale. In our study, we considered seven slope systems spread across a wide longitudinal range from the Atlantic Ocean to the east Mediterranean basin. The heterogeneity of the substrate was assessed through the grain size analysis, but we know that Frontiers in Marine Science | www.frontiersin.org
13
June 2017 | Volume 4 | Article 198
Baldrighi et al.
Macrofauna Diversity - Ecosystem Functioning Relationship
AUTHOR CONTRIBUTIONS
ACKNOWLEDGMENTS
EB, EM, and ML designed the research; EB and ML performed the research; EB, GD, and DG analyzed the data; EB, and EM wrote the manuscript; EB, GD, and DG prepared tables and figures; EM, GD, ML, and DG critically reviewed the manuscript.
The authors are grateful to the crews of ships R/V Pelagia (The Netherlands), R/V Urania (Italy), and R/V Meteor (Germany) for their help during sampling activities. The authors acknowledge all the constructive suggestions of two reviewers that helped us to significantly improve an early version of our manuscript. An early version of this paper was submitted to Biogeosciences and rejected. The rejected copy and interactive discussion are available at http://www.biogeosciences-discuss.net/bg-2016-26/.
FUNDING This study is part of the ESF EuroDEEP project BIOFUN (CTM2007-28739-E); writing of the manuscript was supported by BALMAS (IPA ADRIATIC project; 1uSTR/0005). DG was supported by a C-DEBI (Center for Dark Energy Biosphere Investigation) postdoctoral fellowship.
SUPPLEMENTARY MATERIAL The Supplementary Material for this article can be found online at: http://journal.frontiersin.org/article/10.3389/fmars. 2017.00198/full#supplementary-material
REFERENCES
Braeckman, U., Provoost, P., Gribsholt, B., Van Gasbeke, D., Middelburg, J. J., Soetaert, K., et al. (2010). Role of macrofauna functional traits and density in biogeochemical fluxes and bioturbation. Mar. Ecol. Prog. Ser. 399, 173–186. doi: 10.3354/meps08336 Bremner, J. (2008). Species’ traits and ecological functioning in marine conservation and management. J. Exp. Mar. Biol. Ecol. 366, 37–47. doi: 10.1016/j.jembe.2008.07.007 Bremner, J., Rogers, S. I., and Frid, C. L. J. (2003). Assessing functional diversity in marine benthic ecosystems: a comparison of approaches. Mar. Ecol. Prog. Ser. 254, 11–25. doi: 10.3354/meps254011 Cardinale, B. J., Duffy, J. E., Gonzalez, A., Hooper, D. U., Perrings, C., Venail, P., et al. (2012). Biodiversity loss and its impact on humanity. Nature 486, 59–67. doi: 10.1038/nature11148 Cardinale, B. J., Matulich, K. M., Hooper, D. U., Byrnes, J. E., Duffy, E., Gamfeldt, L., et al. (2011). The functional role of producer diversity in ecosystems. Am. J. Bot. 98, 572–592. doi: 10.3732/ajb.1000364 Cardinale, B. J., Nelson, K., and Palmer, M. A. (2000). Linking species diversity to the functioning of ecosystems: on the importance of environmental context. Oikos 91, 175–183. doi: 10.1034/j.1600-0706.2000.910117.x Cardinale, B. J., Palmer, M. A., and Collins, S. L. (2002). Species diversity enhances ecosystem functioning through interspecific facilitation. Nature 415, 426–429. doi: 10.1038/415426a Cardinale, B. J., Wright, J. P., Cadotte, M. W., Carroll, I. T., Hector, A., Srivastava, D. S., et al. (2007). Impacts of plant diversity on biomass production increase through time because of species complementarity. Proc. Natl. Acad. Sci. U.S.A. 104, 18123–18128. doi: 10.1073/pnas.0709069104 Carney, R. S. (1997). Basing conservation policies for the deep-sea floor on currentdiversity concepts: a consideration of rarity. Biodiv. Conserv. 6, 1463–1485. doi: 10.1023/A:1018310302215 Carvalho, R., Wei, C. L., Rowe, G., and Schulze, A. (2013). Complex depth-related patterns in taxonomic and functional diversity of polychaetes in the Gulf of Mexico. Deep-Sea Res. I. 80, 66–77. doi: 10.1016/j.dsr.2013.07.002 Coll, M., Piroddi, C., Steenbeek, J., Kaschner, K., Ben Rais Lasram, F., Aguzzi, J., et al. (2010). The biodiversity of the mediterranean sea: estimates, patterns, and threats. PLoS ONE 5:e11842. doi: 10.1371/journal.pone.0011842 Cusson, M., and Bourget, E. (2005). Global patterns of macroinvertebrate production in marine benthic habitats. Mar. Ecol. Prog. Ser. 297, 1–14. doi: 10.3354/meps297001 Cusson, M., Crowe, T. P., Araújo, R., Arenas, F., Aspden, R., Bulleri, F., et al. (2015). Relationships between biodiversity and the stability of marine ecosystems: comparisons at a European scale using meta-analysis. J. Sea Res. 98, 5–14. doi: 10.1016/j.seares.2014.08.004 D’Ortenzio, F., and Ribera d’Alcalà, M. (2009). On the trophic regimes of the Mediterranean Sea: a satellite analysis. Biogeosciences 6, 139–148. doi: 10.5194/bg-6-139-2009 Danovaro, R. (2010). Methods for the Study of Deep-Sea Sediments, Their Functioning and Biodiversity. New York, NY: Taylor & Francis Group.
Akaike, H. (1974). A new look at the statistical model identification. IEEE Trans. Autom. Contr. 19, 716–723. doi: 10.1109/TAC.1974.1100705 Amaro, T., Bianchelli, S., Billett, D. S. M., Cunha, R. M., Pusceddu, A., and Danovaro, R. (2010). The trophic biology of the holothurian Molpadia musculus: implications for organic matter cycling and ecosystem functioning in a deep submarine canyon. Biogeosciences 7, 2419–2432. doi: 10.5194/bg-7-2419-2010 Anderson, M. J. (2001). Permutation tests for univariate or multivariate analysis of variance and regression. Can. J. Fish. Aquat. Sci. 58, 626–639. doi: 10.1139/f01-004 Anderson, M. J. (2004). Dros. Inf. Serv. TLM version 5: A FORTRAN Computer Program to Calculate a Distance-Based Multivariate Analysis for a Linear Model. Auckland: University of Auckland. Armstrong, C. W., Foley, N. S., Tinch, R., and van den Hove, S. (2012). Services from the deep: steps towards valuation of deep sea goods and services. Ecol. Ser. 2, 2–13. doi: 10.1016/j.ecoser.2012.07.001 Baldrighi, E., Lavaleye, M., Aliani, S., Conversi, A., and Manini, E. (2014). Large spatial scale variability in bathyal macrobenthos abundance, biomass, α- and βdiversity along the Mediterranean continental margin. PLoS ONE 9:e107261. doi: 10.1371/journal.pone.0107261 Baldrighi, E., and Manini, E. (2015). Deep-sea meiofauna and macrofauna diversity and functional diversity: are they related? Mar. Biodiv. 45, 469–488. doi: 10.1007/s12526-015-0333-9 Barnes, S. R. K., and Hamylton, S. (2015). Uniform functional structure across spatial scales in an intertidal benthic assemblage. Mar. Envir. Res. 106, 89–91. doi: 10.1016/j.marenvres.2015.03.006 Belly, R., and Snelgrove, P. V. R. (2016). Relative contribution of biodiversity and environment to benthic ecosystem functioning. Front. Mar. Sci. 3:242. doi: 10.3389/fmars.2016.00242 Bergamasco, A., and Malanotte-Rizzoli, P. (2010). The circulation of the Mediterranean Sea: a historical review of experimental investigations. Adv. Oceanogr. Limnol. 1, 11–28. doi: 10.4081/aiol.2010.5293 Biles, C. L., Solan, M., Isaksson, I., Paterson, D. M., Emes, C., and Raffaelli, D. G. (2003). Flow modifies the effect of biodiversity on ecosystem functioning: an in situ study of estuarine sediments. J. Exper. Mar. Biol. Ecol. 285/286, 165–177. doi: 10.1016/S0022-0981(02)00525-7 Bolam, S. G. (2013). Relationships between Macroinvertebrate Biological Traits and Sea Bed Functioning in European waters. FP7 BENTHIS Task 1.1a Final Report (25 pp.). Bolam, S. G., Barrio Froján, C. R. S., and Eggleton, J. D. (2010). Macrofaunal production along the UK continental shelf. J. Sea Res. 64, 166–179. doi: 10.1016/j.seares.2010.02.003 Bolam, S. G., and Eggleton, J. D. (2014). Macrofaunal production and biological traits: spatial relationships along the UK continental shelf. J. Sea Res. 88, 47–58. doi: 10.1016/j.seares.2014.01.001
Frontiers in Marine Science | www.frontiersin.org
14
June 2017 | Volume 4 | Article 198
Baldrighi et al.
Macrofauna Diversity - Ecosystem Functioning Relationship
Lefcheck, J. S., and Duffy, J. E. (2014). Multitrophic functional diversity predicts ecosystem functioning in experimental assemblages of estuarine consumers. PeerJ. PrePrints 2:e540v1. doi: 10.7287/peerj.preprints.540v1 Lefcheck, J. S., and Duffy, J. E. (2015). Multitrophic functional diversity predicts ecosystem functioning in experimental assemblages of estuarine consumers. Ecology 96, 2973–2983. doi: 10.1890/14-1977.1 Levin, L. A., Etter, R. J., Rex, M. A., Gooday, A. J., Smith, C. R., and Pineda, J. (2001). Environmental influences on regional deep-sea species diversity. Annu. Rev. Ecol. Sys. 32, 51–93. doi: 10.1146/annurev.ecolsys.32.081501.114002 Levin, L. A., James, D. W., Martin, C. M., Rathburn, A. E., Harris, L. H., and Michener, R. H. (2000). Do methane seeps support distinct macrofaunal assemblages? Observations on community structure and nutrition from the northern California slope and shelf. Mar. Ecol. Prog. Ser. 208, 21–39. doi: 10.3354/meps208021 Levin, L. A., Liu, K.-K., Emeis, K.-C., Breitburg, D. L., Cloern, J., Deutsch, C., et al. (2015). Comparative biogeochemistry-ecosystem-human interactions on dynamic continental margins. J. Mar. Syst. 141, 3–17. doi: 10.1016/j.jmarsys.2014.04.016 Levin, L. A., and Sibuet, M. (2012). understanding continental margin biodiversity: a new imperative. Ann. Rev. Mar. Sci. 4, 79–112. doi: 10.1146/annurev-marine-120709-142714 Loreau, M. (2000). Biodiversity and ecosystem functioning: recent theoretical advances. Oikos 91, 3–17. doi: 10.1034/j.1600-0706.2000.910101.x Loreau, M. (2008). Biodiversity and ecosystem functioning: the mystery of the deep sea. Curr. Biol. 18, 126–128. doi: 10.1016/j.cub.2007.11.060 Loreau, M. (2010). Linking biodiversity and ecosystems: towards a unifying ecological theory. Phil. Tran. R. Soc. B. 365, 49–60. doi: 10.1098/rstb.2009.0155 Luna, G. M., Manini, E., and Danovaro, R. (2002). Large fraction of dead and inactive bacteria in coastal marine sediments: comparison of protocols for determination and ecological significance. Appl. Environ. Microbiol. 68, 3509–3513. doi: 10.1128/AEM.68.7.3509-3513.2002 Lyons, K. G., Brigham, C. A., Traut, B. H., and Schwartz, M. W. (2005). Rare species and ecosystem functioning. Conserv. Biol. 19, 1019–1024. doi: 10.1111/j.1523-1739.2005.00106.x McCauley, D. J., Pinsky, M. L., Palumbi, S. R., Estes, J. A., Joyce, F. H., and Warner, R. R. (2015). Marine defaunation: animal loss in the global ocean. Science 347:1255641. doi: 10.1126/science.1255641 Menot, L., Sibuet, M., Carney, R. S., Levin, L. A., Rowe, G. T., Billett, D. S. M., et al. (2010). “New perceptions of continental margin biodiversity,” in Life in the World’s Oceans, ed A. D. McIntyre (Oxford: Wiley-Blackwell), 79–102. Meysman, F. G. R., Middelburg, J. J., and Heip, C. H. R. (2006). Bioturbation: a fresh look at Darwin’s last idea. Trends Ecol. Evol. 21, 687–695. doi: 10.1016/j.tree.2006.08.002 Miller, R. J., Hocevar, J., Stone, R. P., and Fedorov, D. V. (2012). Structureforming corals and sponges and their use as fish habitat in Bering sea submarine canyons. PLoS ONE 7:e33885. doi: 10.1371/journal.pone.0033885 Mineur, F., Arenas, F., Assis, J., Davies, A. J., Engelen, A. H., Fernandes, F., et al. (2014). European seaweeds under pressure: consequences for communities and ecosystem functioning. J. Sea Res. 98, 91–108 doi: 10.1016/j.seares.2014.11.004 Mora, C., Aburto-Oropeza, O., Ayala Bocos, A., Ayotte, P. M., Banks, S., Bauman, A. G., et al. (2011). Global human footprint on the linkage between biodiversity and ecosystem functioning in reef fishes. PLoS Biol. 9:e1000606. doi: 10.1371/journal.pbio.1000606 Mora, C., Danovaro, R., and Loreau, M. (2014). Alternative hypotheses to explain why biodiversity-ecosystem functioning relationships are concave-up in some natural ecosystems but concave-down in manipulative experiments. Sci. Rep. 4:5427. doi: 10.1038/srep05427 Mouillot, D., Bellwood, D. R., Baraloto, C., Chave, J., Galzin, R., Harmelin-Vivien, R., et al. (2013). Rare species support vulnerable functions in high-diversity ecosystems. PLoS Biol. 11:e1001569. doi: 10.1371/journal.pbio.1001569 Naeem, S., Thompson, L. J., Lawler, S. P., Lawton, J. H., and Woodfin, R. M. (1994). Declining biodiversity can alter the performance of ecosystems. Nature 368, 734–736. doi: 10.1038/368734a0 Naeem, S., Thompson, L. J., Lawler, S. P., Lawton, J. H., and Woodfin, R. M. (1995). Empirical evidence that declining species diversity may alter the performance of terrestrial ecosystems. Philos. T. Roy. Soc. B 347, 249–262. doi: 10.1098/rstb.1995.0025
Danovaro, R. (2012). “Extending the approaches of biodiversity and ecosystem functioning to the deep ocean,” in Marine Biodiversity and Ecosystem Functioning: Frameworks, Methodologies and Integration, eds M. Solan, R. J. Aspden, and D. M. Paterson (Oxford: Oxford University Press), 113–124. Danovaro, R., Dell’Anno, A., Corinaldesi, C., Magagnini, M., Noble, R., Tamburini, C., et al. (2008b). Major viral impact on the functioning of benthic deep-sea ecosystems. Nature 454, 1084–1088. doi: 10.1038/nature07268 Danovaro, R., Gambi, C., Dell’Anno, A., Corinaldesi, C., Fraschetti, S., Vanreusel, A., et al. (2008a). Exponential decline of deep-sea ecosystem functioning linked to benthic biodiversity loss. Curr. Biol. 18, 1–8. doi: 10.1016/j.cub.2007.11.056 De Jonge, V. N. (1980). Fluctuations in the organic carbon to chlorophyll a ratios for estuarine benthic diatom populations. Mar. Ecol. Prog. Ser. 2, 345–353. doi: 10.3354/meps002345 De Mesel, I., Derycke, S., Swings, J., Vincx, M., and Moens, T. (2006). Role of nematodes in decomposition processes: does within trophic group diversity matter? Mar. Ecol.Prog. Ser. 321, 157–166. doi: 10.3354/meps321157 Dunne, J. A., Williams, R. J., and Martinez, N. D. (2002). Network structure and biodiversity loss in food webs: robustness increases with connectance. Ecol. Lett. 5, 558–567. doi: 10.1046/j.1461-0248.2002.00354.x Etter, R. J., and Grassle, J. F. (1992). Patterns of species diversity in the deep sea as a function of sediment particle size diversity. Nature 360, 576–578. doi: 10.1038/360576a0 Fabiano, M., Danovaro, R., and Fraschetti, S. (1995). A three-year time series of elemental and biochemical composition of organic matter in subtidal sandy sediments of the Ligurian Sea (northwestern Mediterranean). Cont. Shelf Res. 15, 1453–1469. doi: 10.1016/0278-4343(94)00088-5 Fry, J. C. (1990). Determination of Biomass. Methods in Aquatic Bacteriology. New York, NY: John Wiley & Sons. Gage, J. D., and Tyler, P. A. (1991). Deep-Sea Biology: A Natural History of Organisms at the Deep Sea Floor. Cambridge: Cambridge University Press. Gamfeldt, L., Lefcheck, J. S., Byrnes, J. E. K., Cardinale, B. J., Duffy, J. E., and Griffin, J. N. (2014). Marine biodiversity and ecosystem functioning: what’s known and what’s next? OIKOS 124, 252–265. doi: 10.1111/oik.01549 Gaston, K. J. (1994). Rarity. London: Chapman & Hall. Giovannelli, D., Molari, M., d’Errico, G., Baldrighi, E., Pala, C., and Manini, E. (2013). Large-scale distribution and activity of prokaryotes in deep-sea surface sediments of the Mediterranean sea and the adjacent Atlantic Ocean. PLoS ONE 8:e72996. doi: 10.1371/journal.pone.0072996 Grassle, J. F., and Maciolek, N. J. (1992). Deep-sea species richness: regional and local diversity estimates from quantitative bottom samples. Am. Natural. 139, 313–341. doi: 10.1086/285329 Gravel, D., Bell, T., Barbera, C., Bouvier, T., Pommier, T., Venail, P., et al. (2010). Experimental niche evolution alters the strength of the diversity productivity relationship. Nature 469, 89–92. doi: 10.1038/nature09592 Hiddink, J. G., Wynter Davies, T., Perkins, M., Machairopoulou, M., and Neill, S. P. (2009). Context dependency of relationships between biodiversity and ecosystem functioning is different for multiple ecosystem functions. Oikos 118, 1892–1900. doi: 10.1111/j.1600-0706.2009.17556.x Hooper, D. U., Chapin, F. S. III, Ewel, J. J., Hector, A., Inchausti, P., Lawton, J. H., et al. (2005). Effects of biodiversity on ecosystem functioning: a consensus of current knowledge. Ecol. Monogr. 75, 3–35. doi: 10.1890/04-0922 Ieno, E. N., Solan, M., Batty, P., and Pierce, G. J. (2006). How biodiversity affects ecosystem functioning: roles of infaunal species richness, identity and density in the marine benthos. Mar. Ecol. Progr. Ser. 31, 263–271. doi: 10.3354/meps311263 Jain, M., Flynn, D. F. B., Prager, C. M., Hart, G. M., DeVan, C. M., Ahrestani, F. S., et al. (2014). The importance of rare species: a trait-based assessment of rare species contributions to functional diversity and possible ecosystem function in tall-grass prairies. Ecol. Evol. 4, 104–112. doi: 10.1002/ece3.915 Jax, K. (2005). Function and “functioning” in ecology: what does it mean? Oikos 111, 641–648. doi: 10.1111/j.1600-0706.2005.13851.x Króncke, I., Türkay, M., and Fiege, D. (2003). Macrofauna communities in the eastern Mediterranean deep sea. Mar. Ecol. 24, 193–206. doi: 10.1046/j.0173-9565.2003.00825.x Leduc, D., Rowden, A. A., Pilditch, C. A., Maas, E. W., and Probert, P. K. (2013). Is there a link between deep-sea biodiversity and ecosystem function? Mar. Ecol. 34, 334–344. doi: 10.1111/maec.12019
Frontiers in Marine Science | www.frontiersin.org
15
June 2017 | Volume 4 | Article 198
Baldrighi et al.
Macrofauna Diversity - Ecosystem Functioning Relationship
Reiss, J., Bridle, J. R., Montoya, J. M., and Woodward, G. (2009). Emerging horizons in biodiversity and ecosystem functioning research. Trends Ecol. Evol. 24, 505–514. doi: 10.1016/j.tree.2009.03.018 Rex, M. A., and Etter, R. J. (2010). Deep-Sea Biodiversity: Pattern and Scale. Cambridge: Harvard University Press. Rex, M. A., Etter, R. J., Morris, J. S., Crouse, J., McClain, C. N., Johnson, N. A., et al. (2006). Global bathymetric patterns of standing stock and body size in the deep-sea benthos. Mar. Ecol. Prog. Ser. 317, 1–8. doi: 10.3354/meps 317001 Roberts, J. M., Wheeler, A. J., and Freiwald, A. (2006). Reefs of the deep: the biology and geology of cold-water coral ecosystems. Science 312, 543–547. doi: 10.1126/science.1119861 Rowe, G. T. (1983). Deep-Sea Biology. New York, NY: John Wiley & Sons. Sardà, F., Calafat, A., Flexas, M. M., Tselepides, A., Canals, M., Espino, M., et al. (2004). An introduction to the Mediterranean deep-sea. Sci. Mar. 68, 7–38. doi: 10.3989/scimar.2004.68s37 Schlitzer, R. (2011). Ocean Data View. Available online at: http://odv.awi.de Serpetti, N., Gontikaki, E., Narayanaswamy, B. E., and Witte, U. (2013). Macrofaunal community inside and outside of the Darwin Mounds Special Area of Conservation, NE Atlantic. Biogeosciences 10, 3705–3714. doi: 10.5194/bg-10-3705-2013 Shields, M. A., and Hughes, D. J. (2009). Large-scale variation in macrofaunal communities along the eastern Nordic seas continental margin: a comparison of four stations with contrasting food supply. Progr. Oceanogr. 82, 125–136. doi: 10.1016/j.pocean.2009.05.001 Smith, C. R., De Leo, F. C., Bernardino, A. F., Sweetman, A. K., and Arbizu, P. M. (2008). Abyssal food limitation, ecosystem structure and climate change. Trends Ecol. Evol. 23, 518–528. doi: 10.1016/j.tree.2008. 05.002 Snelgrove, P. V. R., Thrush, S. F., Wall, D. H., and Norkko, A. (2014). Real world biodiversity–ecosystem functioning: a seafloor perspective. Trends Ecol. Evol. 29, 398–405. doi: 10.1016/j.tree.2014.05.002 Soetaert, K., and Heip, C. (1990). Sample-size dependence of diversity indices and the determination of sufficient sample size in a high-diversity deepsea environment. Mar. Ecol. Prog. Ser. 59, 305–307. doi: 10.3354/meps 059305 Tecchio, S., Ramirez-Llodra, E., Sarda, F., Company, J. B., Palomera, I., and Mecho, A. (2011). Drivers of deep Mediterranean megabenthos communities along longitudinal and bathymetric gradients. Mar. Ecol. Prog. Ser. 439, 181–219. doi: 10.3354/meps09333 Thurber, A. R., Sweetman, A. K., Narayanaswamy, B. E., Jones, D. O. B., Ingels, J., and Hansman, L. R. (2014). Ecosystem function and services provided by the deep sea. Biogeosciences 11, 3941–3963. doi: 10.5194/bg-11-3941-2014 Tilman, D., Isbell, F., and Cowles, J. M. (2014). Biodiversity and ecosystem functioning. Annu. Rev. Ecol. Evol. Syst. 45, 71–93. doi: 10.1146/annurev-ecolsys-120213-091917 Tittensor, D. P., Rex, M. A., Stuart, C. T., McClain, C. R., and Smith, C. R. (2011). Species–energy relationships in deep-sea molluscs. Biol. Lett. 7, 718–722. doi: 10.1098/rsbl.2010.1174 Tselepides, A., Papadopoulou, K.-N., Podaras, D., Plaiti, W., and Koutsoubas, D. (2000). Macrobenthic community structure over the continental margin of Crete (South Aegean Sea, NE Mediterranean). Progr. Oceanogr. 46, 401–428. doi: 10.1016/S0079-6611(00)00027-6 Tyler, P. A. (ed.). (2003). “The peripheral deep seas,” in Ecosystems of the World (Amsterdam: Elsevier), 261–293. Tylianakis, J. M., Rand, T. A., Kahmen, A., Klein, A.-M., Buchmann, N., Perner, J., et al. (2008). Resource heterogeneity moderates the biodiversityfunction relationship in real world ecosystems. PLoS Biol. 6:e122. doi: 10.1371/journal.pbio.0060122 Van Oevelen, D., Middelburg, J. J., Soetaert, K., and Moodley, L. (2006). The fate of bacterial carbon in an intertidal sediment: modelling an in situ isotope tracer experiment. Limnol. Oceanogr. 5, 1302–1314. doi: 10.4319/lo.2006.51. 3.1302 Venail, P. A., MacLean, R. C., Bouvier, T., Brockhurst, M. A., Hochberg, M. E., and Mouquet, N. (2008). Diversity and productivity peak at intermediate dispersal rate in evolving metacommunities. Nature 452, 210–257. doi: 10.1038/nature06554
Naeem, S., and Wright, J. P. (2003). Disentangling biodiversity effects on ecosystem functioning: deriving solutions to a seemingly insurmountable problem. Ecol. Lett. 6, 567–579. doi: 10.1046/j.1461-0248.2003.00471.x Narayanaswamy, B. E., Coll, M., Danovaro, R., Davidson, K., Ojaveer, H., and Renaud, P. E. (2013). Synthesis of knowledge on marine biodiversity in european seas: from census to sustainable management. PLoS ONE 8:e58909. doi: 10.1371/journal.pone.0058909 Ngai, J. T., and Srivastava, D. S. (2006). Predators accelerate nutrient cycling in a bromeliad ecosystem. Science 314:963. doi: 10.1126/science.1132598 O’Brien, R. M. (2007). A caution regarding rules of thumb for variance inflation factors. Qual. Quan. 41, 673–690. doi: 10.1007/s11135-006-9018-6 O’Connor, N. E., and Crowe, T. P. (2005). Biodiversity loss and ecosystem functioning: distinguishing between number and identity of species. Ecology 86, 1783–1796. doi: 10.1890/04-1172 O’Connor, N. E., and Donohue, I. (2013). Environmental context determines multi-trophic effects of consumer species loss. Glob. Chang. Biol. 19, 431–440. doi: 10.1111/gcb.12061 Pakeman, R. J. (2011). Multivariate identification of plant functional response and effect traits in an agricultural landscape. Ecology. 92, 1353–1365. doi: 10.1890/10-1728.1 Pape, E., Bezerra, T. N., Jones, D. O. B., and Vanreusel, A. (2013). Unravelling the environmental drivers of deep-sea nematode biodiversity and its relation with carbon mineralisation along a longitudinal primary productivity gradient. Biogeosciences 10, 3127–3143. doi: 10.5194/bg-10-3127-2013 Pearson, T. H., and Rosenberg, R. (1987). “Feast and famine: structuring factors in marine benthic communities,” in Organization of Communities Past and Present, eds J. Gee and P. Giller (Oxford: Blackwell Scientific Publications), 373–395. Petchey, O. L., Hector, A., and Gaston, K. J. (2004). How do different measures of functional diversity perform? Ecology 85, 847–857. doi: 10.1890/03-0226 Piot, A., Nozais, C., and Archambault, P. (2014). Meiofauna affect the macrobenthic biodiversity– ecosystem functioning relationship. Oikos 123, 203–213. doi: 10.1111/j.1600-0706.2013.00631.x Poorter, L., van der Sande, M. T., Thompson, J., Arets, E. J. M. M., Alarcón, A., Álvarez-Sánchez, J., et al. (2015). Diversity enhances carbon storage in tropical forests. Global Ecol. Biogeogr. 24, 1314–1328. doi: 10.1111/ geb.12364 Pusceddu, A., Bianchelli, S., Canals, M., Sanchez-Vidal, A., Durrieu De Madron, X., Heussner, S., et al. (2010). Organic matter in sediments of canyons and open slopes of the Portuguese, Catalan, Southern Adriatic and Cretan Sea margins. Deep Sea Res. Part I Oceanogr. Res. Pap. 57, 441–457. doi: 10.1016/j.dsr.2009.11.008 Pusceddu, A., Bianchelli, S., Martìn, J., Puig, P., Palanques, A., Masqué, P., et al. (2014b). Chronic and intensive bottom trawling impairs deep-sea biodiversity and ecosystem functioning. Proc. Natl. Acad. Sci. U.S.A. 111, 8861–8866. doi: 10.1073/pnas.1405454111 Pusceddu, A., Gambi, C., Corinaldesi, C., Scopa, M., and Danovaro, R. (2014a). Relationships between meiofaunal biodiversity and prokaryotic heterotrophic production in different tropical habitats and oceanic regions. PLoS ONE 9:e91056. doi: 10.1371/journal.pone.0091056 Queirós, A. M., Birchenough, S. N. R., Bremner, J., Godbold, J. A., Parker, R. E., Romero-Ramirez, A., et al. (2013). A bioturbation classification of European marine infaunal invertebrates. Ecol. Evol. 3, 3958–3985. doi: 10.1002/ ece3.769 Quéiros, A. M., Stephens, N., Cook, R., Ravaglioli, C., Nunes, J., Dashfield, S., et al. (2015). Can benthic community structure be used to predict the process of bioturbation in real ecosystems? Prog. Oceanogr. 137, 559–569. doi: 10.1016/j.pocean.2015.04.027 Quinn, P. Q., and Keough, M. J. (2009). Experimental Design and Data Analysis for Biologists. Cambridge: Cambridge University Press. Ramirez-Llodra, E., Brandt, A., Danovaro, R., De Mol, B., Escobar, E., German, C. R., et al. (2010). Deep, diverse and definitely different: unique attributes of the world’s largest ecosystem. Biogeosciences 7, 2851–2899. doi: 10.5194/bg-7-2851-2010 Reich, P. B., Tilman, D., Isbell, F., Mueller, K., Hobbie, S. E., Flynn Dan, F. B., et al. (2012). Impacts of biodiversity loss escalate through time as redundancy fades. Science 336, 589–592. doi: 10.1126/science.1217909
Frontiers in Marine Science | www.frontiersin.org
16
June 2017 | Volume 4 | Article 198
Baldrighi et al.
Macrofauna Diversity - Ecosystem Functioning Relationship
Welsh, D. T. (2003). It’s a dirty job but someone has to do it: the role of marine benthic macrofauna in organic matter turnover and nutrient recycling to the water column. Chem. Ecol. 19, 321–342. doi: 10.1080/02757540310001 55474 Worm, B., Barbier, E. B., Beaumont, N., Duffy, J. E., Folke, C., Halpern, B. S., et al. (2006). Impacts of biodiversity loss on ocean ecosystem services. Science 314, 287–290. doi: 10.1126/science.1132294 Yasuhara, M., Doi, H., Wei, C.-L., Danovaro, R., and Myhre, S. E. (2016). Biodiversity–ecosystem functioning relationships in longterm time series and palaeoecological records: deep sea as a test bed. Philos. Trans. R. Soc. B 371:20150282. doi: 10.1098/rstb.20 15.0282 Zeppilli, D., Pusceddu, A., Trincardi, F., and Danovaro, R. (2016). Seafloor heterogeneity influences the biodiversity-ecosystem functioning relationship in the deep-sea. Sci. Rep. 6:26352. doi: 10.1038/srep26352
Frontiers in Marine Science | www.frontiersin.org
Conflict of Interest Statement: The handling Editor declared a shared affiliation, though no other collaboration, with one of the authors GD, and the handling Editor states that the process met the standards of a fair and objective review. The other authors declare that the research was conducted in the absence of any commercial or financial relationships that could be construed as a potential conflict of interest. Copyright © 2017 Baldrighi, Giovannelli, D’Errico, Lavaleye and Manini. This is an open-access article distributed under the terms of the Creative Commons Attribution License (CC BY). The use, distribution or reproduction in other forums is permitted, provided the original author(s) or licensor are credited and that the original publication in this journal is cited, in accordance with accepted academic practice. No use, distribution or reproduction is permitted which does not comply with these terms.
17
June 2017 | Volume 4 | Article 198