SCHLIEREN STUDY OF EXTERNAL AIRFLOW DURING THE PRODUCTION OF NASAL AND ORAL VOWELS IN FRENCH Jeffrey Rowell*1, Masaki Noguchi**2, B. May Bernhardt***1, Anthony T. Herdman****1, Bryan Gick†2 and Murray Schellenberg‡2 University of British Columbia (1Audiology and Speech Sciences; 2Department of Linguistics)
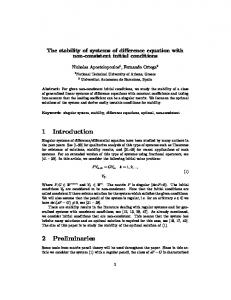
1. Introduction Schlieren imaging enables real-time visualization of airflow through refraction of light. The potential of schlieren imaging for speech research was first proposed nearly 40 years ago [1]. A recent study tested this proposal [2]. Phonetically trained raters coded schlieren recordings of French vowels as oral versus nasal [2] (Figure 1). Although raters discriminated between the oral and nasal vowels (p < .05), the study could not fully determine whether the perceptual ratings were based on airflow patterns alone. Thus, the current study was undertaken to investigate optical flow analysis in detecting differences between oral and nasal airflow patterns in the same schlieren recordings. Results show that nasal vowels are produced with a larger magnitude of nasal airflow than oral vowels, with some variation between speakers.
by selecting recordings with the greatest number of still frames immediately preceding initiation of /p/.
Oral Vowels
Nasal Vowels
/pa/
/pɑ̃/
/pɛ/
/pɛ/̃
/po/
/pɔ̃/
2. Method 2.1. Equipment The schlieren system was based a single mirror setup used in previous research [3][4]. The system consisted of: (1) a 12-inch diameter spherical mirror with a focal length of 8 feet attached to an optical mirror mount allowing horizontal and vertical adjustments; (2) a battery-powered pinhole LED light source affixed on top of a camera; (3) a video camera capable of recording in high definition at 60 frames per second; and (4) a razor blade attached to an adjustable optics mount which permitted fine tuning of the blade’s position. Participants were positioned to minimize distance between the mirror and speech airflow while also preventing accidental contact with the mirror. Participants held a piece of cardboard to redirect background airflow (i.e. heat rising from the participants’ chest and legs) away from the mirror.
2.2. Participants and Recordings Analysis was conducted on the same recordings from the previous perceptual study [2]. Nine native speakers of French were recorded reading a list of oral/nasal minimal pairs adapted from previous research [5] (pas/paon, paix/pain, pot/pont). Words were recorded three times. In order to reduce the burden on perceptual raters in the initial study, only one token per word, per participant was selected. Potentially confounding background airflow was minimized * ** *** **** † ‡
[email protected] [email protected] [email protected] [email protected] [email protected] [email protected]
Figure 1: Schlieren recordings demonstrating the visual difference in airflow between oral and nasal vowels. Oral vowels show a single stream of airflow from the mouth and nasal vowels, two streams from both the nose and mouth.
2.3. Analysis Airflow in the schlieren videos was measured using the Horn and Schunk’s optical flow algorithm [6] implemented with the OpenCV [7]. The algorithm takes two consecutive video frames and calculates the direction and magnitude (i.e., speed) of each pixel’s movement from one frame to the next (i.e., the displacement vector of the pixel). Displacement vectors are calculated for all pixels within an area of interest (AOI), and the sum of the displacement vectors was used as the measure of optical flow within the AOI.
air turbulence caused by the progression of oral airflow into the AOI rather than an increase in nasal airflow. Speakers varied somewhat in nasal airflow patterns. For example, Speaker 1's nasal vowels had a gradual increase in nasal airflow across the vowel, whereas Speaker 6's nasal vowels showed notable nasal airflow from the onset of the vowel (Figure 4).
4. Discussion Figure 2. Area of Interest (AOI) for the measurement of nasal airflow In order to measure nasal airflow, an AOI was defined under the nose (Figure 2): the right side of the AOI was vertically aligned with the tip of the nose; the lower side of the AOI was horizontally aligned with the height of the upper lip. Airflow was measured during the production of the vowels. Because vowel tokens varied in duration, duration was normalized to percentage points. To compare the nasal airflow patterns of oral and nasal vowels, we obtained the dynamic measurements of the mean magnitude of airflow with 95% CI for oral and nasal vowels by applying a spline smoothing function (both with and across speakers) [8].
3. Results
Optical flow analysis of schlieren recordings shows promise in measurement of external airflow patterns of French oral and nasal vowels; nasal vowels were produced with a larger magnitude of nasal airflow than oral vowels. Airflow patterns varied between speakers, however, which suggests the need for further inquiry into relationships between airflow patterns and acoustic data across speakers. Schlieren imaging’s strength is its ability to visualize changes in the refractive index of transparent media. This is also a limiting factor because changes within a stream of air, particularly laminar flow, may be relatively stable compared to the airflow’s leading edge. For example, we observed that the magnitude of nasal airflow for nasal vowels became smaller at vowel offset, but this may not have been due to decreased nasal airflow. Once nasal airflow in a small AOI becomes laminar, optical flow analysis may be less sensitive to the flow. Flow visualization may therefore be limited to speech sounds with turbulent flow.
References
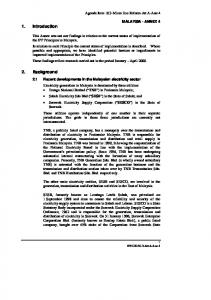
Figure 3. Magnitude of airflow for the oral (aqua) and nasal (red) vowels produced by nine French speakers
Figure 4. Magnitude of airflow for the oral (aqua) and nasal (red) vowels produced by Speaker 1 and Speaker 6 Figure 3 shows the magnitude of airflow for oral and nasal vowels across speakers. The magnitude of airflow at the onset of vowels was larger for nasal vowels than oral vowels, a consequence of greater nasal airflow in nasal vowels. The magnitude of airflow for nasal vowels became smaller at vowel offset. The magnitude of airflow for oral vowels became larger towards vowel offset. This apparently reflected
[1] Davies, T. P. Schlieren photography: a tool for speech research. Acoustics Letters 3 (1979): 73-75. [2] Rowell, J. Schlieren imaging: visualization of airflow in speech. Master's thesis, University of British Columbia, 2015. [3] Settles, G. S. Schlieren and shadowgraph techniques: visualizing phenomena in transparent media. Springer, 2001. [4] Tang, J. W., A. D. Nicolle, J. Pantelic, M. Jiang, C. Sekhr, D. K Cheong, and K. W. Tham. Qualitative real-time schlieren and shadowgraph imaging of human exhaled airflows: an aid to aerosol infection control. PLoS One 6, (2011): e21392. [5] Carignan, C. An acoustic and articulatory examination of the “oral” in “nasal”: The oral articulations of French nasal vowels are not arbitrary. Journal of Phonetics 46 (2014): 23-33. [6] Horn, B. K. P., and B. G. Schunck. Determining optical flow. Artificial intelligence 17, (1981): 185-203. [7] Barbosa, A. V., H. C. Yehia, and E. Vatikiotis-Bateson. Linguistically valid movement behavior measured noninvasively. In AVSP-2008, pp. 173-177. 2008. [8] Chong, G. Smoothing spline ANOVA models: R package gss. Journal of Statistical Software 58, (2014): 125.