THE ASTRONOMICAL JOURNAL, 119 : 1638È1644, 2000 April ( 2000. The American Astronomical Society. All rights reserved. Printed in U.S.A.
OPTICAL SURFACE PHOTOMETRY OF A SAMPLE OF DISK GALAXIES. I. OBSERVATIONS AND DATA REDUCTION1 J. A. L. AGUERRI, A. M. VARELA, M. PRIETO, AND C. MUN8 OZ-TUN8 O N Instituto de Astrof• sica de Canarias, Calle V• a Lactea s/n, E-38200 La Laguna, Tenerife, Spain Received 1998 June 30 ; accepted 2000 January 4
ABSTRACT We present accurate optical surface photometry in the U, B, V , R, and I passbands for 11 disk galaxies. The sample has been selected in order to study the di†erent morphological structures present in disk galaxies and includes all morphological types. For each galaxy, we present surface brightness, ellipticity, and position angle radial proÐles from ellipse Ðts to the isophotes. Color index images and color index proÐles in U[B, B[V , and B[I are also shown. The photometric information obtained is crucial to understanding the di†erent morphological structures presented in all these galaxies, and to obtain their mass distributions. The latter topic will be the subject of a forthcoming paper. Key words : galaxies : photometry È galaxies : spiral È galaxies : structure
1.
INTRODUCTION
Our main goal is to perform a structural and dynamical study for a sample of spiral galaxies with di†erent morphological types. We will make a detailed analysis of their structural components (e.g., disk, bulge, bar, ring, lens). The parameterization of these components will be made using ellipticity, position angle, and surface brightness isophotal proÐles for those galaxies without bar structures. Radial surface brightness proÐles along the bar axis will be used in the case of galaxies that have prominent bars. The deprojection of the observed photometric parameters will allow us to compute the three-dimensional structure of the bulge and bar, obtaining information about the spatial distribution. Applying di†erent mass-to-light ratios to each component, we will obtain the mass distribution of each galaxy and their gravitational potentials. This will be the starting point to construct dynamical models for these galaxies. In this Ðrst paper, we present the observations, the photometric information, and the two-dimensional characterization of all structural components that form the galaxies. In Paper II (Prieto et al. 2000), we will present the parameterization of these components. In a series of forthcoming papers we will develop the other issues.
Over the last few decades, bidimensional broadband photometry of disk galaxies has been used in order to arrive at a better understanding of galactic structure and dynamics. Such photometry has the advantage of being relatively easy to obtain and gives information about the spectral energy distribution of the object. A great deal of information can be derived from broadband photometry, including the stellar population (Searle, Sargent, & Bagnuolo 1973 ; Peletier et al. 1994 ; Silva & Elston 1994), dust content (Evans 1994 ; Peletier et al. 1994, 1995 ; de Jong 1996b), and structure of galaxies by splitting the surface brightness proÐles into their di†erent components. These light proÐles have often been decomposed only into a bulge and disk (Freeman 1970 ; Kormendy 1977 ; Boroson 1981 ; Kent 1986, 1987 ; Prieto et al. 1992 ; Caon, Capaccioli, & DÏOnofrio 1993). Nevertheless, there are now available better Ðtting techniques and high spatial resolution photometry in the optical and near-infrared, which allow us to obtain more accurate photometric information on the structure of galaxies (Prieto et al. 1997 ; Wozniak et al. 1995 ; Elmegreen et al. 1996 ; de Jong 1996a). The photometric parameters describing the light distribution of the components are of fundamental importance in the study of galaxy formation and evolution. Moreover, the bulge-to-disk ratio is related to the Hubble classiÐcation scheme (Simien & de Vaucouleurs 1986 ; Andredakis & Sanders 1994 ; de Jong 1996a). Knowledge of the geometries of di†erent galactic components allows us to derive their spatial source distribution (Stark 1977 ; Varela 1992 ; Simonneau, Varela, & Mun8 ozTun8 on 1993 ; Varela, Mun8 oz-Tun8 on, & Simonneau 1996) ; by assuming a mass-to-light ratio for the galaxy (Rubin, Ford, & Thonnard 1980 ; Rubin et al. 1982, 1985), the gravitational potential can also be obtained (Freeman 1970 ; Hunter et al. 1988), which is essential to the understanding of galactic dynamics.
2.
OBSERVATIONS AND DATA REDUCTION
Eleven bright galaxies were observed in 1990 August. The sample was selected taking into account the following : Morphological type.ÈThe sample contains galaxies of all morphological types (from lenticular, e.g., NGC 6056, to late-type, e.g., NGC 6946), in order to observe all the di†erent morphological structures present in spiral galaxies. The sample consists mainly of early-type galaxies with prominent bulges, since the main goal of the preliminary study was based upon a structural and morphological analysis of the bulge component, and on the search for triaxial structures and their dynamical consequences. Inclination.ÈThe galaxies selected have an intermediate inclination. This was chosen in order to obtain good velocity curves, either from the literature or from future observations. Nuclear activity.ÈThe galaxies have normal or low nuclear activity. No active galactic nuclei or starburst gal-
ÈÈÈÈÈÈÈÈÈÈÈÈÈÈÈ 1 Based on observations made with the Isaac Newton Telescope, operated on the island of La Palma by the Isaac Newton Group in the Spanish Observatorio del Roque de los Muchachos of the Instituto de Astrof• sica de Canarias.
1638
TABLE 1 GLOBAL PARAMETERS OF THE GALAXIES
Galaxy (1) NGC NGC NGC NGC NGC NGC NGC NGC NGC NGC NGC
1300 . . . . . . 5992 . . . . . . 6056 . . . . . . 6661 . . . . . . 6946 . . . . . . 7013 . . . . . . 7217 . . . . . . 7479 . . . . . . 7606 . . . . . . 7723 . . . . . . 7753 . . . . . .
Type (2)
log D 25 (3)
B T (4)
D (Mpc) (5)
Scale (pc arcsec~1) (6)
SB(rs)bc S SB(s)0 SA(s)0/a SAB(rs)cd SA(r)0/a (R)SA(r)ab SB(s)c SA(s)b SB(r)b SABbc
1.79 ^ 0.01 0.94 ^ 0.07 0.96 ^ 0.05 1.24 ^ 0.03 2.06 ^ 0.01 1.60 ^ 0.02 1.59 ^ 0.02 2.02 ^ 0.01 1.73 ^ 0.02 1.54 ^ 0.03 1.52 ^ 0.03
11.11 ^ 0.1 14.28 ^ 0.15 15.81 ^ 0.08 13.05 ^ 0.16 9.61 ^ 0.1 12.40 ^ 0.13 11.02 ^ 0.13 10.35 ^ 0.1 11.51 ^ 0.14 11.94 ^ 0.13 12.83 ^ 0.15
20.91 126.4 157.1 58.3 3.69 13.3 15.4 33.92 31.09 25 71.31
101.37 612.8 761.6 282.63 17.88 64.48 74.66 164.44 150.72 121.19 345.72
Date
Exposure Time (s)
Seeing (arcsec)
TABLE 2 SUMMARY OF OBSERVATIONS
Filter NGC 1300 : U ........ B......... V ......... R ........ I ......... NGC 5992 : U ........ B......... V ......... R ........ I ......... NGC 6056 : U ........ B......... V ......... R ........ I ......... NGC 6661 : U ........ B......... V ......... R ........ I ......... NGC 6946 : U ........ B......... V ......... R ........ I ......... NGC 7013 : U ........ B......... V ......... R ........ I .........
Date
Exposure Time (s)
Seeing (arcsec)
1990 1990 1990 1990 1990
Aug Aug Aug Aug Aug
23 23 23 23 23
1800 1200 300 400 400
1.6 1.3 1.1 1.1 1.2
1990 1990 1990 1990 1990
Aug Aug Aug Aug Aug
22 22 22 22 22
1800 600 300 150 150
1.8 1.8 1.6 1.4 1.3
1990 1990 1990 1990 1990
Aug Aug Aug Aug Aug
21 21 21 21 21
1800 1200 600 250 250
1.7 1.6 1.3 1.3 1.3
1990 1990 1990 1990 1990
Aug Aug Aug Aug Aug
23 23 23 23 23
1800 800 400 400 150
1.8 1.6 1.4 1.3 1.3
1990 1990 1990 1990 1990
Aug Aug Aug Aug Aug
17 17 17 17 17
1800 600 150 75 75
1.7 1.4 1.3 1.3 1.3
1990 1990 1990 1990 1990
Aug Aug Aug Aug Aug
22 22 22 22 22
1800 1200 150 50 50
1.7 1.7 1.5 1.5 1.5
Filter NGC 7217 : U ........ B......... V ......... R ........ I ......... NGC 7479 : U ........ B......... V ......... R ........ I ......... NGC 7606 : U ........ B......... V ......... R ........ I ......... NGC 7723 : U ........ B......... V ......... R ........ I ......... NGC 7753 : B......... V ......... R ........ I .........
1990 1990 1990 1990 1990
Aug Aug Aug Aug Aug
17 17 17 17 17
200 600 300 75 30
1.6 1.4 1.1 1.3 1.2
1990 1990 1990 1990 1990
Aug Aug Aug Aug Aug
16 16 17 17 17
1800 1200 500 150 150
1.3 1.3 1.3 1.3 1.3
1990 1990 1990 1990 1990
Aug Aug Aug Aug Aug
22 22 22 22 22
1800 600 200 75 75
1.6 1.3 1.2 1.1 1
1990 1990 1990 1990 1990
Aug Aug Aug Aug Aug
22 22 22 22 22
1800 1200 600 400 400
1.6 1.3 1.1 1.3 1
1990 1990 1990 1990
Aug Aug Aug Aug
19 19 21 21
1500 300 100 100
1.4 1 0.9 1
1640
AGUERRI ET AL. TABLE 3 CALIBRATION CONSTANTS Galaxy NGC NGC NGC NGC NGC NGC NGC NGC NGC NGC NGC
1300 . . . . . . 5992 . . . . . . 6056 . . . . . . 6661 . . . . . . 6946 . . . . . . 7013 . . . . . . 7217 . . . . . . 7479 . . . . . . 7606 . . . . . . 7723 . . . . . . 7753 . . . . . .
U
B
V
R
I
28.3 ^ 0.1 28.7 ^ 0.1 28.7 ^ 0.1 27.3 ^ 0.1 ... 28.2 ^ 0.1 27.5 ^ 0.1 28.5 ^ 0.1 29.5 ^ 0.1 28.8 ^ 0.2 ...
30.1 ^ 0.1 28.9 ^ 0.1 30.4 ^ 0.1 28.6 ^ 0.1 ... 29.7 ^ 0.1 28.8 ^ 0.1 29.9 ^ 0.1 30.1 ^ 0.1 30.3 ^ 0.1 30.2 ^ 0.1
29.86 ^ 0.07 28.74 ^ 0.05 30.24 ^ 0.07 28.86 ^ 0.05 26.64 ^ 0.05 28.30 ^ 0.05 27.33 ^ 0.06 29.69 ^ 0.05 29.39 ^ 0.05 30.01 ^ 0.06 29.24 ^ 0.04
29.87 ^ 0.03 28.41 ^ 0.03 29.75 ^ 0.04 28.37 ^ 0.03 26.78 ^ 0.03 27.85 ^ 0.03 27.05 ^ 0.05 29.72 ^ 0.03 28.78 ^ 0.03 30.026 ^ 0.03 28.53 ^ 0.03
29.23 ^ 0.02 27.99 ^ 0.02 29.03 ^ 0.03 27.877 ^ 0.021 26.61 ^ 0.02 27.46 ^ 0.02 26.20 ^ 0.04 29.11 ^ 0.02 28.11 ^ 0.01 29.38 ^ 0.02 27.91 ^ 0.01
axies have been included in this sample. Zaritsky & Lo (1986) suggested that the presence of nonradial forces, produced by oval distortions in the mass distribution, could be an efficient mechanism to drive gas toward the internal regions of the galaxy. One aspect of our project is to investigate the possible correlation between low nuclear or circumnuclear activity and the presence of triaxial structures. In Table 1, we show the general parameters for the galaxies. Columns (1) and (2) are the NGC number and the morphological type from the RC3 (de Vaucouleurs et al. 1991), respectively. Column (3) is the logarithm of the 25thmagnitude isophotal diameter in units of
[email protected] (RC3). Column (4) is the total apparent magnitude in the B band (RC3). The distance to the galaxy (obtained from the radial velocities given by the RC3 and using H \ 75 km s~1 Mpc~1) is 0 gives the scale in parsecs given in column (5), and column (6) per arcsecond. Images were obtained at the prime focus of the 2.5 m Isaac Newton Telescope at the Roque de los Muchachos Observatory (ORM) on the island of La Palma, Spain, during 1990 August. A 400 ] 590 pixel GEC6 CCD detector was used with a read noise of 8 e~ pixel~1, a gain of 1 e~ ADU~1, and a saturation level of 60,000 counts (Jorden 1988). For the focal ratio (f/3.29), the angular size of each pixel is 0A. 54, which yields a Ðeld of
[email protected] in the north-south direction and
[email protected] east-west. We have observations in the Johnson U, B, V , R, and I bands for all the galaxies in the sample. Observations were taken under photometric conditions. The observations are summarized in Table 2. 2.1. Data Reduction Images were reduced using standard IRAF tasks. First, the bias level of the CCD (obtained from the overscan of each image and by taking images of zero exposure time) was subtracted from all exposures. We took a run of Ðve to 10 bias images on each night. These were combined into a single image for each night using the ZEROCOMBINE task. The images were Ñat-Ðelded using twilight images taken in all Ðlters at the beginning or end of each night. The sky background level was removed by taking the mean of four or Ðve 20 ] 20 pixel regions free of sources. In those regions was also computed the typical standard deviation of the sky background, p. The value of 3 p determines the observed limiting magnitude for each galaxy. The galaxy NGC 6946 Ðlls almost all of the CCD frame ; for this
reason, sky images were taken near to the object in order to obtain the sky level for that galaxy. Cosmic-ray events were automatically subtracted using the COSMICRAYS task. Field stars were removed using the IMEDIT task. This replaces the star by the sky background level, evaluated in an annulus of radius 5 pixels around the star, and adds Gaussian noise. There is a bright star in the northern part of NGC 7013. The subtraction of this star was difficult, especially in the I band. For this reason, all the proÐles for this galaxy do not include the region containing the star. 2.2. Absolute Calibration The absolute calibration was performed by using the standards FZ 24 and FZ 108 (Laing, Sinclair, & Wood 1992). These stars were observed several times during each observing night and at di†erent air masses. The standard chosen for the calibration of each galaxy was the closest one, in time and air mass, to the object. The calibration constant includes corrections for galactic inclination, atmospheric extinction, and Galactic extinction. No attempt was made to correct for internal extinction. The Ðrst-order atmospheric extinction in the V band was taken from the measurements of the Carlsberg Automatic Meridian Circle at the ORM. We obtained the extinction in other Ðlters by comparing this value with the aerosol measurement for the ORM (King 1985). The Ðrst-order color term in the transformation equations derived by other authors (de Jong & van der Kruit 1994) gives maximum values of some hundredths of a magnitude for V , R, and I and of a tenth of a magnitude for the B band. These values were taken as part of the error in our calibration constants. The absolute calibration for the U, B, and V bands was based on the Landolt (1973) system, and for R and I on the Cousins (1976) system. The extinction of our Galaxy was taken from the RC3 in the B band (A ). B Using the Burstein (1979) law, the extinction in the other Ðlters was A \ 0.76A , (1) V B A \ 1.8A [ 0.8A , (2) R V B A \ 2.62A [ 1.62A . (3) I V B For the U band, we used the Rieke & Lebofsky (1985) expression A \ 0.4A ] A . U B V
(4)
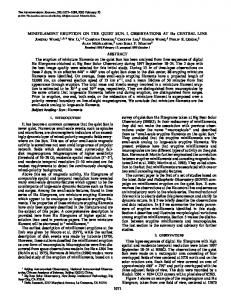
FIG. 1a FIG. 1.ÈB- and I-band images and U[B, B[V , and B[I color index maps for the galaxies of the sample. [Figs. 1bÈ1k are presented in the electronic edition of the Astronomical Journal.]
1642
AGUERRI ET AL.
Vol. 119
NGC1300
filter U filter B filter V filter R filter I
20
Ellipticity
mag/arsec2
18
22
24
1.0
250
0.8
200
0.6
filter U filter B filter V filter R filter I
0.4
0.2
26 0
0.0 0
50 100 150 Galactocentric radius (arcsec)
Position angle (degrees)
16
150
100
50
0 0
50 100 150 Galactocentric radius (arcsec)
U-B
filter U filter B filter V filter R filter I
B-V
50 100 150 Galactocentric radius (arcsec)
B-I
1.0
2.5 1.0
0.8
2.0
0.4
mag/arsec2
mag/arsec2
mag/arsec2
0.5 0.6
0.0
0.2
1.5
1.0
0.5 -0.5
0.0 0
50 100 150 Galactocentric radius (arcsec)
0
50 100 150 Galactocentric radius (arcsec)
0.0 0
50 100 150 Galactocentric radius (arcsec)
FIG. 2a FIG. 2.ÈSurface brightness and U[B, B[V , and B[I color index proÐles. [Figs. 2bÈ2k are presented in the electronic edition of the Astronomical Journal.]
There are more recent studies about the Galactic extinction law (Cardelli, Clayton, & Mathis 1989). The di†erences A(j)/A(V ) from the extinction law considered in this paper are about 0.01 in all Ðlters. In Table 3 are given the calibration constants and associated errors for the galaxies in each Ðlter. 3.
RESULTS AND DISCUSSION
In Figure 1, we present the images of the galaxies in the B and I bands and the U[B, B[V , and B[I color index maps. Images were previously aligned, and those with the best seeing were smoothed with a two-dimensional Gaussian Ðlter according to the seeing of the other image. Where the images are red (darker shades), we can infer that the population is older or more metallic than in the bluer areas (lighter shades), or that we are observing starlight partly obscured by dust. This information is essential for determining accurate mass distributions in the galaxies. Because of the inclination of the galaxies, their isophotes appear as ellipses. These ellipses were Ðtted using the ELLIPSE program from the IRAF package. This program uses an iterative algorithm described by Jedrzejewski (1987), which is similar to the method described by Kent (1983). The azimuthally averaged surface brightness proÐles in
each band versus galactocentric radius, and the U[B, B[V , and B[I color index proÐles, are shown in Figure 2. The ellipticities (deÐned as 1 [ b/a, b being the semiminor axis length and a the semimajor axis length for each ellipse) and the position angles (deÐned as the angle between the north direction and the major axis of each ellipse, measured in an eastward sense) of the ellipses as a function of galactocentric radius, together with their errors, are presented in Figure 3. The error of the intensity is the sum of the leastsquares errors from the ellipse Ðtting plus the sky error due to its Ñuctuations, given (in magnitudes) by *m \ 1.09(p/IJN), where I is the intensity of the corresponding isophote, p is the typical deviation of the sky background, and N is the number of points of the ellipse. The maximum of these errors is 0.01 mag arcsec~2 for all the Ðlters and all the galaxies of the sample. Another type of error is the systematic error determined by the subtraction of the sky background. The calculation and analysis of these errors were made following Silva & Elston (1994). The systematic errors are plotted in Figure 2 as dotted lines, and the random errors, *m, are plotted as error bars. The isophotal proÐles provide information on the di†erent structures that form the galaxy. For example, for a spiral galaxy that only shows a bulge and disk, the ellip-
No. 4, 2000
SURFACE PHOTOMETRY OF DISK GALAXIES. I.
1643
NGC 1300
Position Angle (degrees)
Ellipticity
U
B
V
R
I
1.0
1.0
1.0
1.0
1.0
0.8
0.8
0.8
0.8
0.8
0.6
0.6
0.6
0.6
0.6
0.4
0.4
0.4
0.4
0.4
0.2
0.2
0.2
0.2
0.2
0.0 0
0.0 0
0.0 0
0.0 0
50
100
150
50
100
150
50
100
150
50
100
0.0 0
150
160
160
160
160
160
140
140
140
140
140
120
120
120
120
120
100
100
100
100
100
80
80
80
80
80
60 0
60 0
60 0
60 0
50
100
150
50
100
150
50
100
150
50
100
60 0
150
50
100
150
50
100
150
NGC 5992 U
B
0.60
V
R
I
0.6
0.6
0.6
0.6
0.4
0.4
0.4
0.4
0.2
0.2
0.2
0.2
Ellipticity
0.50 0.40 0.30 0.20 0.10
Position angle (degrees)
0.00 0
10
20
30
40
0.0 0
10
20
30
40
0.0 0
10
20
30
40
0.0 0
10
20
30
40
0.0 0
300
300
300
300
300
250
250
250
250
250
200
200
200
200
200
150
150
150
150
150
100 0
100 0
100 0
100 0
10
20
30
40
10
20
30
40
10
20
30
40
10
20
30
40
100 0
10
20
30
40
10
20
30
40
Galactocentric radius (arcsec) FIG. 3a FIG. 3.ÈEllipticity and position angle proÐles for each bandpass. Error bars are overplotted. [Figs. 3bÈ3f are presented in the electronic edition of the Astronomical Journal.]
ticity of the isophotes is almost zero at the center and increases monotonically until reaching a constant value, which corresponds to the inclination of the disk (Varela et al. 1996). For a galaxy with a bar feature, the ellipticity grows from values of almost zero at the center to a local maximum at the end of the bar. It then falls to the ellipticity of the disk (Wozniak et al. 1995). In galaxies with two bars, the ellipticity Ðrst grows to a Ðrst local maximum corresponding to the secondary bar and then falls to a minimum before climbing again to a primary maximum, after which it decreases toward the ellipticity of the disk (Jungwiert, Combes, & Axon 1997). We compared our photometric results (inclinations and position angles) with the values given by the RC3 and CCD values (if they existed in the literature) for the sample of galaxies. The position angle and inclination were computed by taking a mean of the last isophotes in the B band. In Figure 4, we show the comparisons among all these quantities. For the position angle and inclination, it is evident
that our values and their errors are in very good agreement with the RC3 values. The weighted mean di†erence between our values and those of the RC3 for the inclination and position angle are 2¡.93 ^ 4¡.7 and 4¡.00 ^ 11¡.3, respectively. Summarizing, we have obtained accurate surface photometry in the optical Johnson bandpass of a sample of 11 spiral galaxies. We have presented the observations and the calibration process for the images. The surface brightness, ellipticity, and position angle proÐles obtained from the isophotal Ðtting are also shown, together with the color index proÐles and color map images for the galaxies in the sample. The information provided in this paper will be used as a starting point for a program to derive the physical parameters and mass distributions of the galaxies, which will be the subject of a forthcoming paper. This study was partly Ðnanced by SpainÏs DGES (grants PB97/0219 and PB97/0158).
1644
AGUERRI ET AL.
FIG. 4.ÈComparison between our inclination (top) and position angle (bottom) values and those given by the RC3
REFERENCES Andredakis, Y. C., & Sanders, R. H. 1994, MNRAS, 267, 283 Landolt, A. U. 1973, AJ, 78, 959 Boroson, T. 1981, ApJS, 46, 177 Peletier, R. F., Valentijn, E. A., Moorwood, A. F. M., & Freudling, W. Burstein, D. 1979, ApJ, 234, 435 1994, A&AS, 108, 621 Caon, N., Capaccioli, M., & DÏOnofrio, M. 1993, MNRAS, 265, 1013 Peletier, R. F., Valentijn, E. A., Moorwood, A. F. M., Freudling, W., Cardelli, J. A., Clayton, G. C., & Mathis, J. S. 1989, ApJ, 345, 245 Knapen, J. H., & Beckman, J. E. 1995, A&A, 300, L1 Cousins, A. W. J. 1976, MmRAS, 81, 25 Prieto, M., Aguerri, J. A. L., Varela, A. M., & Mun8 oz-Tun8 on, C. 2000, de Jong, R. S. 1996a, A&AS, 118, 557 A&A, submitted (Paper II) ÈÈÈ. 1996b, A&A, 313, 45 Prieto, M., Beckman, J. E., Cepa, J., & Varela, A. M. 1992, A&A, 257, 85 de Jong, R. S., & van der Kruit, P. C. 1994, A&AS, 106, 451 Prieto, M., Gottesman, S. T., Aguerri, J. A. L., & Varela, A. M. 1997, AJ, de Vaucouleurs, G., de Vaucouleurs, A., Corwin, H. G., Jr., Buta, R. J., 114, 1413 Paturel, G., & Fouque, P. 1991, Third Reference Catalogue of Bright Rieke, G. H., & Lebofsky, M. J. 1985, ApJ, 288, 618 Galaxies (New York : Springer) (RC3) Rubin, V. C., Burstein, D., Ford, W. K., Jr., & Thonnard, N. 1985, ApJ, Elmegreen, D. M., Elmegreen, B. G., Chromey, F. R., & Hasselbacher, 289, 81 D. A. 1996, ApJ, 469, 131 Rubin, V. C., Ford, W. K., Jr., & Thonnard, N. 1980, ApJ, 238, 471 Evans, R. 1994, MNRAS, 266, 511 Rubin, V. C., Ford, W. K., Jr., Thonnard, N., & Burstein, D. 1982, ApJ, Freeman, K. C. 1970, ApJ, 160, 811 261, 439 Hunter, J. H., Jr., Ball, R., Huntley, J. M., England, M. N., & Gottesman, Searle, L., Sargent, W. L. W., & Bagnuolo, W. G. 1973, ApJ, 179, 427 S. T. 1988, ApJ, 324, 721 Silva, D. R., & Elston, R. 1994, ApJ, 428, 511 Jedrzejewski, R. I. 1987, MNRAS, 226, 747 Simien, F., & de Vaucouleurs, G. 1986, ApJ, 302, 564 Jorden, P. R. 1988, Basic Parameters of CCDs in Use at La Palma (ING Simonneau, E., Varela, A. M., & Mun8 oz-Tun8 on, C. 1993, J. Quant. SpecLa Palma Tech. Note 55) (version 3 ; La Palma : Inst. AstroÐs. Canarias) trosc. Radiat. Transfer, 49, 149 Jungwiert, B., Combes, F., & Axon, D. J. 1997, A&AS, 125, 479 Stark, A. A. 1977, ApJ, 213, 368 Kent, S. M. 1983, ApJ, 266, 562 Varela, A. M. 1992, Ph.D. thesis, Univ. La Laguna ÈÈÈ. 1986, AJ, 91, 1301 Varela, A. M., Mun8 oz-Tun8 on, C., & Simonneau, E. 1996, A&A, 306, 381 ÈÈÈ. 1987, AJ, 93, 816 Wozniak, H., Friedli, D., Martinet, L., Martin, P., & Bratschi, P. 1995, King, D. L. 1985, Atmospheric Extinction at the Roque de Los Muchachos A&AS, 111, 115 Observatory, La Palma (ING La Palma Tech. Note 31) (La Palma : Inst. Zaritsky, D., & Lo, K. Y. 1986, ApJ, 303, 66 AstroÐs. Canarias) Kormendy, J. 1977, ApJ, 214, 359 Laing, R., Sinclair, J., & Wood, R. 1992, Standard Star Lists Available at the ING (ING La Palma Tech. Note 85) (La Palma : Inst. AstroÐs. Canarias)