a Java Virtual Machine (JVM), which is an application that runs above the operating .... composed of 12 PCs Pentium (90 MHz CPU) running also Microsoft NT 4.
1 Network Parallel Computing for SOM Neural Networks Gilles Labonté, Marc Quintin Royal Military College of Canada {labonte-g, quintin-m}@rmc.ca Abstract: This paper presents the implementation of Self-Organizing Map (SOM) neural networks on distributed computers composed of disparate workstations in order to speedup the computation and to make better use of available computing resources. The developed application is characterized by its dynamic load balancing schemes and its Java implementation. To demonstrate the gain in performance it provides, we have conducted tests in which neural networks of various sizes were realized. For relatively large neural networks, the distributed version of the SOM is seen to provide linear speedups. Keywords: Network Parallel Computing, Self-Organizing Maps Neural Networks.
1. Introduction The purpose of our work was to develop and implement Self-Organizing Map neural networks on distributed computers composed of disparate workstations. Self-Organizing Map (SOM) neural networks are systems that can be trained to learn. In general, highperformance computers are required for their training to be completed in a practical time. Today’s supercomputers are very expensive and unaffordable for many organizations. However most commercial, educational, and governmental organizations already have networks of many relatively cheap workstations that they currently use to meet their computing needs. Such workstations can be configured to do distributed computing which allows for parallel computations. Such network parallel computing provides essentially free additional computing power and, as such, become the technology of choice to fulfil the needs for fast computing of many such organizations. In particular, users of SOM neural networks can take advantage of these widely available computer networks to obtain the computing power that their applications require. By implementing a SOM neural network on a distributed computer, significant improvements in performance can be gained. This has already been demonstrated by, for example, (Guan et al., 1996) (Guan et al., 1997) (Lange et al., 1996) (Lobo et al., 1998) and (Vassilas et al., 1995). The purpose of our work is to attempt to produce, through
2 the use of different technologies and algorithms, a more versatile product than those previously developed.
2. Network Parallel Computing The principal motivation for using a Network Parallel Computer is to take advantage of already available resources to gain a reduction of the time required to solve a computational problem. Network Parallel Computing takes place when processing tasks are distributed among the workstations available on a network. By communicating among themselves, these workstations can work in parallel and in cooperation to solve a problem. However, because most networks today are based on the Ethernet bus or token ring technology, workstations on such networks share the same communication channel. These workstations must then communicate sequentially, i.e., only one computer can communicate at any given time. A characteristic of this arrangement is that, although the computation can be parallelized, the communication remains sequential. From a purist point of view, the end result is some sort of “sluggish parallelism.” However, despite this restriction, as long as the overall computation has a significant computing/communicating ratio, distributed computing can still provide considerable valuable performance.
3. Self-Organizing Maps SOM neural networks have been formalized by T. Kohonen (Kohonen, 1997) in the early ‘80s. In its standard form, this neural network is a matrix of neurons which all have a reference vector. Through the network dynamics, these reference vectors are fitted to a set of input vectors such as to approximate their density distribution in an ordered way. SOMs are very well suited to organize and visualize complex data in a two-dimensional display, and by the same effect, to create abstractions or clusters of that data. The above mentioned fitting technique is the core element of the SOM. This is achieved through a competitive and learning process. The competitive process consists in comparing each input vector to all the neurons’ reference vectors. The neuron that has its reference vector at the shortest geometric distance to an input vector, becomes the winner for that input vector. The learning process occurs after this competition has taken place. In the learning phase, each winning neuron and its surrounding neurons gradually change the value of their reference vectors in an attempt to match the input vector for which it has won. This cycle of competition and learning processes is repeated. At each cycle the size of the neighborhood of the winning neuron is decreased. The whole process terminates once each reference vector has reached a satisfactory approximation of their corresponding input vector.
Network Parallel Computing for SOM Neural Networks 3 During the learning process, each neuron that is close enough to a winning neuron will learn somewhat from the inputs for which it wins. Because a neuron is generally in the neighborhood of many winners, its reference vector gets to learn from many inputs. This results in a local smoothing effect of all reference vectors in that neighborhood that, in continued learning, leads to a global ordering. Despite their simplicity, SOMs remain very demanding in terms of computing resources, since the process generally involves a very large number of inputs and of neurons. The neurons’ weight vectors may also be of dimensions numbered in the thousands. This is to be expected considering that SOMs are designed to emulate the human brain, which is composed of billions of neurons that process very complex information.
4. Java Previous implementations of SOM, (Guan et al., 1996) (Guan et al., 1997) (Lange et al., 1996) (Lobo et al., 1998) and (Vassilas et al., 1995), were based on the publicly available software package PVM (for Parallel Virtual Machine) (Geist, 1994). Our implementation distinguishes itself by its usage of Java. Java is the latest modern programming language. It has various built-in features that facilitate the development of applications on a network of heterogeneous workstations. Java programs are executed on a Java Virtual Machine (JVM), which is an application that runs above the operating system (OS). Its role is to provide the programmer with a consistent application programming interface (API), irrespectively of the operating system below. Consequently Java applications are platform independent. Being a modern programming language, Java embeds features that fulfil today’s computing needs. It has built-in an API for different types of networking and provides the means to dynamically migrate programs across networks. These features combined with the JVM allow the developer to make abstraction of the different operating systems and types of computers that could reside on a network. For example, when sending data between two different types of computers, the developer does not have to worry about the data format, which is platform dependent.
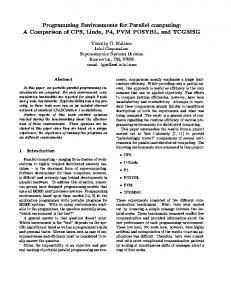
5. Design Architecture The SOM neural network was implemented by decomposing tasks and assigning them to two entities that we respectively designate as worker and coordinator. We consider that there is only one coordinator and there could be as many workers instantiated as there are workstations available on the network. Each workstation in usage receives either a single worker or the coordinator (see Figure 1). The coordinator acts as the central point of
4 liaison for all the workers, which do not communicate among themselves. Each worker receives a cluster of unordered neurons and a copy of all input vectors. At the beginning of a learning cycle, each worker computes a list of the winners, among its neurons, for each of the input vectors. It then sends this list to the coordinator. Upon having received all of the workers’ list of local winners, the coordinator computes a list of neurons that are the winners among all local winners for each input vector. This list of global winners, one for each input vector, is then sent to each worker. Upon receiving it, each worker changes the reference vectors of its own neurons accordingly. This learning cycle is repeated until an acceptable approximation of the input vector distribution has been reached.
Figure 1 - Distribution of the applications
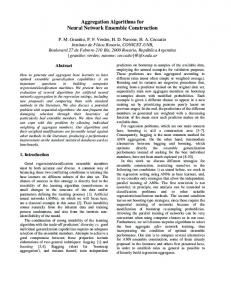
6. Message Scheduling and Load Distribution The time required to perform a computation on a single sequential computer can be expressed as P+S time units. P corresponds to the portion of the program that can be performed in parallel and S corresponds to the portion that can not. Let us firstly consider the case where all the workstations have the same speed (case 1), and thus are made to compute the same length of time. Figure 2 shows the time line of events that would then take place between the workstations. The small circles represent communications between the coordinator (Coor) and his workers (W). The first message is sent to the first worker and similar messages are subsequently sent to the other workers. This first set of messages would be the signal that the coordinator sends to the workers to start the
Network Parallel Computing for SOM Neural Networks 5 computation. This first message takes “a” time units for its transmission and propagation. Then each worker proceeds with his respective computation that lasts for p=P/N time units. Once the first worker has finished his computation, he sends a reply message to the coordinator. This reply message takes “c” time units for its transmission and propagation. All the other workers do the same upon completing their computation. It happens that a worker who is ready to communicate is required to wait until any ongoing communication is completed because the coordinator can only entertain one communication at the time. This results in all communications being shifted with respect to the time line. Upon receiving the last reply message, the coordinator computes the final result from all the replies which takes “Ng” time units and then performs the final computation that takes “S” time units. The total time for the parallel computation is thus “a+(P/N)+N(c+g)+S.”
Figure 2 - Message scheduling and load distribution for case 1.
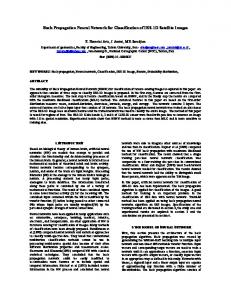
As illustrated in Figure 2, this scheme results in wasted time because the workers are required to wait for the coordinator to be available for communication. In order to remedy this inefficiency, the workload must be unevenly distributed so that workers compute during the periods during which they would otherwise stand waiting. This situation where workers receive different workloads becomes particularly critical when the workstations have different computing speeds. In this case, we have determined that the worker being hosted by the fastest workstation must receive the largest workload. Thus, we derived an optimal message scheduling and load distribution scheme that is illustrated in Figure 3. We shall refer to this scheme as case 2. The first worker (W1) has
6
Figure 3 - Optimal message scheduling and load distribution for case 2. the fastest execution speed while the last worker (WN ) has the slowest execution speed. As per Figure 3, the i’th worker computes for the time pi given below, where p1 is the computation time of the first worker.
p i = p 1 − ( i − 1)( a + c + g ) The total number of neurons n is a constant for a given neural network. Consequently, if si and ni respectively denote the processing speed of the i’th workstation, measured in neurons processed per second, and the number of neurons it possesses, N
n=
N
∑n = ∑s p i =1
i
i =1
i
i
N
N
i =1
i =1
= p 1 ∑ si − ( a + c + g ) ∑ si ( i − 1)
Thus solving for p1, N
p1 =
n + ( a + c + g ) ∑ ( i − 1) si i =1
N
∑s i =1
i
Network Parallel Computing for SOM Neural Networks 7 When this value is substituted in the second preceding equation to yield pi, one notices that an upper limit is put on N by the fact pN must be positive. Neurons are distributed as follows:
( )
N ∑ j ⋅sj n ⋅ si = j 1 + (a + c + g ) N − i si n i = p i si = N s s ∑ j ∑ j j =1 j =1
As per Figure 3, the time required to complete a cycle is then:
I = a + p1 + c + g + S and the speedup is:
S p eed u p =
P+S = a + p1 + c + g + S
(P + S ) n + ( a + c + g ) ∑ (i ⋅ s i ) N
i =1
N
∑s i =1
+S
i
7. Test Results
7.1. Description There were four homogeneous networks available for our experimentation. The first network was composed of 30 Sun Microsystems workstations, model Ultra30 running the operating system Solaris 2.6 in conjunction with the JVM 2. The second network was
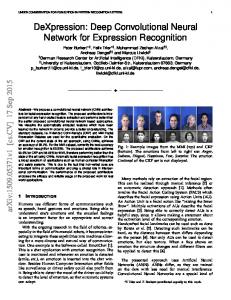
8 composed of 18 Sun Ultra1 workstations also running the operating system Solaris 2.6 in conjunction with the JVM 2. The third network was composed of 11 PCs, Pentium II (266 MHz CPU) running Microsoft NT 4 and JVM version 1.1.6. And the fourth network was composed of 12 PCs Pentium (90 MHz CPU) running also Microsoft NT 4 and JVM version 1.1.6. The workstations in all four sub-networks were interconnected by a typical 10Mbps Ethernet network bus. Most testing was done on the first mentioned homogeneous network since it had the largest number of workstations. The SOM algorithm consists of a sequence of slowly varying cycles. Measuring a reduced number of cycles is sufficient to evaluate the relative overall execution time for the given problem. Consequently all the results are given in terms of a single cycle. All the neural networks considered in this study were configured as circular arrays and were used to solve typical Euclidean traveling salesman problems (Angéniol et al. 1997). Consequently, the input and reference vectors were two-dimensional vectors. Figure 4 shows the execution time for a neural network with 3038 neurons for both cases 1 and 2. For case 1, the execution time decreases as additional workstations are added, up to a limit of 22 workstations. After this point, adding more workstations causes execution time to increase. On the other hand, when the neurons are unevenly distributed as per case 2 load distribution scheme, the execution time decreases monotonically until the limit of 28 workstations is reached. This behavior is as predicted by our equations. Figure 5 shows the speed-ups obtained for the 3038 neurons when the load was evenly distributed (case 1) and as per our optimal load balancing scheme (case 2). The straight line was added to allow the comparison to a linear speed-up. Figure 6 shows the different speed-ups obtained for a neural network of 1173, 3038 and 5915 neurons. The three bottom curves correspond to the even load distribution scheme (case 1), while the top curve corresponds to the neural network with 5915 neurons, distributed as per the optimal load distribution scheme (case 2). Figure 7 shows the execution speeds we found for the different types of workstations, with the four individual networks we had available for testing. In all instances the different networks of workstations were computing for the same neural network of 1173 neurons.
7.2 Analysis Figures 4 and 5 demonstrate that our application behaves according to the mathematical equations we have developed. We remark that in the upper-left corner of Figure 4, the curve for case 2 goes slightly above the one for case 1 which suggests an adverse effect due to load balancing. This effect is however negligible and only encountered when a small number of workstations is used. Overall the proposed optimal load distribution scheme out-performs the even load distribution scheme. One notices in Figure 6 that the first part of the speed-up curves follows the linear
Network Parallel Computing for SOM Neural Networks 9 63000 58000 case 1 Execution time(ms)
53000 48000
case 2
43000 38000 33000 28000 23000 18000 1
6
11
16
21
26
31
number of hosts
Figure 4 - Absolute execution time for one cycle for 3038 neurons.
16 14
Speed-up
12 10 8
case 1
6
case 2
4
line a r s p e e d up
2 0 0
5
10
15
20
25
num b e r o f ho s ts Figure 5 - Relative Speed-up for a neural network of 3038 neurons.
30
10 35 1 1 7 3 n e u ro n s (c a s e 1 ) 3 0 3 8 n e u ro n s (c a s e 1 )
30
li n e a r s p e e d u p m a x s p e e d u p & 5 0 % e ff. 25
5 9 1 5 n e u ro n s (c a s e 1 )
Speed-Up
5 9 1 5 n e u ro n s (c a s e 2 ) 20
15
10
5
0 0
5
10
15
20
25
30
35
n u m b e r o f h o s ts
Figure 6 - Relative Speed-ups for neural networks with 5915, 3038, and 1173 neurons.
100000
Execution time (ms)
90000 80000
Sun Ultra 1
70000
Sun Ultra 30
60000
P-90
50000
PII-266
40000 30000 20000 10000 0 0
5
10
15
20
25
number of hosts
Figure 7 - Execution times for a neural network with 1173 neurons on different computer networks.
30
Network Parallel Computing for SOM Neural Networks 11 speed-up line. For larger neural networks there is a longer zone where essentially linear speed-ups prevail. Considering that normal SOM problems involve very large numbers of neurons and that typically available computing resources within an organization are limited, users are more likely to work in this linear zone. The linear speed-up zone exists because within that range, the communication overhead has no detrimental effect on the overall speed-up. The fact that both schemes 1 and 2 provide the same performance within the linear speed-up zone may suggest that load balancing is not advantageous. This would be true only for an homogeneous network. In the context of an heterogeneous network load balancing is an unavoidable requirement for optimal performance. One should further notice that enforcing the optimal load balancing scheme makes longer the linear speed-up zone. If the problems are smaller or users are not limited in the number of their workstations, maximal speedups will be obtained at approximately half the number of workstations (on an homogeneous network) which corresponds to 50% efficiency (demarcated by the dashed line in Figure 6). However, even such relatively smaller efficiency should not be considered disappointing, considering the fact that the resources used were actually already available and unused. One should see that the efficiency has actually been increased from 0% to 50%. The computer network composed of Pentium (90 MHz) was equipped with poor performing network interfaces which induced higher communication overhead. Figure 7 shows this detrimental effect as the curve for these Pentiums does not merge with the others. This observation goes along with (Martin et al., 1998) findings which pointed out that such applications are most sensitive to communication overhead.
8. Conclusion In this research project, we were able to develop and implement a Self-Organizing Map neural Network on distributed parallel computers consisting of identical and of disparate workstations. As expected, the speed-ups observed are constrained by the communication overhead. Nevertheless they are linear for relatively large SOM neural networks. Our results show that performance is proportional to the ratio of computation to communication time, and that performance is very sensitive to communication overhead. In that respect, network parallel computing performance benefits from faster workstations, but even more from faster network communications. We have shown that even poor performing workstations can provide excellent overall performance if more of them are used in parallel. We demonstrated that our implementation is able to reduce the computational time required by SOMs to a fraction of the time required by a single computer. We have made tests which all validated the equations we have derived for the speed-up in terms of the number of workstations, for homogeneous as well as
12 heterogeneous computer networks. By selecting a technology like Java, it was easy to operate on heterogeneous networks. Our parallel implementation of the SOM was run on Unix-based and on MSWindows-based operating systems. It can apply different load balancing schemes to fit various communication patterns and to adapt dynamically to variations of workstation execution speeds. These capacities represent advantages over the PVM-based implementations presented in (Guan et al., 1996) (Guan et al., 1997) (Lange et al., 1996) (Lobo et al., 1998) and (Vassilas et al., 1995) which did not offer dynamic nor optimal load balancing. A forthcoming study will compare the computational performance of our implementation and one based on PVM . There is no doubt however that our main goal of speeding up the computation was achieved. Our secondary goal, which was to make better use of available computing resources, is also achieved. Our study clearly corroborated the statement that supercomputer-like performances can be achieved at essentially no cost, for organizations which already have a network of many workstations. References Angéniol, B., Vaubois, G., and Le Texier, Y.-Y. Self-organizing feature maps and the traveling salesman problem. Neural Networks, 1 (4), 289-293, 1988. Geist, A., et al., PVM: Parallel Virtual Machine, A User’s Guide and Tutorial for Networked Parallel Computing. MIT Press, 1994. Guan, H., Li, C., Cheung, T., Yu, S., and Tong, W., Design and Implementation of a Parallel Software for Hybrid Neural Network Computation in PVM Environment, Proceeding of the 1996 3rd International Conference on Signal Processing, Beijing, China, IEEE Computer Society Press, 1996. Guan, H., Li, C., Cheung, T., and Yu, S., Parallel Design and Implementation of a SOM Neural Computing Model in PVM Environment of a Distributed System, Proceeding of the 1997 Conference on Advance in Parallel and Distributed Computing, Shanghai, China, IEEE Computer Society Press, March 1997. Kohonen, T., Self-Organizing Maps, 2nd edition, Springer, 1997. Lange, J.S., Schönmeier, P., and Freiesleben, H., Parallelization of analyses using self-organizing maps with PVM, Proceedings of the 1996 5th International Workshop on Software Engineering, Neural Nets, Genetic Algorithms, Expert Systems, Symbolic Algebra and Automatic Calculations in Physics Research, AIHENP’96, Lausanne, Switz, 2 September 1996. Lobo, V.J., Bandeira, N., and Moura-Pires, F., Training a Self-Organizing Map distributed on a PVM network, IEEE World Congress on Computational Intelligence, Alaska, IEEE Press, 1998. Martin, R.P., Vahdat, A.M., Culler, D.E. and Anderson, T.E., Effects of Communication Latency, Overhead, and Bandwidth in a Cluster Architecture, technical report CSD-96-925, University of California in Berkeley, 17 June 1998.
Network Parallel Computing for SOM Neural Networks 13 Vassilas, N., Thiran, P., and Ienne, P., On Modifications of Kohonen’s Feature Map Algorithm for an Efficient Parallel Implementation, Proceedings of the 4th International Conference on Artificial Neural Networks, Cambridege, UK, 1995.