Network position, export patterns and competitiveness: evidence from the European automotive industry (Published on Competition and Change, vol 21(2): 132-158) Manuel Gracia
[email protected] Mª José Paz
[email protected]
Abstract The organizational characteristics of production in the European automotive industry have favoured a high degree of fragmentation and productive mobility. This article analyses the differing national positions of automotive producing countries and their export patterns – particularly their export reorientation to extra-European Union (EU) markets following the collapse of regional demand in the European automotive industry. Based on the methodologies of Mahutga and Piana our position analysis arrives at two main conclusions: i) the countries best positioned in the European regional automotive production network are precisely those that have experienced a greater increase in extraEU exports, thus reducing their dependence on regional European demand; ii) the increase in extra-EU exports (mainly of final goods) is linked to increased regional fragmentation of production in the automotive industry. We conclude that the governance of this fragmentation process is a key determinant of extra-EU export competitiveness. Keywords: production network; automotive industry; export pattern; Europe; internationalization of production JEL: L62, F15
1
Introduction Various studies have analysed the automotive industry and its high production fragmentation which is organized around increasingly globalized regional production areas such as the European Union (Dicken, 2003; Domanski and Lung, 2009; Frigant, and Layan, 2009; Jürgens and Krzywdzinsky, 2009; Frigant and Zumpe, 2014). Following this production fragmentation process the underlying global production network governance structures of leading companies in the industry (which determine what, where, and how goods will be produced) have created differentiated national producer country positions within these networks (Gereffi and Korzeniewics, 1994; Hess, 2008, Gibbon et al. 2008). At the same time, various articles have linked the relative power and position of actors within the production network to the potential for industrial upgrading, as well as to processes of value generation and capture. Much of this work has focused on new producers in Eastern Europe (Humphrey and Memedonic, 2003; Coe et al., 2004: Pavlinek et al., 2009; Fortwengel, 2011). Yet few studies have linked national producer country positions within the network (and the underlying patterns of fragmentation and specialization) to the competitiveness of different national industries, whether intra- or extra-European Union (EU). In the process of post-crisis restructuring, this turns out to be a central issue since the recovery of domestic industries has been shown to depend largely on the dynamism of the trading partners of these industries (European Commission, 2010).
Our article contributes to the European automotive literature and to global production network research in three ways. First, it demonstrates the existence of distinct positions within the European automotive industry, highlighting German control and consolidation through growing regional fragmentation of production. Second, the article contributes to 2
the analysis of power and position within production networks by linking them to the competitiveness of national industries (and in particular, to the potential reorientation towards extra-EU markets). The results of our analysis reveal a close relationship between the network position of each country and the degree of autonomy from regional demand. Third, the increasing globalization of regional production networks cited by some authors (see e.g., Los et al., 2015) appears rather uneven when the analysis is focused on the European automotive industry.
Our choice of the automotive industry1 is justified on two main counts. First, the industry is of historical importance to the EU economy in terms of production, employment, and trade. Moreover, it has important linkages with other sectors of the economy. On average, this sector represents around 4% of the gross domestic product of the EU and 7% of employment, sustaining approximately three million direct jobs and nine million indirect jobs. The sector also represents the largest private investor in research and development in the EU.2 Moreover, the EU is one of the leading automotive producers and has a share of more than 20% of global automotive production. At a time when world trade is on the rise, this openness grants a growing share of world production to emerging economies. This includes the rise of China which is now a leading automotive manufacturer. Nonetheless, the success of Chinese production in this sector should be regarded with certain caution, because production remains oriented toward satisfying the domestic market. In any case, China´s share in the world market in 2012 stood at 4.9%. Although
1 Code 87 of the Harmonized System, "Vehicles other than railway or tramway rolling-stock, and parts and accessories thereof". 2
See https://ec.europa.eu/growth/sectors/automotive_en
3
South Korea remains a significant automotive producing county (with 6.6% of the world market in 2012), it still lags behind the traditional industry leaders, the United States (10%) and Japan (12%). Second, the organizational characteristics of production have favoured a high degree of fragmentation and productive mobility within the EU, as well as numerous relocation processes over the past two decades, making this industry an interesting case for production network analysis (Dicken, 2003; Coe et al., 2004). In order to assess the degree of European automotive industry fragmentation and regionalization, it is essential to analyse the significance of intra-EU trade. In terms of exports, eight of the twenty eight European partners accounted for more than 80% of intra EU trade in 2015. When compared to the year 2000 Germany has maintained its leadership role but with a reduction in its share of European automotive production. A similar trend can be observed in relation to other traditional automotive producing countries (France, Spain, Italy, and the UK), while the share of Eastern European economies (Czech Republic, Poland, Slovakia, and Hungary) has increased. Only Germany and the United Kingdom have a higher share of extra-EU automotive exports over intra-EU. The regionalization of the sector is even more evident in terms of imports as imports of EU origin are above 80% in twenty four of the twenty eight partners. It is interesting to highlight that Germany has been gradually increasing imports from Eastern Europe as a result of the relocation of production plants during the past two decades. As we will argue later in the article, this strengthens German hegemony in this sector.
However, changes have occurred in the production and trade geography of the automotive sector in the last ten to fifteen years which have increased the importance of extra-regional markets. Two distinct but interconnected trends may explain this phenomenon. First, the
4
growing importance of extra-EU markets has been fuelled by the global economic crisis and by a sharp drop in European demand. In these circumstances, the export reorientation of European production towards other regions has been seen as a potential solution and as an engine of a new growth phase driven by extra-EU demand. Second, emerging producer countries have become more competitive, leading to a surge in imports of automotive parts and components from countries outside of the EU. While this signals the rise of production fragmentation in the automotive industry on a global basis, the fragmentation process takes on particular regional features in the European automotive industry.3
In this article, we examine whether this analysis can be applied to all European automotive economies due to their varied linkages and positions in the regional European production network. In order to answer this question we assume that the position of each national industry within the production network strongly influences its potential for reorientation towards markets outside the EU. In this article, we therefore apply network position analysis (see section two) to the European automotive sector with a view to assessing the post-crisis re-shaping of exports from the sector.
The structure of our article is as follows. In section two, we define ‘position’ and explain the methodology used for our study. In section three, we analyse the different positions
3 Of the 12 major European car producers, imports from the EU27 exceed 85% of total imports in the sector. According to Los et al. (2015: 72), in the case of Germany, the main producer, the intra-EU aggregate value in car production remains very high, at 84.6 % in 2008 (although it was higher in 1995, at 92.1%).
5
of the main European producer countries, highlighting changes that have occurred in their position in the period between 1999 and 2014. Section four goes onto explain basic trends in export patterns in the European automotive sector combining technological specialization with trade geography analysis. This allows us to assess how widespread the export reorientation has been of the main producer countries and relate this with their network positions in the European automotive industry. Finally, the conclusion outlines our main findings.
Background literature For more than three decades different authors have discussed the significance of international production fragmentation. These approaches include: i) the global commodity chains (GCC) approach, which later evolved into the very similar ii) global value chains (GVC) approach; and iii) the global production networks (GPN) approach.4 The authors of the first two approaches (GCC and GVC analysis) developed their studies of global commodity and value chains with an emphasis on understanding chain dynamism as a whole, but they were likewise interested in how these chains touched down in various national economies. These countries were often considered on an individual basis in terms of their linkages into global value chains, and how they could change the position of their export-oriented firms within these chains.
4
Another approach, called Commodity Chain (Hopkins and Wallerstein, 1977), is considered a
pioneer in the analysis of productive internationalization and its hierarchical nature. Nevertheless, the amplitude of the unit of analysis adopted by that approach (the world economy) has hampered its operability for the study of specific industries and intra-chain relationships.
6
In line with the work of Bair (2005, 2008) we believe that the GPN approach complements rather than replaces GVC analysis (Bair, 2005). Nonetheless, as the GPN literature notes, there is a significant difference between the terms ‘network’ and ‘chain’, and in the use of the terms ‘production’ and ‘commodity’ (Henderson et al., 2002:444). GPN scholars prefer the ‘network’ over the ‘chain’ metaphor in order to avoid an exclusive focus on the vertical analysis of interfirm relations in the value chain. Instead GPN scholars favour an approach that also integrates the horizontal and diagonal aspects of production network analysis. For these authors, the vertical structure underlying the chain analysis is obsolete, as reflected in the power that some suppliers have managed to achieve in certain chains. The concept of ‘production’ is preferred over ‘commodity’ to emphasize the socially embedded nature of the production process. From this may follow what Bair (2005) has considered the hallmark of this approach: GPN scholars pay greater attention to specific political, institutional, and territorial determinants of global production networks. Therefore, in the GPN literature, the concept of ‘embeddedness’ is important in relation to ‘local’ determinants of economic processes.
The differences in the CCC, GVC, and GPN approaches outlined above are reflected in the concept and the precise methodology required for position analysis. It is necessary to begin by emphasizing that various approaches consider that the network position of firms is directly related to their power within the network. In the words of Henderson et al. (2002: 450) the power of a firm can be defined as “the capacity to influence decisions and resources allocations – vis-à-vis other firms in the network– decisively and consistently in its own interest”. Thus, power is a result of firm specialization, but it subsequently enables firms to make particular decisions that can reinforce or transform their specialization, thereby also influencing the specialization of other firms. Thus, 7
specialization in activities with higher barriers to entry have allowed firms to occupy power positions within the network. The GCC and GVC approaches have been useful in identifying structures of value chain governance (i.e. interfirm power relations). In fact, this rather narrow analytical focus in the GCC and GVC literatures has proved to be important in developing an empirical position analysis (see below). Nevertheless, in our view, GPN analysis also contains key elements for analysing the concept of power in GPNs and its implications for the dynamics of the production network: i)
The asymmetrical, hierarchical power relations are compatible with the dynamic nature of the network (Coe et al., 2008:276). Therefore, position analysis should be made from a dynamic perspective to be able to understand changes in the network. Our research aims to develop this type of analysis for the European automotive industry by focusing on a particular aspect: its geographical export pattern and its position/relationship vis-à-vis the intra-EU network. As suggested by Coe et al. (2004: 469), we assume that “[t]he fortunes of regions [or countries] are shaped not only by what is going on within them, but also through wider sets of relations of control and dependency, of competition and markets”.
ii)
Power relationships within a production network are complex and do not respond to a single governance structure. The GPN approach aims to overcome the linearity associated with value chain analysis by clarifying the distinction between producer- and buyer-driven production and by recognizing the possibility of the coexistence of both structures in the same sector (Henderson et al., 2002). This is particularly important in sectors where
8
different products are grouped under a single commercial or productive category, as is the case with the automotive sector. iii)
These authors distinguish between "corporate power", "institutional power" and "collective power" exercised by actors within the network. Despite the centrality occupied by the firm in GPN analysis, this approach emphasizes the importance of non-firm agents and the regulatory structures that host them. Economic processes must be understood as complex multi-vertical and horizontal linkages. In this sense, they do not constitute mere nodes of a network as they are bounded by legal frameworks and regulatory structures while they impact upon the spaces where are established. These mutual linkages constantly reconfigure the space and relationships between nodes (Hardy et al., 2011). However, the GPN approach will not be explicitly reflected in our position indicator analysis as our unit of analysis is national economies. It is crucial to keep this in mind in relation to assessing the importance of non-firm actors in the various national positions within global production networks.
As we have pointed out, our unit of analysis is the different economies participating in the network of automotive production in the EU. Strictly speaking, in the GCC, GVC, and GPN approaches, the unit of analysis is firms (not countries), and power relations between firms in transnational industries. However, the country-level perspective that we adopt in this article is more reflected in world systems analysis which intends to analyse the consequences of a specific country’s external insertion into global value chains. Although there is a gap between the two levels of analysis, they are causally interrelated. It is possible to assign the overall domestic industry a position within the European automotive network, despite each domestic industry being comprised of firms with 9
various levels of power. In fact, we agree with Mahutga (2013) on the need to use national economies as the unit of analysis in order to enable comparisons between countries (not only between firms) and to connect with various issues of national economic performance. This is precisely the aim of our work, as we seek to associate network position with the ability of extra-EU export reorientation to serve as an engine for production recovery following the outbreak of the 2008 global financial crisis.
As mentioned above, power in GPN analysis is partly related to the ability of actors to decide how goods will be produced and by whom in GPNs. In our view, this power is not only important in determining inter-firm power relations but also inter-country trade relations. This idea provides support for methodologies that have sought to analyse such trade relations through position indicators. These indicators take an analysis of trade shares as their starting point, but they do so assuming certain premises from the global commodity and value chain literatures such as the differentiation of final and intermediate goods. Both allow us to position each country within the European automotive network.5
Methodology for network position analysis
5 Although not addressed in this paper, a position analysis can be developed based on the dynamics of technological change. While it is true that a wide range of firms participate in this dynamic, not all have the ability to lead and control such a process. In short, in terms of technology, it is also to speak of a hierarchical structure within the automotive sector clearly appreciating differences between producers and suppliers of parts and components (Dicken, 2003).
10
We identify two basic methodologies for measuring network position using trade flows. The first is called Positional Power Measurement and is based on the distinction between producer-driven and buyer-driven chains (Mahutga, 2013). The second is called Network Mapping. This is based on the pattern approach to world trade structures (Piana, 2006) which considers power as held jointly by both buyers and suppliers. These two methodologies are built for a similar purpose, and they share certain main characteristics. Both emerge from the same framework: the existence of identifiable hierarchical structures, where the role of each country arises from its relationships with all others. Further, while emphasizing that links are forged between enterprises from a chain or network perspective, both methodologies consider countries as the main unit of analysis. In this way, a country’s trade is an aggregate of the external exchanges of those enterprises located within it, meaning that it also reflects the position of the productive structure they collectively form. Positional power measurement is based on an indicator which quantifies and aggregates the relative importance of one country over others individually, thus yielding a specific measure of that country’s position. Network mapping illustrates the specific exchange network showing all the bilateral trade relations of a country which are classified by their relative importance. Hence, positional power measurement provides a single orderable value for each country, indicative of its relative position in the network while network mapping shows that position according to specific bilateral relations, their total number, and their relative importance. When combined these two methodologies provide a clear picture of the position of each country within the network.
Below we outline the special characteristics of each methodology with a view to highlighting their similarities and differences. 11
i) Positional power measurement defines the position indicator assuming control mechanisms that have been previously defined by the GCC approach (Gereffi, 1994) for two different types of governance structures: producer-driven and buyer-driven chains. Despite this having been later questioned and revised by Gereffi et al., 2005, due to the simplicity of classifying all existing governance structures into only two types, it remains useful for the general characterization of a given sector and its regional articulation. In any case, as we shall see, some of its critics have been considered in our analysis of positions in the European automotive network, taking into account the simultaneous existence of the two different governance structures within the network (producer-driven for final goods and buyer-driven for parts and components).
In the distinction made between governance structures guided by producers or by buyers, the leadership exercised by top firms differs both in the type of control and the direction in which it is exercised. In buyer-driven chains, this is exercised mainly backward, towards suppliers, depending on the ability of large buyers to use their bargaining power to induce competition among potential suppliers6 (Gereffi, 1994; Heintz, 2006; Mahutga, 2013). In this case, the companies that capture most of the value are the buyers or distributors. In the automotive sector, however, where assemblers are transnational companies leading the network, power relations follow the producer-driven distinction described by Gereffi (1994).7 Coordination and technology transfer mechanisms between assemblers and
6 This type of chain has been traditionally associated with the textile sector. 7 In the automotive production network there are mainly two types of companies: the "producers" or assemblers (TCNs leading the network, as owners of the brand and responsible for design), and
12
suppliers depend on the status of the latter (Sturgeon et al., 2008, Coe et al., 2008) where it is the producer or assembler companies that capture more value. Consequently, exporting to more countries which in turn comes to depend on a country’s own imports is a sign of better position and greater control of the network. Mahutga (2013) proposes two indicators for measuring the position in both types of governance structures: 8
Producer-driven9: this measures the relative quantity of exports from a reporting country over imports from its trade partners. The higher the value, the greater the importance of the reporting country as exporter (producer) over its partners.
Buyer-driven: this measures the relative quantity of exports from each partner over the imports coming into the reporting economy. The higher the value, the greater the volume of imports to the reporting country, thus weighing more heavily on the export structures of the trade partners.
the suppliers that produce parts and that sometimes perform certain assembly of same (Coe et al., 2008; Sturgeon, et al., 2008; Estrada et al., 1997). The division between assemblers and suppliers includes some simplification of the network’s organization, as inside suppliers are in fact comprised of different categories determined by the level of technological sophistication, the power within the network, or the type of labour relations (Banyuls and Lorente, 2010). 8 Other authors (Ferrarini, 2011) make national aggregations from the weighting of these same indicators with the share of each industry on total flows in a country. In our case, as we focus on a single sector, we have chosen the indicators of Mahutga (2013). 9 See Annex for technical details.
13
Although the literature associates the automotive industry with a producer-driven governance structure, where the power lies with the final producer, these companies consume intermediate inputs that are often not produced in the same country where they are installed. As we will see, there are also differences in specialization patterns if we distinguish final goods from parts and components. On the basis of this distinction it is possible to appreciate how different positions within the network are reflected both in the power of a producer of final goods and through the power of a buyer in intermediate goods as exerted by those same producers, the major automobile firms. The globalization of parts and components production and the increased competition among suppliers of these inputs mean that the overall sector cannot be characterized as embodying a single governance structure. Automotive producers also exert purchasing power over suppliers that can be measured through the buyer-driven indicator. The fundamental difference from typical buyer-driven chains is that parts and components are intermediate inputs which can help improve the export competitiveness of final goods (Timmer et al. 2013). In this regard, a better position in the buyer-driven chain of parts and components promotes a better export position in final goods.
Therefore, we consider it appropriate to calculate a Positional Power indicator, disaggregating exchanges of final goods and component parts.10 For the first case, we apply the producer-driven indicator (Mahutga, 2013), measuring the weight of exports of
10 This disaggregation has been made from the data of HS6 commercial classification by Eurostat. Under Chapter 87, final goods are considered to be those between codes 870110 and 870590, inclusive, while parts and components are considered those between codes 870600 and 870899.
14
final goods on import structures of the countries that receive them. For the second case, we apply the buyer-driven indicator measuring the share of imports of parts and components on the final exports of each country. Ultimately, what we measure with this method is the relative quantity of the exports of final goods from one country over the imports of the rest; or on the other hand, the relative quantity of imports of parts and components of one country over the exports of the rest. This allows us to obtain an aggregate measure of the position of a country within the regional network.
ii) Network mapping methodology considers that it is essential to know the number of relations between countries, jointly considering the “power to buy” along with the “power to sell” in order to understand the hierarchy of trade. The presence of trade relations is based on the existence of (or lack of) relations of dominance or dependence. In order to measure the degree and direction of the trade hierarchy Piana (2006) considers bilateral trade relations between pairs of countries. In order to perform a similar measurement we consider the bilateral exports and imports of each country vis-à-vis other countries in the automotive sector. These trade relationships are ordered so that if one country is among the five largest importers or exporters in relation to another, that country is considered to be relevant to their trade structure. Having identified the major trading partners in the European automotive sector, trade relations in the automotive industry between country A and country B are then described based on four criteria: 1. "For B, A is an important destination for exports"; 2. "For B, A is a relevant origin of imports"; 3. "For A, B is an important destination for exports"; 4. "For A, B is a relevant origin of imports". 15
In this way, sixteen possible combinations11 arise (see table A1, Annex), allowing us to identify what kinds of trade occurs among which countries by contextualizing sector-level data. A given country can have a share in the European market similar to another’s, but may engage in trade relationships with fewer countries at the same time. To summarize the two methodologies are complementary since they are focused on the analysis of positions within a network, considering the relative importance of some countries over others in terms of trade flows (exports and imports). The network mapping approach aims to provide a more complete picture of the overall network by showing and classifying bilateral trade relations. In contrast, the positional power approach provides a unique value that can used to rank countries’ positions in the network. In this positional indicator, we differentiate between final goods and parts and components according to the criteria outlined above.
Findings Background of the European automotive industry The EU is among the world's biggest automotive producers, and the sector represents the largest private investor in research and development in the automotive sector12 (ACEA, 2013). In 2014, more than 22% of global automotive production occurred in Europe, a
11
These are independent proposals, because each may be true or false independent of the
value of the other. For each pair of countries, we build a binary variable that takes the value 1 if the proposition is true, and 0 otherwise. 12
As an example, in 2012, six of the 20 enterprises with the highest R+D investment in the world
(three of them European) belonged to the automotive sector, the second most important sector in R+D investment behind the pharmaceutical industry (CCOO, 2015).
16
decrease of seven points from 2007 due to the financial crisis and the enormous growth in Asia where half of world production and the largest markets are now located. However, this change in the geographical distribution of automotive production has been influenced by the evolution of regional demand, and it does not imply a disintegration of European productive relations.
The organizational characteristics of the sector and its historical peculiarities have confined productive processes in the European Union to regional neighbours given the importance of proximity in respect to end-markets. This has also happened because of the existence of competitive ‘glue’ at different supply levels. At the same time, productive changes in recent decades have favoured a high degree of fragmentation and productive mobility combined with the increasing significance of extra-regional trade in the automotive industry. This has been observed in both the provision of inputs and the destination of end goods, although an articulated productive core remains in place around a primarily regional production chain in which each national industry takes up different positions. According to Eurostat, in 2015, fifteen out of twenty-eight EU partners represented more than 90% of share in the European automotive market (dominated by Germany, with more than a 30% share). In eight of the partner countries, more than 80% of automotive exports were destined for European markets. Only Germany and the United Kingdom registered higher exports to countries outside the EU, proving that these countries have been able to geographically reorient their exports in the face of declining European demand in the wake of the crisis. From the supply side, the degree of sectoral regionalization is even higher, with ratios above 75% for European imports over total sector imports for all EU members. Table 1. Main variables of the automotive industry by country 17
Table 2. variables of the
Main
Production 2014
Germany France United Kingdom Spain Italy Czech Rep Poland Sweden Hungary Slovakia Belgium Austria Romania Netherlands Portugal Slovenia Finland Denmark Bulgaria Ireland Estonia Lithuania Greece Croatia Latvia Cyprus Luxembourg Malta Total UE 28
Employment 2014
Over Over European Over national European automotive manufacturing automotive sector sector 42,3% 18,1% 34,7% 9,6% 9,1% 9,8% 9,3% 11,6% 6,4% 7,2% 12,5% 5,8% 6,1% 5,4% 6,9% 4,7% 24,8% 6,3% 3,7% 10,8% 7,3% 3,2% 12,9% 2,8% 2,9% 24,9% 3,5% 2,8% 32,7% 2,6% 2,2% 6,8% 1,5% 1,8% 8,2% 1,3% 1,6% 18,3% 6,4% 0,9% 2,3% 0,8% 0,9% 8,5% 1,3% 0,3% 10,6% 0,6% 0,2% 1,4% 0,3% 0,1% 1,0% 0,2% 0,1% 3,0% 0,8% 0,1% 0,5% 0,1% 0,0% 2,7% 0,1% 0,0% 1,3% 0,2% 0,0% 0,3% 0,1% 0,0% 1,0% 0,1% 0,0% 1,9% 0,1% 0,0% 0,3% 0,0% 0,0% 0,0% 0,0% 0,0% n.d 0,0% 100% 11,6% 100%
Over Over national European manufacturing automotive sector 11,3% 38,7% 7,6% 6,8% 6,0% 7,9% 7,9% 7,9% 4,3% 5,9% 12,1% 4,9% 7,1% 3,3% 10,4% 2,6% 12,2% 2,4% 13,1% 3,1% 7,0% 6,4% 5,0% 2,0% 12,7% 1,4% 2,8% 3,3% 4,8% 0,9% 6,9% 0,8% 2,0% 0,5% 1,3% 0,4% 3,3% 0,1% 1,8% 0,1% 3,2% 0,1% 1,8% 0,1% 0,7% 0,0% 1,0% 0,1% 1,4% 0,1% 0,5% 0,0% 0,0% 0,1% n.d 0,0% 7,8% 100%
Export 2015 Over Over national European manufacturing automotive sector 18,8% 20,3% 8,7% 11,1% 11,0% 14,3% 18,0% 7,8% 8,3% 6,9% 19,8% 2,7% 10,8% 3,4% 11,9% 3,2% 15,6% 1,9% 26,8% 2,0% 10,4% 8,6% 8,6% 3,4% 14,5% 1,2% 3,8% 5,3% 10,8% 1,4% 15,6% 0,9% 5,9% 1,1% 2,5% 1,3% 3,1% 0,4% 0,3% 0,7% 5,2% 0,3% 3,7% 0,4% 0,6% 0,4% 3,0% 0,2% 4,6% 0,2% 2,8% 0,1% 5,2% 0,5% 2,1% 0,0% 12,0% 100%
Import 2015 Over national manufacturing 9,7% 9,5% 12,3% 12,9% 8,9% 9,8% 8,3% 11,6% 10,4% 14,3% 11,4% 10,1% 8,8% 5,3% 11,4% 14,3% 8,8% 7,9% 7,4% 5,2% 8,7% 6,9% 3,7% 6,0% 7,4% 6,9% 10,1% 3,7% 9,7%
Source: Own calculations from Eurostat (SBS database) However, changes in the geographical distribution of automotive production have also been occurring within Europe with the movement being towards the Eastern European countries. Germany is clearly the main producing country, accounting for more than 42% of regional sector production and 34% of sector employment. This is distantly followed by the traditional European producer countries – France, the United Kingdom, Spain and Italy – and then by producer countries in Eastern Europe. Despite the lower share of regional production of Eastern European countries, the relative importance of the sector within each economy is much higher in terms of their share of production, employment, and trade in most cases, underlining the distinct regional nature of production and the external exposure of the sector within these countries. It is also worthwhile noticing the difference in the regional distribution of the number of enterprises which is more or less
18
similar among the traditional producer countries in Western Europe and reflected in the huge concentration in Germany in terms of production, employment, or exports. Table 2. Number of total and foreign automotive enterprises by country Number of total entreprises 2014 Over European Over national automotive manufacturing sector Germany 13,4% 1,3% United Kingdom 14,1% 2,2% France 10,4% 0,9% Italy 11,9% 0,6% Poland 6,9% 0,8% Spain 8,2% 1,0% Netherlands 3,8% 1,2% Sweden 5,5% 2,0% Czech Rep 5,7% 0,7% Belgium 2,2% 1,2% Portugal 3,5% 1,0% Austria 1,6% 1,2% Hungary 2,5% 1,0% Romania 2,3% 0,9% Slovakia 1,4% 0,4% Finland 1,3% 1,2% Croatia 0,6% 0,6% Slovenia 0,9% 0,9% Bulgaria 0,6% 0,4% Rest EU countries 3,3% Total UE 28 100% 0,9%
Foreign entreprises (% over total automotive sector, 2013) Number of enterprises
Production
Employment
9,5% 6,8% 9,4% 4,9% 37,9% 10,5% 6,1% 7,5% 19,4% 6,9% 7,8% 11,6% 28,4% 38,6% 36,6% 3,1% 8,7% 11,5% 19,1%
15,5% 88,2% 25,7% 20,3% 89,5% 89,5% 76,8% 61,3% 94,8% 89,4% 85,8% 84,5% 96,4% 95,9% 96,2% 42,7% 78,9% 52,5% 85,8%
19,8% 65,2% 25,9% 22,2% 77,8% 76,3% 58,6% 58,5% 83,1% 72,8% 63,5% 68,2% 86,1% 90,3% 90,6% 31,4% 62,3% 36,5% 80,2%
Source: Own calculations from Eurostat (SBS and FATS database) Table 3. Number of assembly plants and corporate automotive groups in each country, 2014
19
Total number Germany
41
United Kingdom
33
France
33
Italy
23
Poland
15
Spain
14
Netherlands
10
Sweden
9
Czech Rep
8
Belgium
8
Portugal
6
Austria Hungary Romania Slovakia Finland Croatia Slovenia Bulgaria Total UE 28
5 4 3 3 2 2 1 1 221
Corporate groups VOLKSWAGEN AG , AC, BINZ GmbH, BMW GROUP, DAIMLER AG, FORD OF EUROPE, IVECO , OPEL GROUP, WIESMANN VOLKSWAGEN AG , ALEXANDER DENNIS, ASHOK LEYLAND COMPANY, ASTON MARTIN , BMW GROUP, CATERHAM, DAIMLER AG, DENNIS EAGLE, ENVISAGE GROUP, FORD OF EUROPE, GEELY UK LTD, GINETTA , HONDA , MCLAREN, LEYLAND TRUCKS, LOTUS GROUP , MORGAN , NISSAN MOTOR COMPANY , OPEL GROUP, SAIC MOTOR, TOYOTA MOTOR EUROPE, WRIGHTBUS VOLKSWAGEN AG, DAIMLER AG, IVECO , MDI, PSA PEUGEOT CITROËN , RENAULT SA, TOYOTA MOTOR EUROPE, VOLVO GROUP VOLKSWAGEN AG , BREDAMENARINIBUS , BREMACH , DR MOTOR, FCA, IVECO , PAGANI , PIAGGIO VOLKSWAGEN AG, FCA, SOLARIS, OPEL GROUP, TOYOTA MOTOR EUROPE, FCA, VOLVO GROUP , JELCZ VOLKSWAGEN AG , DAIMLER AG, FORD OF EUROPE, IRIZAR, IVECO , NISSAN MOTOR COMPANY, OPEL GROUP, PSA PEUGEOT CITROËN , RENAULT SA VOLKSWAGEN AG , DAF TRUCKS NV , VDL GROUP, DONKERVOORT , TESLA MOTORS, GINAF, SPYKER NV VOLKSWAGEN AG , KOENIGSEGG AUTOMOTIVE AB, VOLVO GROUP , NEVS VOLKSWAGEN AG , TPCA (TOYOTA MOTOR CORP - PSA), TEDOM, TATRA , SOR, IVECO, HYUNDAI MOTOR EUROPE VOLKSWAGEN AG , VOLVO CAR CORPORATION (GEELY), VOLVO GROUP , VAN HOOL, IMPERIA AUTOMOBILES, VDL GROUP, MOL CY NV, DAF TRUCKS NV VOLKSWAGEN AG , RENAULT SA , PSA PEUGEOT CITROËN , TOYOTA MOTOR EUROPE, DAIMLER AG, CAETANOBUS VOLKSWAGEN AG, OPEL GROUP, MAGNA STEYR, IVECO, BMW GROUP VOLKSWAGEN AG, SUZUKI , DAIMLER AG, OPEL GROUP ROMAN, RENAULT SA , FORD OF EUROPE VOLKSWAGEN AG , PSA PEUGEOT CITROËN, HYUNDAI MOTOR GROUP VALMET AUTOMOTIVE, SISU AUTO DOK-ING RENAULT SA LITEX MOTORS
Source: ACEA database
These differences become even clearer if we look at the same variables in terms of enterprise ownership. First, traditional producing countries (Germany, the UK, France, Italy, and Spain), the Netherlands and Belgium have a low proportion of foreign enterprises as part of the total sector, revealing the density of the internal sector make-up. However, only in Germany, France, and Italy do these domestic enterprises contribute more than foreign forms in terms of production or employment. Unsurprisingly, these countries have a high concentration of assembly plants (except the UK which is characterised by geographic and production particularities) and host their own national groups and brands – Germany’s Volkswagen, France’s PSA and Renault, as well as Italy’s FCA. In terms of enterprise groups, Volkswagen has mot production locations in the EU with a presence in 14 countries, followed by Opel in six countries (also originally
20
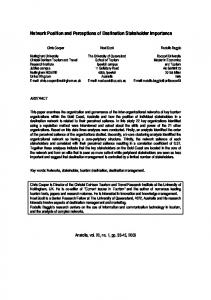
German, now a subsidiary of the USA’s GM group), and PSA and Renault in five countries. The high number of assembly plants in Spain and Poland is also remarkable in addition to the low number of assemblers in Hungary or Slovakia while the contribution by foreign enterprises to production or employment is high in all these countries. Additionally, the automotive sector in these cases is highly important to the manufacturing sector as a whole. This may be taken as evidence of hierarchical articulation relations and of the need to develop further positional analyses within the automotive industry. Network mapping Position analysis in the automotive industry following this methodology reveals patterns that have remained virtually unchanged over time. Figures 1 and 2 indicate the main results following the application of the network mapping methodology to trade in the European automotive industry. Here we represent the relations between the main European producing countries. Figure 1. Dominance and dependency in trade relations in the European Automobile Sector, 2013
21
Source: Own calculations based on data from Eurostat Comex Database
It becomes immediately obvious that so-called dominance relations and their opposite counterpart, dependency relations, are the most obvious throughout the period with a high degree of concentration of production and trade in a small number of countries. German dominance is, without doubt, the most remarkable factor and consistent with Germany’s relevance as both a producer and consumer country. Germany is the only economy that establishes relevant relations with all the other producer countries. At the same time, other countries including some of the large producers do not maintain relations with the majority of EU member states. For example, in 2013 Italy did not maintain relevant relations with thirteen, and Spain with nineteen other member states). Furthermore, Germany’s trading relationships are mainly of the dominance-type. This implies that Germany is a major buyer in and supplier to each country. At the same time, no dependency relationship has emerged for Germany.
22
Figure 2. Integration in trade relations in the European Automobile Sector, 2013
Source: Own calculationes based on Eurostat Comext Database
France, Italy, and the United Kingdom are also listed as major economies in this sector, although with far fewer relationships of dominance than Germany has. Only France increased its number of dominance relationships between 1999 and 2013 while Italy and the United Kingdom both reduced the number of such relationships. Moreover, neither Spain has managed to establish any dominance relationship over the period (although it is among the five main European producers), nor have the emerging producer countries in Eastern Europe. In fact, only the Czech Republic showed one dominant relationship in 2013.
In the case of the Spanish economy, the recent import contraction has reduced the number of its trading relationships although it still maintains significant trading relationships with France, Italy, and Portugal. Spain maintains its role as a supplier although it has lost its 23
relevance in the regional automotive network. This role is increasingly taken up by Eastern Europe producer countries such as the Czech Republic and Poland. This is evident from the increasing number of source-dominance (Sd) relationships of these two countries while Spain has experienced a reduction of the same types of relationships.
In short, the intense process of fragmentation and relocation of production experienced in the last 15 years has changed the positions of some supplier countries in the regional European automotive production network, but it has not challenged the German dominance of the European automotive sector. As suggested in the previous section, different national positions in this network are indicative of the capacity of lead firms to decide how and where production and trade occurs. Therefore, these positions are also closely related to a nation’s ability for extra-EU export reorientation.
Positional power measurement Adapted to the automotive sector positional power measurement (as noted in Section 3) complements the previous analysis since it allows the authors to differentiate between final goods and parts and components (intermediate goods). In this way, it becomes possible to relate the position as a seller of final goods (export competitiveness) with the position as a buyer of intermediate goods (the fragmentation of production). Ultimately, a higher capacity to organize production fragmentation allows for a greater improvement in competitiveness. This may be obvious, but it is also interesting to note the varying positions of producer countries as they are being played out against each other.
Figure 3. Producer-driven indicator, considering final goods over total flows
24
Source: Own calculations based on data from Eurostat Comex Database
The results of the position indicator considering trade in final goods illustrates once again the German dominance within the industry. The relative share of German exports of final goods over total trade of the sector is much greater than for any other European producer. Although the five main producers (Germany, the UK, France, Italy, and Spain) have all experienced a certain weakening of their position (most pronounced in the case of France), the ranking has not been significantly altered. Germany retains the strongest position as a supplier of finished goods despite the emergence of new producer countries such as the Czech Republic, Hungary, and Poland. Figure 4: Buyer-driven indicator, considering parts and components over total flows
25
Source: Own calculations based on data from Eurostat Comex Database
The buyer-driven indicator results, calculated only for trade in parts and components (intermediate goods), emphasizes the strengthening trend experienced by certain major producers (Germany, Spain, and France) and the ascent of new countries. This demonstrates the increasing fragmentation and productive mobility in the sector as well as the degree of regional interdependence. Although Germany is the country with the greatest purchasing power within the network, the gap between the major producer countries in Western Europe and Eastern Europe has been reduced in terms of the buyerdriven indicator. In other words, there is less concentration of power in the existing producer-driven terms.
The results show that the growing fragmentation of production has consolidated the position of Germany within the network, both as a buyer of intermediate goods and as a provider of final goods. In the next section, we will examine whether there is a connection
26
between the positions occupied within the regional network and the projection of exports outside the EU.
Geographical and technological export trends in the EU automotive sector The aim of this section is to analyse export patterns in the automotive European sector in order to assess the importance of demand from outside the EU as a driver of export growth. First, we look at the general intra- and extra-EU export trends, distinguishing between final goods and intermediate goods (parts and components). Then we proceed further with the analysis, distinguishing between the technological contents of these exports. Given the difficulty in presenting this analysis for all EU countries, we focus on three economies which we considered to be representative of different positions on the network: Germany, Spain, and the Czech Republic.
General trends in trade flows, intra- and extra-EU The geographical reorientation of exports in the automotive sector has been occurring while a high level of regionalization of production has been maintained. This is manifested in the low weight of imports from outside the EU and in the growth of exports with an extra-EU destination. Between 1999 and 2014, exports to non-EU countries recorded a simple variation rate of 210%. In 1999, these exports accounted for 22.9% of total exports, growing to 36.6% by 2014, particularly since 2009 when they represented 26.9%13. However, this export reorientation at the aggregate level can be said to feature many individual nuances.
13 Extra-EU imports are mainly concentrated in final goods (in 2014, 63% of total imports of extra-EU origin) so the fragmentation and integration of production have been maintained at the
27
Figure 5. EU-27 trade in the automotive industry (millions €) 400000
350000
300000
250000
intra-EU export extra-EU export
200000 intra-EU import 150000
extra-EU export
100000
50000
0 1999 2000 2001 2002 2003 2004 2005 2006 2007 2008 2009 2010 2011 2012 2013 2014
Source: Own calculations based on data from Eurostat Comex Database
In 2014, thirteen of the fifteen major European producing countries 14 in the automotive sector recorded a ratio of intra-EU exports above 60% of total exports – six of them with
regional level, despite the increased volume of extra-regional trade. Imports of EU origin are above 77% of total imports in all economies considered, and over 85% in twelve of the fifteen nations considered. 14 Germany, the United Kingdom, France, Spain, Italy, Netherlands, Sweden, Austria, Belgium, Portugal, the Czech Republic, Poland, Hungary, Romania, and Slovakia. Aggregated exports from these economies represented 97.5% of total exported in 2014 by the European automotive sector.
28
a ratio higher than 80%15, and the top five at 70%16. Only in Germany and the UK were the exports with an extra-EU destination higher (at 52% and 55%, respectively). Hence, the data show that despite the growth of exports outside of the EU, the European Community remains the primary customer for practically all members of the Union. This means that the increasing "globalization" of exports conceals very uneven trends and qualitatively different export patterns across countries according to their positions in the regional network. To further explore these differences and connect them with our findings in the previous section, it is necessary to make a sector-wide breakdown of the flows between final goods and parts and components.
Thus, we find that over 78% of total sector exports corresponded to finished goods in 2014. This was similar to the percentage recorded in 2007. In other words, both categories, finished goods and parts, registered similar growth rates throughout this period – both around 55% considering total EU flows although there were significant differences amongst the producer countries. In any case, in the global market, Europe fundamentally competes as a supplier of finished goods which is consistent with the importance that the regional production networks still carries. At the same time, only Germany and the UK recorded a higher sales weight of final goods with non-EU
15 Spain, Czech Republic, Poland, Hungary, Belgium, and Portugal. 16 France, Austria, Netherlands, Slovakia, Romania, Italy, and Sweden are between 60% and 70%.
29
destinations with ratios above 55% in 2014. All other European partners exported primarily to the EU market.17
The sectoral breakdown of flows between parts and components and finished goods allows us to interrelate export capacity (competitiveness) and import dynamics, revealing an interesting trend connected to that observed in the previous section: those countries with the highest increases in total exports of final goods are precisely those with the largest increases in imports of parts and components (Figure 6). Furthermore, the results show the strengthening of the sector on the European periphery, even as different trends emerge between Germany and the UK. Note that the figure shows simple variation rates. Hence, it is to be expected that countries with very low export volumes have recorded very high rates.
Germany, the largest exporter, does not record higher rates of variation, but it is the country with the greatest increase in its share of total EU exports, especially exports with a non-EU destination. In other words, the nation’s export leadership has been strengthened. Between 2007 and 2014 Germany increased its share over total EU automotive exports by 4 points, the UK by 2.7 points, and the Czech Republic by 0.8, while most other countries reduced this share18. We find therefore that the
17 In five of the fifteen selected countries –Slovakia, Germany, Spain, Belgium, and the United Kingdom– exports of final goods exceeded 70% of sector exports in 2014. In the case of the United Kingdom and Belgium, they exceeded 80%. 18 In Spain and the Czech Republic, the share of extra-EU exports among total exports has increased by between 4 to 6 points (in 2008, they represented 15.5% and 11.2% of total exports, respectively, and 19.5% and 16.2% in 2014). Germany in the same period recorded an increase
30
competitiveness of exports of finished goods is directly linked to the intensification of production fragmentation, allowing the best-positioned countries to make a faster shift towards foreign markets. Figure 6. Variation of final goods exports and imports of parts and components, simple variation rate 2007-2014 Czech Rep.
80% Hungary
60% Slovakia Poland
Germany
Imports of parts and components
40%
20% Spain -90%
-70%
-50%
-30%
France
0% -10%
10%
-20%
30%
50%
70%
90%
United Kingdom
-40% Greece -60%
R² = 0,51327
-80% Exports of final goods
Source: Own calculations based on data from Eurostat Comex Database
In summary, considering trade flows at the sectorial level, two general trends are highlighted. First, regarding the origin and destination of flows, the increase in exports
of 37.8% (to 51%), and it was also the country with the largest share of extra-EU exports (53.3% in 2013), while those of Spain and the Czech Republic remained very low (at 4.5% and 2.2%, respectively).
31
with non-EU destinations presents a very unequal distribution among countries. Second, the breakdown between finished goods and parts shows that the growth of automotive exports to non-EU destinations has been especially strong in finished goods, sustained amid a growing fragmentation of production. This has mainly been the case for Germany, which is best-positioned according to the indicators used in the previous section.
Export pattern analysis Following from the previous analysis, we disaggregate the sector further in order to take into consideration the different technological contents of exported goods. Given the difficulty of presenting this analysis for all countries, we again focus on three economies that are representative of the various profiles in the network: Germany, Spain, and the Czech Republic.
Within the category of final goods there are different types of vehicles, passenger cars being those with the highest weight among the main European producer countries and the type to which we refer here. However, there are numerous models within this subcategory with important differences in terms of their production and technological complexity such as the type of engine used (diesel or gasoline) or in its cubic capacity. Table 4. Exports of cars by final good in 2014 and variation since 1999 (% over automotive sector)
Germany Intra
Spain Extra
Intra
Czech Rep. Extra
Intra
Extra
Gasoline
2014
19992014
2014
19992014
2014
19992014
2014
19992014
2014
19992014
2014
19992014
< 1,000cc
1.0%
0.7
0.1%
0.1
1.5%
-3.6
0.2%
-0.1
5.2%
5.2
0.1%
0.1
1,000 cc - 1,500 cc
2.5%
-0.1
1.5%
1.3
11.7%
-6.4
2.4%
1.0
12.1%
1.9
1.9%
0.8
32
1,500 cc - 3,000 cc
3.0%
-15.1
18.8%
4.3
8.7%
-7.3
3.1%
1.0
3.8%
-13.7
5.1%
2.6
> 3,000 cc
1.1%
-1.1
7.7%
-0.8
0.1%
0.0
0.2%
0.2
0.3%
0.3
0.0%
0.0
< 1,500 cc
0.8%
0.7
0.1%
0.1
5.8%
5.3
1.2%
1.2
0.8%
0.8
0.0%
0.0
1,500 cc - 2,500 cc
14.9%
1.1
3.9%
3.2
21.8%
4.2
2.8%
2.1
20.5%
0.3
3.6%
2.5
> 2.500cc
3.6%
2.1
1.8%
1.5
0.6%
-1.1
0.1%
-0.1
0.2%
0.2
0.1%
0.1
TOTAL
26.8%
-11.6
33.9%
9.8
50.2%
-8.9
10.1%
5.3
43.0%
-5.1
10.9%
6.2
Diesel
Source: Own calculations based on data from Eurostat Comex Database
The first highlight of the above table is the weight of exports of mid-range vehicles (of both 1,000 to 3,000 cc gasoline engines, and of diesel engines between 1,500 and 2,500 cc) in the three economies. However, while exports of diesel vehicles are mainly concentrated within the EU, exports outside the Union are concentrated in gasoline vehicles, especially in the segment between 1,500 and 3,000 cc, where the Germans dominate and in higher capacity vehicles, meaning gasoline engine over 3,000 cc and diesel engines over 2,500 cc. In fact, exports of vehicles outside the EU with a capacity between 1,500 and 3,000 cc constituted the largest category of German exports in 2014. Comparing these data with those recorded in 1999, the crisis has mainly impacted on intra-EU exports, especially of gasoline vehicles19. This decrease has been compensated in the case of Germany by extra-EU exports, mainly by mid-range vehicles. Meanwhile, Spain has strengthened its expertise in diesel vehicles destined for EU markets. Czech growth has been more in low-end gasoline vehicles. These were also destined for EU markets – a segment where Spain has lost ground, thus confirming the regional production reconfiguration process. Hence, while Germany is strengthening its expertise in exports
19 However, the effect of the crisis on European demand is added to the previous growth trend of diesel vehicles.
33
outside the EU, Spain and the Czech Republic are mainly specializing in mid- and lower range vehicles for the internal EU market. It should be noted that the decline in relative importance of exports in both Germany and Spain to the European Community market is higher than the increase recorded in extraEU exports. This implies that the importance of parts and components exports in the sector structure has increased in these countries. However, within the category of parts and components, there are also several distinct kinds of goods in terms of production and technological complexity, each of which transfer different values to final goods, and which result in different export patterns and import dependencies. Pavlinek, Domansky and Guzik (2009) propose a classification of parts and components in the automotive sector in terms of value added to the final product. First, those with low added value are mainly composed of body and parts, wires, bumpers, mufflers, exhaust pipes, and wheels. Those with high added value are engines, transmission systems, and steering and brake systems. The remaining assets would fall into a category of medium value20. Table 5. Exports of parts and components of motor vehicles (except those of motorcycles) by value added (intra-UE and extra-UE) in 2014 and variation since 1999 (% over total automotive sector)
High Medium Low TOTAL
Germany Intra Extra 2014 1999-2014 2014 1999-2014 5,6% 1,0 5,7% 4,2 1,9% 0,2 1,2% 0,6 3,1% -0,4 2,9% 1,8 10,5% 0,9 9,8% 6,7
Spain Intra Extra 2014 1999-2014 2014 1999-2014 3,5% -0,4 0,9% 0,8 4,4% 0,0 1,0% 0,8 2,5% 0,0 0,8% 0,7 10,4% -0,5 2,8% 2,4
Czech Rep. Intra Extra 2014 1999-2014 2014 1999-2014 9,4% 1,6 1,9% 1,4 9,1% 4,2 1,0% 0,7 13,2% -2,2 1,5% 1,2 31,7% 3,6 4,4% 3,4
Source: Own calculations based on data from Eurostat Comex Database
20 For the identification of these products, we have used classifications of the Harmonized System 8 digit (HS8) offered by Comext (Eurostat).
34
Analysing only parts and components exports we detected trends similar to those already shown in the segment on final goods. Germany achieved significant growth in products of higher value and in non-EU orientation. In 2014, Spanish and Czech exports of parts and components with destinations outside the EU were insignificant, while in Germany they reached a ratio similar to that of exports destined for the EU with higher value added parts playing a more active role. Since 1999, the growth in higher value added parts (again, engines, transmission systems, and steering and brake systems) has been more than 4 percentage points (above the total exported by the sector) in the case of Germany, compared to 1.4 points for the Czech Republic and 0.8 for Spain. Discussion The above analysis offers new elements to the discussion on network positioning in GPNs. We find that indicators based on trade flows allow for an initial empirical approach to the analysis of inter-firm power relations within production networks. This also proves to be a suitable operational methodology for adopting a national perspective, as demonstrated in our study, given the interest in linking the position of a national industry to questions of sector competitiveness. Analysis of trade trends gains importance as international production fragmentation grows, and as outsourcing or offshoring of activities become widespread. Variables that were once exclusive aspects of the production dimension now extend to the trade dimension. In other words, as production fragmentation grows, production is atomised, causing trade among different units to become integrated. In a similar fashion, control methods and the position of one country over another go beyond traditional control mechanisms of ownership through foreign direct investment, increasing the importance of other non-equity forms that may be manifested in the destination, origin, and relative volume of the trade relationships. This methodology can be complemented with other applications at the firm level, through case 35
studies that allow for more specific information on property relations and control of the processes of technological innovation. Both these issues are fundamental to understanding the relationships of intra-network power.
Although use of the buyer-driven indicator for the parts and components subsector and of the producer-driven indicator for final goods represents a slight deviation from the methodology proposed by Mahutga, it allows us to better capture the relationship between the process of production fragmentation (found mainly in booming trade in parts and components) and competitiveness in final goods. Thus, the use of these indicators contributes to assessing which countries have benefited most from international production fragmentation in terms of improving their competitiveness in final goods. This information is complementary to the methodology provided by Piana who notes the importance of geographical concentration of trade as a source of evidence proving the existence of relations of production integration, domination, or dependence.
Conclusion The study of the patterns of international integration in the automotive industry requires a focus on both global and regional production networks in order to understand the specialization patterns and assess to relative positions of producer countries within the European automotive network. The analysis developed in this article confirms a general conclusion: the best-positioned country in the EU regional network has increased its exports outside the EU especially since the 2008 crisis. By contrast, more subordinate countries continue to be heavily dependent on the regional market. Therefore, we can confirm that the scope of a strategy for diversification of exports outside the EU is deeply
36
influenced by the position of a given national industry within the regional network (which, as we have seen, exhibits profound inequalities).
It is also possible to draw two conclusions about the link between the position and reconfiguration of exports by the type of goods exported. First, the growth of automotive exports with destinations outside the EU has been fuelled by fragmentation, and by regional production integration, particularly in the case of Germany. That is, the German automotive industry increased its exports of mainly final goods outside the EU by increasing its imports of parts and components which tended to be of EU origin. Second, the technological-content analysis performed for three representative economies (Germany, Spain, and the Czech Republic) showed marked differences in export specialization patterns, combined with higher or lower levels of regional demand dependence and with different patterns of technological specialization.
In other words, while diesel vehicle exports are mainly concentrated within the European Community market, exports outside the Union are concentrated in mid-range gasoline vehicles (especially German) as well as those on the highest range. Spain has strengthened its expertise in diesel vehicles destined for EU markets while the Czech Republic has advanced its position in low range gasoline vehicles. In the parts and components subsector, Germany again achieved significant growth in products with higher added value and of extra-EU orientation.
Finally, these findings reopen the debate on the determinants of competitiveness. As has already been pointed out by several authors, an increase in exports depends largely on the dynamism of the trading partners. This dynamism has recently increased through extra37
EU demand, benefiting those with greater outreach to external markets. However, outward projection is not entirely independent of regional organization of production; indeed, quite the opposite is true, making the position in the chain a key determinant of the export potential for each national industry.
References ACEA (2015) The Automobile Industry Pocket-Guide 2016-2017. Brussels: European Automobile Manufacturers Association Banyuls J and Lorente R (2010) La industria del automóvil en España: globalización y gestión laboral. Revista de Economía Crítica 9: 30-52. Bair J (2005) Global Capitalism and Commodity Chains Looking Back, Going Forward. Competition and Change 9(2): 153-180. CCOO (2015) Informe de situación de la industria automotriz en España, Comisiones Obreras Industria, Secretaria General de Estrategias Industriales, Madrid. Coe NM, Hess M, Yeung HW-Ch, Dicken P and Henderson J (2004) `Globalizing´ regional development: a global production network perspective. Transactions of the Institute of British Geographers 20(4): 468-484. Coe, NM, Dicken P and Hess M (2008) Global production networks: realizing the potential. Journal of Economic Geography 8(3): 271-295.
Dicken P (2003) Global Production Networks in Europe and East Asia: The Automobile Components
Industries.
GPN
Working
Paper
7,:
Available
at:
http://www.sed.manchester.ac.uk/geography/research/gpn/gpnwp7.pdf (accessed 1 April 2015)
38
Domanski B, Lung Y (2009) The changing face of the European periphery in the automotive industry. European Urban and Regional Studies 16(1): 5-10 Estrada, B; Gil, JI and Soto, F (1997) ¿Dónde empieza y dónde termina la industria del automóvil? Análisis de un caso de externalización productiva: Opel España. Madrid: Federación de Industria de Comisiones Obreras. European Commission. 2010. "The impact of the global crisis on competitiveness and current account divergences in the euro area". Quarterly Report on the Euro Area 9(1). Ferrarini B (2011) Mapping vertical trade. WP 263, ADB Economics. Manila: Asian Development Bank. Fortwengel J (2011) Upgrading through Integration? The Case of Central European Automotive Industry System. Transcience Journal 2(1): 1-12 Frigant V, Layan J-P (2009) Modular production and the new division of labour within Europe. The perspective of French automotive parts suppliers. European Urban and Regional Studies 16(1): 11-25 Frigant V, Zumpe M (2014): Are automotive Global Production Networks becoming more global? Comparison of regional and global integration processes based on auto parts trade data. Munich Personal RePEc Archive, Paper No. 55727. Available at: https://mpra.ub.uni-muenchen.de/55727/1/MPRA_paper_55727.pdf (accessed 15 May 2015) Gereffi G, Humphrey J and Sturgeon T (2005) The governance of global value chains. Review of International Political Economy 12(1): 78-104. Gereffi G and Korzeniewick RP (1994) Commodity Chains and Global Capitalism. Westport: Praeger.
39
Gibbon P, Bair J, Ponte S (2008) Governing global value chains: an introduction. Economy and Society 37(3): 315-338. Hardy J, Sass M and Pollakova M (2011) Impacts of horizontal and vertical foreign investment in business services: the experience of Hungary, Slovakia and the Czech Republic. European Urban and Regional Studies 18(4): 427–443. Heintz, J (2006) Low-wage manufacturing and global commodity chains: a model in the unequal exchange tradition. Cambridge Journal of Economics 30: 507-520. Henderson J, Dicken P, Hess M, Coe N and Yeung, H W-Ch (2002) Global production network and the analysis of economic development. Review of International Political Economy 9(3): 436-464. Hess M (2008) Governance, value chains and networks: an afterword. Economy and Society 37(3): 452-459. Hopkins TK, Wallerstein I (1977) Patterns of Development of the Modern World-System. Review 1(2): 111-145. Humphrey J, Memedonic O (2003) The global automotive industry value chain: What prospects for upgrading by developing countries. Vienna:UNIDO. Jürgens U, Krzywdzinsky M (2009) Changing East-West Division of Labor in the European Automotive Industry. European Urban and Regional Studies 16(1): 27-42. Kaplinsky R (2000) Globalisation and Unequalisation: What Can Be Learned from the Value Chain Analysis? The Journal of Development Studies 37(2): 117-146. Los B, Timmer M, Stehrer R and Vries GJ (2015) How Global Are Global Value Chains? A New Approach to Measure International Fragmentation. Journal of Regional Science, 55(1): 66-92.
40
Mahutga MC. (2013) Global Models of Network Organization: the Positional Power of Nations and Economic Development. Review of International Political Economy 21(1): 157-194. Mahutga MC (2014) Production Networks and the Organization of the Global Manufacturing Economy. Sociological Perspectives 57(2): 229-255. Mahutga MC. and Smith, D (2011) Globalization, the Structure of the World- Economy and Economic Development. Social Science Research, 40(1): 257-272. Pavlinek P, Domanski B and Guzik R (2009) Industrial upgrading through Foreign Direct Investment in Central European Automotive Manufacturing. European Urban and Regional Studies 16(1): 46-63. Piana V (2006) The pattern approach to world trade structures and their dynamics. Conference on Observing Trade: Revealing International Trade Networks and Their Impacts Princeton University for International and Regional Studies, New Jersey. Starosta, G (2010) Global Commodity Chains and the Marxian Law of Value. Antipode 42(2): 433-465. Sturgeon T (2008) From Commodity Chains to Value Chains: Interdisciplinary theory building in an age of Globalization. In Bair, J. (ed.) Frontiers of Commodity Chains Research. Stanford: Stanford University Press, Stanford, pp. 110-135. Timmer M, Los B, Stehrer R and Vries, G (2013) Fragmentation, Incomes and Jobs. An Analysis of European Competitiveness. Working Paper Series nº 1615. Frankfurt: European Central Bank. UNCTAD (2013) World Investment Report 2013. Global Value-Chains: Investments and Trade for Development. Geneva: United Nations.
41
42
ANNEX
Table A1. Trade Network Relations Binary description
Abbreviation
Absence of relationships
0000
NR
The countries "ignore" each other
Source dependence
0001
Sdp
B is an important provider for A
Destination dependence
0010
Ddp
B is an important market for A
Dependence
0011
Dp
B is very important to A, but the reverse is not true
Source dominance
0100
Sd
A is an important provider for B, but A can ignore B
Source integration
0101
Si
They both need each other as providers
Mono out-integration
0110
Moi
One flow is important for both: the exports of A to B
Dependent source interconnection
0111
Dpsi
A depends on B, but B needs A only as a source of supply
Destination dominance
1000
Dd
A is an important destination for B, while A can ignore B
Mono in-integration
1001
Mii
One flow is important for both: the exports from B to A
Destination integration
1010
Di
They both need each other as exporters
Dependent destination interconnection
1011
Dpdi
A depends on B, but B needs A only as a destination
Dominance
1100
D
A is very important to B and can afford to ignore it
Dominant source interconnection
1101
Dsi
Name
Qualitative description
A is very important to B but A needs B only as a source
43
Dominant destination interconnection
1110
Ddi
A is very important to B, but A needs B only as a destination
Integration
1111
I
They need each other on equal footing
Source: Piana (2006)
Producer-driven indicator
where Xji are exports from country j to country i, and Yi is total imports from country i.
Buyer-driven indicator
where Yij are imports to country j from country i, and Xi is total exports of country i.
44


![[halshs-00561393, v1] Network Position and ...](https://m.moam.info/img/260x300/halshs-00561393-v1-network-position-and-_5b829589097c47b7758b46f0.jpg)


