PREDICTING JOINT CHOICE USING INDIVIDUAL DATA
Anocha Aribarg, Neeraj Arora, and Moon Young Kang*
January 2009
Forthcoming, Marketing Science
*
Anocha Aribarg is Assistant Professor of Marketing at Stephen M. Ross School of Business University of Michigan, 701 Tappan Street, Ann Arbor, Michigan 48109. e-mail:
[email protected]. Neeraj Arora is Arthur C. Nielsen, Jr., Professor of Marketing Research, Wisconsin School of Business, University of Wisconsin- Madison, 4191C Grainger Hall, 975 University Avenue, Madison, Wisconsin 53706. e-mail:
[email protected]. Moon Young Kang is PhD student (marketing), Wisconsin School of Business, University of WisconsinMadison, 975 University Avenue, Madison, Wisconsin 53706. e-mail:
[email protected]. Author names are listed in an alphabetical order. The authors thank Paul Metz and Jane Burch of C&R Research and the TeensEyes panel for supporting this research.
1
2
PREDICTING JOINT CHOICE USING INDIVIDUAL DATA
Abstract Choice decisions in the marketplace are often made by a collection of individuals or a group. Examples include purchase decisions involving families and organizations. A particularly unique aspect of a joint choice is that the group’s preference is very likely to diverge from preferences of the individuals that constitute the group. For a marketing researcher, the biggest hurdle in measuring group preference is that it is often infeasible or cost prohibitive to collect data at the group level. Our objective in this research is to propose a novel methodology to estimate joint preference without the need to collect joint data from the group members. Our methodology makes use of both stated and inferred preference measures, and merges experimental design, statistical modeling, and utility aggregation theories to capture the psychological processes of preference revision and concession that lead to the joint preference. Results based on a study involving a cell phone purchase for 214 parent-teen dyads demonstrate predictive validity of our proposed method. Keyword: joint decision making, preference revision, utility aggregation, Bayesian
3
Choice decisions in the marketplace are often made by a collection of individuals or a group. Examples include families and organizations. A particularly unique aspect of a joint choice is that the group’s preference is very likely to diverge from preferences of the individuals that constitute the group (Corfman 1991; Davis 1973). While marketing scholars have done well in developing preference models at the level of an individual, limited research (e.g. Krishnamurthi 1988; Curry, Mensaco and Van Ark 1991; Arora and Allenby 1999; Aribarg, Arora and Bodur 2002) has studied preferences of a group. The use of preference of the primary decision maker as the surrogate for a group’s preference appears to be a common practice in the industry. For marketing researchers, the biggest hurdle in measuring group preference is the infeasibility and high cost of data collection at the group level. In a Business-to-Business context involving the purchase of MRI equipment by a hospital, for example, it is virtually impossible to get a doctor, a nurse and a purchase manager in the same room to assess their joint preference. Similarly in a Business-to-Consumer context, joint choice data from a parent and a teen for the purchase of a shared durable good is quite difficult and expensive to obtain. Accurate assessment of joint preference is important because individual preference is unlikely to predict market shares with great fidelity. This is particularly true when individuals in the group have high influence on different attributes and there is no clear-cut primary decision maker or user. The practical challenges in estimating joint preference, therefore, raise an important research question: Is it possible to estimate joint preference without requiring individuals to convene as a group to provide joint choice data? Our objective in this research is to propose a novel methodology to estimate joint preference without the need to collect joint data from the group members. The methodology merges experimental design, statistical modeling, and utility aggregation theories to capture the psychological processes of preference revision and concession that lead to the joint preference. In contrast to Aribarg, Arora and Bodur (2002) which mandates choice data collection at the dyadic level, our goal in this paper is to predict joint choice using data collected only from the individuals. By removing the big hurdle of joint choice data collection, the methodology makes accurate assessment of joint preference a lot more feasible. Several aspects of our proposed methodology are noteworthy. First, we estimate individual sensitivity to the other member’s preference—or preference revision—using an experimental approach. This is accomplished by careful manipulation of the other member’s
4
preference. Because member preferences within a group may or may not be congruent, we formally recognize and model the systematic effect of preference congruence on joint preference. Second, common approaches to measure individual preference are either stated or inferred (e.g., based on choice data and models). We merge both approaches to assess revised preference by exposing each member to the designed stated preference of the other member, and estimating the extent of his/her preference revision using choice data. Third, the give and take that is natural in a joint choice context—or preference concession—is captured by investigating a variety of theory-based utility aggregation models (e.g. Harsanyi 1955). Finally, joint choices for each group are determined by using a hierarchical Bayes choice model coupled with an appropriate utility aggregation model. While our proposed ideas in this paper are likely to work effectively in both Business-toBusiness and Business-to-Consumer contexts, we chose the latter to conduct our empirical testing. This was guided primarily by our intention to compare the predictive performance of our approach to conventional approaches, which involve the estimation of joint preference using joint choice data (Arora and Allenby 1999). We are able to obtain such joint choice data much more easily in a Business-to-Consumer context. The Business-to-Consumer context we selected involves choice of cell phones for a teen. Pretests revealed that parents played a significant role in this dyadic choice decision. A study with 214 parent-teen dyads was therefore used to test the proposed model. Our results show the viability of our proposed method in obtaining revised preference from each dyad member. We also find that the most effective way to aggregate group members’ utilities (which are based on their revised preferences) is to use a weighted Harsanyi aggregation model. Overall, our study demonstrates that it is certainly feasible to predict joint choices that reflect group preferences by using only individual data obtained separately from each group member. Empirical findings show that our method which accounts for both preference revision and concession leads to better predictive performance than using data from either parents or teens alone. For the reported study, empirical evidence suggests substantial preference incongruence between parent and teen preferences. While in general teens appear to demand higher functionality on cell phone attributes such as camera upgrade and loud speaker, attributes such as low price and GPS support service are more preferred by parents. By experimentally manipulating the other member’s preference, we uncover a revision pattern that sheds fresh
5
insight into how preferences shift. Both parents and teens appear to revise their preferences and the preference shifts vary significantly across cell phone attributes. We demonstrate significant gains in the ability to predict joint choice when preference revision is properly accounted. Preference concession also adds to our ability to predict joint choice. Our findings suggest that in the absence of any additional information, an equally-weighted Harsanyi model that aggregates members’ revised preference may be appropriate. The predictive results based on our proposed methodology clearly dominate an approach that relies on members’ initial preference and ignores the important phenomenon of preference revision inherent in any joint choice context. Our predictive tests also point to the significant disadvantage of the common practice of relying on the primary user’s preference as a surrogate for the group’s preference. Finally, while in our context we observe “matched” data from each member in the dyad we show that it is possible to extend our approach to the “unmatched” case where only one member from each dyad provides the data. The proposed methodology therefore offers significant promise in the Business-toBusiness context where collection of joint data is known be difficult. This paper is structured as follows. We begin with a section that presents our modeling framework and theoretical underpinnings of our overall approach. This is followed by the section that describes our experimental design and data collection procedure. Our model estimation results and predictive tests are included in the empirical section. We end with two possible extensions of our approach and a discussion section that highlights the value of the proposed approach, our limitations and opportunities for future research.
MODELING FRAMEWORK AND THEORY Following Aribarg, Arora and Bodur (2002), we construct our modeling framework1 to capture three key elements of a group’s preference: individual members’ initial preference, revision, and concession. We describe our framework (shown in Figure 1) for a situation in which two members (say member m and member m′ ) jointly make a decision to choose a product. 1
Our model should be viewed as a paramorphic representation of the preference revision and concession process. The basic model structure could be expanded to a multi-stage process where the number of stages is likely related to decision importance.
6
We assume that each member belongs to a class of individuals with distinct preferences that are identifiable a priori. Examples of such classes in Business-to-Business settings are doctors and nurses. In Business-to-Consumer settings, this could include husbands, wives and teens. At the beginning, each member is assumed to possess initial preferences for the attributes of a target product (initial preference stage). However, upon learning about the other member’s preferences for the attributes, member m and m ′ may revise their preferences for these attributes (preference revision stage). At the end, to make a joint choice, each member may also have to concede to each other if their revised preferences do not converge (preference concession stage). Next we describe how we model the three stages outlined above in detail.
Figure 1 Modeling Framework STAGE 1
STAGE 2
Member m′ ’s initial
Member m’s initial preference ( β )
preference ( β m′ )
I m
I
Member m′ ’s revised preference
Member m’s revised preference ( βm
R
| β mI , c m′ , γ m , φ m )
( β m' R
| β mI ′ , c m , γ m ' , φ m ' )
Group g’s utility
STAGE 3
( u g ( β m , β m′ ) ) R
R
Stage 1: Initial Preference Let subscript j, k, m, m′ , and g denote choice alternative j, attribute level k, member m, I member m′ , and group g. Let u mj = VmjI + ε mjI and u mI ' j = VmI ' j + ε mI ' j be the initial utilities of
member m and m′ , respectively, for alternative j. The deterministic parts of the utilities, VmjI and VmI′j can be written as: (1)
I VmjI = ∑ x jk β mk k
and
VmI′j = ∑ x jk β mI ′k , k
7
where x jk indicate the specification of attribute level k in choice alternative j that a member I evaluates. The elements β mk and β m′I k capture the initial preference of member m and m′ ,
respectively, for attribute level k. In a typical joint choice context individual choice is not observed and initial preferences are therefore not estimable. In our setup individual data are available thus permitting us to obtain member specific parameter estimates. Member specific errors are assumed to be independent and identically distributed type-1 extreme value with parameters (0,1). We capture heterogeneity in initial preferences across respondents by the random-effects specifications β mI ~ Normal( β m , Bm ) and β m'I ~ Normal( β m′ , Bm′ ). That is, preferences are expected to vary within the class to which a member belongs and also between classes. I The individual initial preferences ( β mk and β mI ′k ) above are model-based. Stated measures
of preference are also widely used in marketing (Srinivasan and Park 1997). A simple way to assess stated preference ( smk ) is by asking member m to classify each attribute level into the three categories of “must have,” “nice to have” and “don’t need” (Yee et al. 2006; Hauser, Tellis and Griffin 2006). These three levels of stated preference for attribute level k when viewed collectively for members m and m′ provide a measure of preference incongruence (Table 1). From the standpoint of member m, the preference incongruence ( cmk ) therefore has nine levels which break down into the three distinct categories of: preference congruence (along the diagonal), type-1 incongruence (below the diagonal) and type-2 incongruence (above the diagonal). Type-1 incongruence implies that member m′ wants the attribute level more than m and type-2 implies that member m wants it more than m′ . Table 1 Preference Incongruence
Must Have Member
m
Must Have Positive Congruence
Member m′ Nice to have
Don’t need Extreme Incongruence
Nice to have Don’t need
Extreme Incongruence
Negative Congruence
8
Stage 2: Preference Revision
As seen in Figure 1, upon learning the other member’s preferences each member (m and m′ ) R may revise his/her preference. Let u mj = VmjR + ε mjR and u mR' j = VmR' j + ε mR' j be the revised utilities of
member m and m′ , respectively, for alternative j. The deterministic parts of the utilities, VmjR and VmR′j are (2)
R VmjR = ∑ x jk β mk
and
k
VmR′j = ∑ x jk β mR′k , k
R and β m′R k are the revised preferences of member m and m′ , respectively, for attribute where β mk
level k. Once again, while in a typical joint choice context individual choices are not observable and revised preference estimates are therefore not estimable, in our setup individual data that help estimate member specific revised preference are available thus permitting us to obtain member specific parameter estimates. Member specific errors are assumed to be independent and identically distributed type-1 extreme value (0,1). Member specific preference shifts, by attribute, are modeled as follows. 9
(3)
R I β mk = β mk + φ m k ∑ γ m l c m′kl and l =1
9
β mR′k = β mI ′k + φ m ′k ∑ γ m 'l c mkl . l =1
Focusing on the first part of equation (3), revised preference of member m contains two parts: 9
his/her initial preference β and preference shift φ m k ∑ γ m l c m′kl . Next we explain individual I mk
l =1
components of the preference shift part of equation (3). Preference incongruence ( cm′kl ): For attribute level k, cm′k is a (9×1) vector (see table 1) 9
with elements 0 or 1 such that
∑c l =1
m′kl
= 1 , reflecting the congruence in stated preferences
between member m and his/her partner m ′ . Previous literature provides evidence that a member’s preference revision depends on his/her own initial preferences (Chandrashekaran et al. 1996; Myers and Lamm 1976; Rao and Steckel 1991) as well as preference of the other. Viewed via our framework this implies that a “must have/must have” preference for a given dyad is likely to impact a member’s preference revision differently than a “must have/nice to have” or a “must have/don’t need” preference. A particular challenge in this context is that while member m is likely to be well aware of own preferences ( smk ) s/he may have limited or no knowledge of
9
others’ preferences ( sm 'k ). Logistically, and from a cost standpoint, it may be infeasible to collect dyadic data to accurately assess preference revision likely to result because of incongruence. Our solution proposes experimental manipulation of the stated preference of member m′ ( sm′ ) to uncover systematic shifts in preferences of member m. To determine how a given member m responds to preference incongruence between members, we expose member m to a careful design of stated initial preference of member m ′ and vice versa. Details on the experimental design are provided in the empirical section. By experimentally manipulating the stated initial preference of member m′ our goal is to estimate the preference revision parameter ( γ m ) for member m. We also do the converse—manipulate the stated initial preference of member m to estimate the preference revision parameter ( γ m ' ) for member m ′ . Preference revision parameter ( γ m l ): The parameter γ m l in equation 3 captures member m’s preference revision because of preference incongruence. Equation (3) implicitly assumes that
preference revision of a given member is contingent on initial preference differences between members. It permits unequal γ m l for ∀l — the magnitude and direction of preference revision is expected to be different for each one of the nine cells in table 1. Analogously, parameter γ m 'l that appears in the second part of equation (3) captures the degree of preference revision of m ′ caused by preference incongruence. Because of context specific factors (e.g. who is the primary user, who is paying, relative knowledge, etc.) we expect γ m l to be different from γ m 'l . That is, we allow preference revision of members to be asymmetric. Further, because stated initial preference—and therefore attribute congruence—does not vary within an individual, preference revision parameters (γ) are homogeneous across respondents that belong to a given class. We use subscript m and m ′ to indicate that these revision parameters are estimated at the aggregate level across respondents. We do allow for the revision parameters to vary between classes. As stated earlier, from the standpoint of member m, preference incongruence ( cmk ) breaks down into the three distinct categories of: preference congruence (along the diagonal), type-1 incongruence (below the diagonal) and type-2 incongruence (above the diagonal). Type-1 incongruence implies that member m ′ wants the attribute more and type-2 implies that member m wants it more. The preference revision parameters ( γ ) corresponding to incongruence above the diagonal are expected to positive and those below the diagonal are expected to be negative.
10
These off-diagonal elements of γ are also expected to follow an ordinal structure. In table 1 consider the simple case when preference of member m ′ for an attribute is very high (i.e. “must have”). Contingent on the “must have” preference of m′ , we expect their counterpart member m to revise preference more when her stated initial preferences is “don’t need” (extreme incongruence), as compared to when her stated initial preferences is “nice to have” (mild incongruence). Analogously, if the preference of member m ′ for an attribute is very low (i.e. “don’t need”), we expect member m to revise her preference more when her stated initial preferences is “must have” (extreme incongruence), as compared to when his stated initial preferences is “nice to have” (mild incongruence). Elements along the diagonal in Table 1 suggest preference congruence. Although we expect no preference revision when dyadic stated preference is “nice to have-nice to have”, findings involving group polarization (Myers and Lamm 1976, Rao and Steckel 1991) suggest that preferences tend to become more extreme in the presence of congruence. We therefore expect a positive sign for the γ parameter when preferences are positively congruent (must havemust have) and a negative sign when they are negatively congruent (don’t need-don’t need). That is, attributes that are very desirable for both members become even more desirable and those that are very undesirable for both become even more undesirable. Preference shift varies by attribute( φ m ): In order to account for possible differences in
the degree of preference revision across attribute levels (Arora and Allenby 1999; Aribarg, Arora and Bodur 2002) we introduce attribute-level-specific multipliers φ m k for member m. The first element of this parameter vector ( φ m1 ) is set to be equal to 1 for the purpose of identification. Similarly parameter φ m′k captures attribute specific difference in preference revision for member m′ . Similar to preference revision parameters (γ), attribute-level-specific multipliers ( φ ) are homogeneous across respondents that belong to a given class. It is important to draw the distinction between the actual and manipulated stated preference in our framework. While the manipulated stated preference is controlled by the experimenter, actual stated preference is being measured. The purpose of injecting manipulated stated preference into our framework is to be able to assess the revision parameters ( γ m and γ m ' ). The measured or actual stated preference is also a critical piece because it allows us to determine the actual preference incongruence that exists within a dyad. Using equation (3), conditional on 11
revision parameters (γ) and actual preference incongruence that is being measured, it is straightforward to obtain the revised preference for each member in a group predictively. * and as the incongruence based on actual stated initial Formally, we denote cm* ′kl and cmkl
preferences associated with both members. The actual revised preference for a given member m and m′ can be obtained as follows. 9
(4)
R I β mk = β mk + φ m k ∑ γ m l c * m′kl
9
and
l =1
β mR′k = β mI ′k + φ m ′k ∑ γ m 'l c * mkl . l =1
A nice property of our modeling framework is thus while preference revision parameters ( γ m and γ m ' ) are homogeneous within a class, member specific preferences ( β mR and β mR' ) are heterogeneous. Two special cases of the proposed model structure in equation (3) are worth noting. First, 3
(5)
R I β mk = β mk + φ m k ∑ γ m l s m′kl
3
and
l =1
β mR′k = β mI ′k + φ m ′k ∑ γ m 'l s mkl . l =1
The difference between equations (5) and (3) is that the latter assumes that preference shift is caused by the other member’s stated preference whereas the former assumes that it is incongruence in stated preference that better captures preference revision. Equation (5) requires fewer (l = 3 versus 9) preference revision parameters than equation (3). Second, 9
(6)
R I β mk = β mk + ∑ γ m l c m′kl
9
and
l =1
β mR′k = β mI ′k + ∑ γ m 'l c mkl . l =1
The difference between equations (6) and (3) is that the latter assumes that preference revision is constant across attributes ( φ m k =1 for ∀k ). Equation (6) requires fewer model parameters than equation (3). We will test both the special cases empirically.
Stage 3: Concession and Utility Aggregation
Despite preference revision, it is likely that member preferences do not perfectly converge and, consequently, their utilities do not give rise to the same choice outcomes. Prior research in economics and decision theory (e.g., Arrow 1951; Harsanyi 1955; Keeney 1976; Keeney and Raiffa 1993) has extensively examined properties of different normative models to aggregate utilities of group members to derive their group choice in a cooperative setting. Social welfare problems in economics (e.g. Small and Rosen 1981) also fall under this broader class of
12
utility aggregation problems. The well-known Arrow’s Impossibility Theorem asserts that it is impossible for a group even with only two members to find a procedure to aggregate members’ ordinal utilities to obtain group ordinal utilities that satisfy a set of seemingly innocuous assumptions (Arrow 1951). Working with cardinal utilities (i.e., von Neumann-Morgenstern utilities) instead of ordinal utilities, Harsanyi (1955; 1978) presents a set of axioms under which a group utility can be derived as an equally weighted additive function of the utilities of individual members comprising the group. Keeney (1976) also shows that a group utility derived from an additive function of members’ cardinal utilities is in fact consistent with a set of assumptions analogous to those originally proposed by Arrow. Harsanyi Model (Additive Aggregation). The Harsanyi model (Diamond 1973; Harsanyi
1955 and 1975; Keeney and Raiffa 1993, page 295-297; Sen 1970), which takes an additive form, is derived based on the social welfare viewpoint and follows four axioms: 1) individual preferences satisfy the Marschak’s postulates of the von Neumann-Morgenstern utility theory2; 2) group preferences satisfy the Marschak’s postulates of the von Neumann-Morgenstern utility theory; 3) group utilities can be written as an increasing function of individual expected utilities; and 4) interpersonal comparability of individual utilities (i.e., utilities are interpersonally calibrated with respect both to unit/scale and to origin). The interpersonal comparability axiom has been a topic of discussion in later research although according to Harsanyi (1978), it is required only for the equal-weight result to hold. To achieve interpersonal comparability, previous research normalizes each group member’s utility before aggregating them to derive the group utility (Eliashberg et al 1986; Green and Krieger 1985; Keeney and Raiffa 1993). That is, for each member his/her highest and lowest utility is set to be equal to 1 and 0 respectively. Such normalization becomes necessary because utilities are commonly obtained using either gambling tasks or ranking/rating conjoint experiments. In contrast, we use a choice-based conjoint experiment and multinomial logit choice model in our study where the utilities are already normalized (see Train 2003, page 27-29 for a discussion). For both members m and m′ , we set the utility of an arbitrary product option to 2
Marschack’s postulates include: 1) The relation of preference establishes a complete and transitive ordering among all alternatives; 2) preference continuity (if alternative P is preferred to R, while Q takes position in between them, then there exists a mixture of P and R with appropriate probabilities such as to be exactly indifferent to Q); 3) sufficient number of non-indifferent alternatives; and 4) equivalence of mixture of equivalent alternatives (If alternative Q and R are indifferent, a given probability mixture of P and Q is indifferent to a similar mixture of P and R).
13
0. This is true for any discrete choice experiment where attributes are dummy coded. Also the utilities of all product options are scaled by the scale parameter (it equals 1, as indicated earlier) of the extreme value distribution so that the variance of the unobserved portion for both m and m′ is equal to π 2 / 6 . The utilities derived from choice models are therefore already normalized—
calibrated to have the same origin and scale—to be comparable across members. However, unlike the 0-1 normalization the lowest and highest utilities for each member based on the logit choice model are not constrained to be the same (i.e., set to be 0 and 1, respectively). Also an origin is fixed by setting the utility of an arbitrary product option to be zero. For ease of interpretation, it is not uncommon for that arbitrary product option to also be the least desirable (e.g. lowest functionality and highest price). A plausible argument against interpersonal comparability of members’ utilities is that normalized utilities, albeit comparable from the scaling perspective, may not be comparable from the psychological perspective (Brock 1980; Harsanyi 1955). Specifically, the normalization procedure assumes that members in a group have—or at least compare their preferences with each other as if they have—the same utility of zero for the baseline alternative, which may not necessarily be warranted. However, there is evidence that the Harsanyi model using normalized utilities works well as long as there is some degree of agreement between group members or, in other words, preferences of group members are positively correlated (Dawes and Corrigan 1974). Viewed in light of our context, given that preference revision is expected to facilitate the convergence of group members’ preferences, we expect the Harsanyi model to provide better prediction of joint choice outcomes when revised, instead of initial, preferences are used as the basis for aggregation. Weights can also be incorporated into the Harsanyi model. In fact, some previous research in marketing has proposed different ways to estimate these weights as a result of aggregating members’ initial preferences (Arora and Allenby 1999; Krisnamurthi 1988) or revised preferences (Aribarg, Arora, and Bodur 2002). As a result, we specify the utility associated with group g alternative j derived from the weighted Harsanyi model as follows. The chosen alternative is expected to maximize the following utility function: (7)
R u gj (u mR , u mR′ ) = wm u mj + wm′ u mR′j ,
14
where the terms wm and wm′ capture the decision weights associated with member m and m′ ;
wm + wm′ = 1 . The weights wm and wm′ reflect relative degree of concession between member m and m′ ; wm > wm′ suggests relatively lower concession by member m. An emerging stream of literature proposes that individuals may not make a choice decision that maximizes their utility, but one that minimizes their anticipated regret (Chorus, Arentze, and Timmermans 2008; Inman, Dyer, and Jia 1997; Simonson 1992). A choice that maximizes compensatory utility may lead to post-purchase regret if one has to accept an inferior level of an attribute for a superior level of another attribute. It is plausible that the chooser later wishes that s/he was not stuck with the inferior attribute level. Translating such a notion into a group setup, members of a group may avoid choosing an alternative that leads to maximum regret for a particular member. Motivated by the notion of anticipated regret, we also test such an aggregation model which takes into account an analogous notion of regret among group members.
Rawls Model (Maximin Aggregation). The Rawls model (Rawls 1971; 1974) evaluates each group outcome based on its utility to the group member who likes it the least. Motivated by the theory of justice, the Rawls model is the most egalitarian form of utility aggregation because it attempts to maximize the utility of the most disadvantaged member—the one who has to give up his/her utility the most for the group to reach the group choice outcome. The benefit of making such a decision is that the group can make sure that none of the group members has to suffer too much pain in making a joint choice, and as a result the group is likely to maintain strong relationships among group members. Similar to the Harsanyi model, the Rawls model also requires interpersonally comparable utilities. Previous research has shown that 0-1 normalized utilities work well with the Harsanyi, but not with the Rawls model (Gupta and Kohli 1990). In this research, we empirically examine whether the use of normalized utilities derived from a logit choice model can improve predictive performance of the Rawls model. Formally, we specify the utility associated with group g alternative j derived from the Rawls model as: (8)
R u gj (u mR , u mR′ ) = min(u mj , u mR′j )
Given the specification of the aggregate (joint) utility from (7) and (8), the group choice is predicted to be the one that maximizes the joint utility of the group members. In our Bayesian
15
framework, we account for uncertainty in parameter estimates by using the entire posterior distributions of parameter estimates in conducting the predictive performance comparison of the two utility aggregation models. Previous research in marketing has also tested different aggregation models (Curry, Menasco and Van Ark 1991; Eliashberg et al. 1986; Gupta and Kohli 1990; Neslin and Greenhalgh 1983 and 1986). Our paper differs from previous research on several dimensions. First, we test utility aggregation models in the context of joint decisions for family purchases, not buyer-seller negotiations. Second, we test aggregation models based on utilities that are based on revised, and not initial, preferences. This helps develop a better process level understanding of joint choice phenomena and likely improves prediction quality. Third, we measure preferences based on individual and group conjoint choice tasks, instead of gambling (Eliashberg et al. 1986) or conjoint ranking tasks (Neslin and Greenhalgh 1983 and 1986).
EXPERIMENTAL DESIGN AND DATA COLLECTION Table 2 Summary of Study Design Task Phase 1
2
Parent Stated preference task to classify each attribute into "Must have," "Nice to Have," and "Don't need."
Teen Stated preference task to classify each attribute into "Must have," "Nice to Have," and "Don't need."
A choice based conjoint task given to parent.
A choice based conjoint task given to teen.
Manipulation: Stated teen’s preference shown to parent.
Manipulation: Stated parent’s preference shown to teen.
A choice based conjoint task given to parent.
A choice based conjoint task given to teen.
A choice based conjoint task and predictive holdouts to be filled out by parent and teen together.
Objective To obtain the actual stated initial preferences, and estimate the actual inferred initial preferences for cell phone attributes for each member.
To manipulate preference congruence/incongruence for each attribute at the dyadic level, and then estimate preference revision parameters (γ) for each member. To obtain group preferences for cell phone attributes. The holdouts were used to conduct predictive tests. Data in this phase were obtained for the sole purpose of model validation.
16
Experimental Design
To test the proposed methodology, we designed and implemented a study involving cell-phone purchase for a teenager. We chose this context because existing research (Geser 2006) suggested that this is a joint choice context with significant parental involvement. Included in our study are seven cell-phone attributes: MP3 player, video recorder/player, web-enabled functionality, GPS support service, loud speaker, camera upgrade (4× digital zoom and flash), and price. We chose these attributes based on multiple consumer reviews on cell phones such as Cell Phones Buying Guide by CNET (http://reviews.cnet.com/cell-phone-buying-guide/) and Important Features of Cell Phones by Consumer Reports (http://www.consumerreports.org/; January 2006 report). Each non-price attribute takes 2 levels of “yes” and “no”, where “no” is set to be the baseline level. There are two levels for price, $79 and $139, where the higher price of $139 is set to be the baseline. The study had two phases involving individual and joint tasks, and respondents completed both phases online (the study design is summarized in Table 2). Phase 1 involves individual tasks. Our goal in this phase was to obtain each member’s initial and then revised preferences for the seven attributes. Two separate measures for initial preference were obtained: stated and inferred (i.e., model-based). The former was obtained by asking respondents to classify each attribute into one of three categories of “must have”, “nice to have” and “don’t need” as shown in Figure 2. Figure 2 Measuring Stated Initial Preference
17
Then, we asked each individual to complete thirteen choice tasks, each involving a triple, which were used to estimate his/her inferred initial preference. The use of triples is motivated by i) prior research (Robert and Lattin 1997) which suggests that consumers tend not to engage in a compensatory decision process, an assumption implicit in our logit specification, when faced with a larger number of options and ii) significant gain in design efficiency (Huber and Zwerina 1996) as the number of alternatives increased from 2 to 3. Design efficiency gain was much smaller when the number of alternatives increased from 3 to 4. A blocked design involving four sets of such thirteen triples were created using SAS OPTEX. Respondents were randomly allocated to one of the four sets. When performing these choice tasks, members were instructed to make choice decisions based strictly on their own preferences. For example, the teens were instructed: When answering the questions, please consider your own opinion only. Please do not
take into account anyone else’s (like your parents’) likes and dislikes. Next we were interested in capturing preference revision as a result of incongruence in initial preferences between members and, subsequently, estimating members’ revised preferences. In order to accomplish this goal, we presented to each respondent the hypothetical (i.e., manipulated) stated initial preference of his/her counterpart. An example for a given teen is shown in Figure 3. To ensure adequate variation in the manipulated stated preference across respondents, the following design strategy was used. Stated preference for each one of the seven attributes could take three different values of “must have”, “nice to have” and “don’t need”. For the 2,187 (= 37 ) possible cases, we randomly generated a design with two restrictions: (i) the manipulated preference presented to each respondent contains at least one attribute that falls under each one of the three possible categories of “must have,” “nice to have,” and “don’t need” and (ii) to maximize design efficiency there are no repetitive cases across respondents.
18
Figure 3 Manipulation of Stated Initial Preference
We also embedded a mechanism in the study to ensure that each respondent indeed paid attention to and understood the manipulated preference of his/her counterpart. Specifically, he/she was asked to drag each one of the seven attributes into the three possible bins of “must have”, “nice to have” and “don’t need” as a manipulation check. If the respondent failed to correctly classify the seven attributes, he/she was shown the above screen (Figure 3) again. The manipulation was followed by conjoint choice tasks involving a new set of thirteen triples. We used these data to assess how and to what extent the respondent revised his/her preference given his/her counterpart’s stated preference. While considering each choice set, the respondent was shown the manipulated preference of the other member as a reminder. When performing the choice tasks, respondents were also instructed to consider their family member’s opinions as well as their own. For example, the teens were asked: Please consider your parents’ likes and
dislikes, based on the information we showed you on the previous screen and above, along with your own. A typical choice task is shown in Figure 4.
19
Figure 4 Conjoint Choice Task Used to Obtain Revised Preference
In Phase 2 involving joint tasks (see Table 2), our primary goal was to obtain joint preference. We included this phase strictly to validate our proposed model. Before performing choice tasks in this phase, members in each dyad were first asked to discuss their likes and dislikes with regard to cell phone features included in the study. This was done to facilitate an exchange of true preference and the resulting preference revision is therefore based on the true member preferences. In contrast to phase 1 where member preferences were manipulated to estimate preference revision patterns, in phase 2 members are expected to truly revise their preferences. In effect our experimental approach and the model in using phase 1 data attempts to mimic true preference revision that occurs in phase 2. Members were then instructed to jointly select an alternative from each of the fifteen conjoint choice sets, each of which consists of three alternatives. Specifically they were asked: Which one of these cell phones do both of you like the
best? That is, which one are both of you most likely to choose as [teen’s name]’s next cell phone? We used choice data from the ten choice tasks to directly estimate joint preference parameters ( β g ; See Arora and Allenby 1999). We used these parameter estimates as a benchmark against which we compared the predictive performance of our proposed method. The remaining five holdout joint choices were used for out-of-sample predictive performance tests.
20
Finally, we also obtained information on a variety of measures pertaining to cell phone usage, knowledge, and experience during the two phases of the study. Respondents also indicated the importance of each attribute on a 1-5 scale and how much relative influence they would have in a making purchase decision of a cell phone for the teen. Demographic information, such as respondent age, gender, ethnicity, were also collected at the end.
Data Collection
Data were collected with the help of C&R Research by using their TeensEyes nationwide panel for teenagers between the age of 14 and 18 years. Teenagers who own or plan to get a cell phone were recruited for the study. The study began with Phase 1 (Table 2) for the teens. At the end of this phase, the teens were asked to provide their parents’ email address if they may be interested in participating in the study. The parents were then contacted to provide Phase 1 data. Upon completion of Phase 1, the parents were asked to provide data for Phase 2 by providing joint data with their teens. A quota sample ensured an equal number of teen males and females. In addition, we also established a minimum of 10% of the total sample for the five age groups of 14, 15, 16, 17 and 18 years old. The questionnaire was pre-tested on 57 parent-teen dyads. On the basis of the pretest, several questions and instructions in the survey were simplified and rewritten. Our sample goal was 200 dyads. Given our plan to collect joint data in Phase 2 for the purpose of model validation, we over-sampled 354 teens to get data for Phase 1. Parents of 225 of these teens agreed to participate in the study. Data from 11 dyads were not usable resulting in sample size of 214 dyads. Participating teens received TeensEyes points as an incentive and parents were entered into a sweepstakes where they could win one of five $25 Amazon.com gift certificates.
EMPIRICAL ANALYSIS
Sample Profile
We begin with summary statistics for the sample. The average age of the teens was 15.8 years old and 52.8% of teens were female. The modal income of the families participating in the study was $50,000-75,000. About 90% of the teens currently own a cell phone. Teens participating in the study perceived themselves as more knowledgeable about cell phone features
21
(means for parents=2.44 and teens=3.15 using 1-5 scale, p.95) is lower than the preference revision for price. Teens, on the other hand, exhibit higher preference revision for the MP3 player attribute than price (prob( φ > 1) >.95) and lower preference revision for the Video recorder/player attribute (prob( φ < 1) >.95). Next we report estimates for the preference revision parameters.
25
Table 6 Parameter Estimates for Initial Preference and Revision Multiplier Attributes
Price (A low price $79 vs. $139) MP3 player Video recorder/player Web enabled functionality GPS support service Loud speaker Camera upgrade
Initial Preference
Heterogeneity
(β )
( B kk )
Teens 1.194 (0.078) 1.594 (0.099) 0.864 (0.069) 0.763 (0.078) 0.706 (0.075) 0.526 (0.064) 1.171 (0.085)
Parents 1.885 (0.146) 1.569 (0.133) 0.875 (0.086) 0.620 (0.111) 1.186 (0.121) 0.321 (0.068) 1.075 (0.118)
Teens 1.107 (0.062) 1.320 (0.078) 0.796 (0.053) 0.966 (0.065) 0.816 (0.054) 0.631 (0.053) 1.065 (0.060)
Parents 1.744 (0.118) 1.563 (0.115) 0.844 (0.075) 1.095 (0.089) 1.479 (0.105) 0.684 (0.061) 1.244 (0.104)
Revision Multiplier
(φ )
Teens 1.000 n/a 1.418 (0.253) 0.694 (0.143) 0.927 (0.203) 0.941 (0.154) 0.844 (0.174) 0.932 (0.167)
Parents 1.000 n/a 1.191 (0.267) 0.868 (0.215) 0.765 (0.200) 0.835 (0.182) 0.505 (0.166) 1.240 (0.199)
As noted in equation 4, there are nine (=3×3) elements of the preference revision parameter (γ). Estimates for teens with respect to price attribute are reported in Table 7a. The row corresponding to teen “must have” in Table 7a should be interpreted as follows. For the price attribute, if a given teen indicates that low price is a “must have” feature, then there are three possible hypothetical scenarios with regard to how this stated preference matches up with his/her parent’s stated preference. If the parent also views low price as a “must have” then the revision (γ) estimate suggests an upward shift of 0.374 in the teen’s preference. On the other hand, if the parent views low price as a “nice to have” feature, then the revision estimate suggests a downward shift of -0.272 in the teen’s preference. A “don’t need” stated preference for the parent also translates into a downward shift of -0.525. We find it useful to report the estimates in Table 7a in the three groups of: along, above and below the diagonal. Elements along the diagonal suggest that teens revise their preferences even when the stated preferences are congruent. This is consistent with the group polarization phenomenon. We also observe downward preference revision in case of “nice to have-nice to have”. This may suggest that participants associate the “nice to have” category of stated
26
preference as somewhat negative rather than neutral. All elements above the diagonal are negative indicating that teens shift their preferences for low price downwards (i.e. want it less) when they perceive that their parents like the low price attribute less than they do. With one exception, elements below the diagonal are positive indicating that teens shift their preferences for low price upward (i.e. want it more) when they perceive that their parents like the low price attribute more than they do. The one exception to this pattern is the case of “don’t need” for teens and “nice to have” feature for parents. The negative sign is not surprising if “nice to have” is perceived as a somewhat negative evaluation, as noted earlier. Despite our focus on the price attribute in Table 7a, the revision estimates (γ) do vary by attribute and this variation is captured by estimates of the φ parameters reported in Table 6. The general patterns of preference revision reported in Table 7a also hold for parents (see Table 7b). Two out of the nine estimates in Table 7b are not significantly different from zero. Table 7a Teen Preference Revision for Price Parent Must Have Teen
Must Have 0.374 (0.105)
Nice to have -0.272 (0.068)
Don’t need -0.525 (0.081)
Nice to have
0.445 (0.103)
-0.267 (0.063)
-0.626 (0.092)
Don’t need
0.600 (0.180)
-0.249 (0.104)
-0.545 (0.137)
Table 7b Parent Preference Revision for Price Teen Must Have Parent
Must Have 0.438 (0.134)
Nice to have -0.232* (0.118)
Don’t need -0.510 (0.134)
Nice to have
1.027 (0.158)
-0.236 (0.097)
-0.544 (0.110)
Don’t need
1.011 (0.191)
-0.157* (0.120)
-0.476 (0.137)
*insignificant at the 95% significance level
27
Predictive Performance Tests
To validate the proposed methodology, we obtained joint choice data from each parent-teen dyad (Table 2). We asked respondents to provide joint choices for fifteen choice sets, each involving three alternatives. Ten joint choices were used to estimate joint preferences ( β g ) of each dyad. The remaining five choice sets were holdouts that were reserved to conduct predictive tests. The predictive performance of preference estimates based on the joint choice data provided the benchmark against which we compare our proposed method. To demonstrate out-of-sample predictive performance, we computed hit rate and mean absolute deviation (MAD) associated with predicting the five holdout choices. Hit rate was calculated based on the "maximum utility" rule that uses the deterministic component of utilities (Green and Krieger 1985; Neslin and Greenhalgh 1983 and 1986). This is reasonable because for an extreme value distribution although E (ε ) ≠ 0 , all alternatives are constrained to have the same iid error. When an extreme value error is added to conduct these predictive tests then, as expected, across all tests, predictive fit declines a little but the pattern of results and resulting conclusions remain unchanged from what is reported. For a given choice set, an alternative that provided the highest utility was assumed to be selected. In addition to hit rate, we also computed mean absolute deviation (MAD) by averaging the difference between the utility of the chosen option and that of the option predicted by each model across the five holdouts. To ensure comparability of the MAD measure across different models, utility differences associated with each model were computed based on parameter estimates from the benchmark model. Both hit rate and MAD were calculated at each iteration of the stationary posterior distribution and then averaged across those iterations. Next we report a series of predictive performance tests (Table 8) to demonstrate how well our proposed approach works.
28
Table 8 Predictive Performance Results Model description Model
1
Teen’s initial preference
2
Parent’s initial preference
N
N
N
0.537
0.978
3
Teen’s revised preference
Y
N
N
0.519
1.075
4
Parent’s revised preference
N
Y
N
0.568
0.884
5
Weighted additive utility (Harsanyi) Equal weights Rawls model
Y
Y
Y
0.587
0.843
Y
Y
Y
0.541
0.984
Best weighted additive utility (Harsanyi) Teen’s weight=0.4 Joint preference (benchmark)
Y
Y
Y
0.587
0.837
Y
Y
Y
0.586
0.765
7 8
b
Predictive fit statistics (Mean) a MADb Hit rate
Teen revision N
6
a
Predictor of Joint Choice
Hit rate M i = MAD M i =
1 G ×T
1 G ×T
G
G
T
∑∑ g =1 t =1 T
∑∑ V g =1 t =1
Parent revision N
Concession N
0.469
1.275
[I gt = 1 when the chosen alternative also has the highest utility for model M i ;0 otherwise]
M8 gt
(chosen) − VgtM8 (Predicted to be chosen by model M i )
g=group 1,…G; t=choice task 1,…5, k=alternative 1,2,3; M i =Model i where i=8 is the benchmark model.
VgtM i (k ) : group g’s deterministic utility for task t, alternative k and model i
29
Predictive gains as a result of accounting for preference revision. The spirit behind our study design and predictive testing is that joint choice data are rarely collected in practice because of practical difficulties. The predictive results based on the joint choice data and subsequent joint preference estimates are therefore the upper limit or benchmark against which our methodology can be compared3. As shown in model 8 (bottom of Table 8), based on joint preference estimates the average hit rate and MAD for the five holdout choice sets are 0.586 and 0.765, respectively. In comparison, when the teen’s initial preference is used to predict the five holdouts, the fit is poorer (hit rate=0.469; MAD=1.275; model 1) or when the parent’s initial preference (hit rate=0.537; MAD=0.978; model 2) is used (probabilities >.95). There is significant improvement in the fit if teen’s revised preference (hit rate=0.519; MAD=1.075; model 3) is used instead of teen’s initial preference (probabilities>.95). Similar improvement as a result of using revised preference (hit rate=.568; MAD=0.884; model 4) instead of initial preference is also observed for parents (probabilities >.95). These results suggest that our proposed methodology of using a combination of stated and inferred preferences to estimate revised preferences does a nice job of predicting joint choice. Our findings demonstrate significant gains in the ability to predict joint choice when preference revision is properly accounted. Further, because neither the teen’s nor the parent’s revised preference estimates perform as well as our benchmark, the joint preference estimates, next we examine how much fit improvement we can gain by aggregating teen’s and parent’s revised preferences using the utility aggregation models we discussed. Such evidence of fit improvement would demonstrate the value of accounting for both preference revision and concession in predicting joint choice. Predictive gains as a result of accounting for both preference revision and concession. In Table 8, models 5 and 6 correspond to the utility aggregation models outlined earlier. We find that the Harsanyi utility aggregation model with equal weights leads to a better (probability >0.94) predictive performance (hit rate=0.587; MAD=0.843) than “revision only” models. Rawls model (hit rate=0.541; MAD=0.984; model 6)) does not perform as well. These results are consistent with those reported in Gupta and Kohli (1990).
3
We recognize that our benchmark is conditional on the assumption of a logit model—there may be other models of joint choice that perform better than the logit model.
30
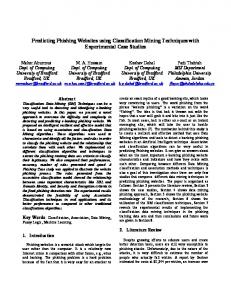
Figure 5 Utility Aggregation Models: Grid Search
We also use a grid search to find optimal weights for the weighted Harsanyi model that result in best predictive fits. Figure 5 demonstrates that our search for optimal weights does not have a corner solution. It is noteworthy that the best fitting Harsanyi model (model 7) with teen’s influence of .4 (hit rate=0.587; MAD=0.837) performs as well as model 8—our benchmark model of joint preference estimates. Although optimal weights may not always be known, our findings suggest that in the absence of any additional information, equal weights may be more reasonable to use than extreme weights (0 or 1) that rely on the preference of only one member.
31
These findings therefore point to the significant disadvantage of using only one member’s preference as a surrogate for the group’s preference. For sake of completeness we also include grid search results based on initial preference instead of revised preference in Figure 5. The predictive results based on our proposed methodology that formally models preference revision clearly dominate an approach that relies on members’ initial preference and ignores the important phenomenon of preference revision inherent in any joint choice context. These results are also consistent with prior research that the Harsanyi model using normalized utilities works better when preferences of group members are more positively correlated (Dawes and Corrigan 1974). In addition to predictive tests reported in table 8, from a managerial standpoint another measure of model performance is the difference between actual market share and model based predicted market share. Similar in spirit to hit rate, mean absolute error (MAE) is one such commonly used (Huber et al. 1993) measure: 1 T K ∑∑ Actual market share tk −Model based predicted market share tk | T × K t =1 k =1 where t represents number of joint choice sets, k number of options in a given choice set and G is MAE =
the total number of dyads ( Actual market share tk =
1 G jo int ∑ y gtk ). Consistent with our earlier G g =1
predictive results, we find that incorporating preference revision and concession results in market share forecasts that are more accurate. As compared to the MAE of 0.038 based on joint preference (model 8 in table 8), MAE based on teen and parent initial preferences are 0.086 and 0.060, respectively. This indicates that using initial prefrences to predict joint choice can lead to market share forecasts that are significantly worse (probabilities > .95). Consistent with previous results, using teen (MAE=0.051) and parent (MAE=0.043) revised preferences leads to much more accurate (probabilities > .90) predictive performance. The MAE associated with the best Harsanyi model results in marginal additional improvement (0.042) in accuracy. Predictive performance when dyadic data are not matched. In our study, we collected data from each member within a dyad. Such matched data may not always be easy to collect in all joint choice contexts. For example, it may be infeasible to collect member specific data from a physician and an anesthesiologist with regard to features of specialized hospital equipment. Next we ask ourselves the following question: If we had obtained data from an unmatched
32
sample of teens and parents, how well would our proposed approach work? To answer this question we need to first assume that for a given family, data from only the teen or the parent (not both) are available. Equations 1-3 in our model do not require matched data. However, equation 4 that allows us to estimate member specific revised preference conditional on dyad specific incongruence and equations 7-8 involving utility aggregation do. In order to obtain revised preference for a given teen m in the case of unmatched data we need to re-specify equation 4 as follows. 9
R I βˆ mk = β mk + ∫ φ m k ∑ γ m l c ' n 'kl dc '
(9a)
l =1
That is, we obtain revised preference for each teen by using actual stated preferences of all other parents in the sample except his/her own parent ( m′ ). Specifically, for a given teen m, we derive preference shift by averaging across preference incongruence ( cn′′kl ) between teen m and other n′ parents ( n′ ≠ m′) , instead of preference incongruence between teen m and their own parent m′ ( cm* ′kl in equation 4; Gilula, McCulloch and Rossi 2006). Analogously, revised preference for a given parent m′ can be derived as follows. 9
βˆ mR′k = β mI ′k + ∫ φ m ′k ∑ γ m 'l c ' nkl dc '
(9b)
l =1
Finally, deriving joint choice predictions in the case of unmatched dyadic data is a bit more complicated than in the case of matched data. Unlike the matched data case where we have a single joint choice prediction associated with each dyad, we have separate joint choice predictions for teens and for parents in the unmatched data case. Specifically, from teen m’s perspective, the joint choice prediction δ mn′ is derived based on: 1) his/her revised preferences R βˆ mk from equation 7 and 2) revised preferences of all unmatched parents βˆ n′Rk that exist in the
sample. Prediction that alternative j is the joint choice from teen m’s perspective is given by
(10a)
{δ
mn′
(choice = j ) : ∫ u gj ( βˆ mR , βˆ nR′ )dβˆ nR′ > ∫ u gk ( βˆ mR , βˆ nR′ )dβˆ nR′ for ∀k
}
Analogously, from the parent m′ ’s perspective, the joint choice prediction δ m'n is given by: (10b)
{δ
m′n
(choice = j ) : ∫ u gj ( βˆ mR′ , βˆ nR )dβˆ nR > ∫ u gk ( βˆ mR′ , βˆ nR )dβˆ nR for ∀k
}
33
Similar to the derivation of revised preference in equations 9a and 9b, we rely on draws of other parents’ revised preferences ( βˆnR′ ; n′ ≠ m′) to obtain joint choices from teen m’s perspective, and draws of other teens’ revised preferences ( βˆnR ; n ≠ m) to obtain joint choices from parent m′ ’s perspective. This raises the natural question whether one should rely on δ mn′ or δ m′n to predict the dyad’s joint choice. To formally examine this issue, we first specify a 0-1 loss function to capture the deviation of δ mn′ and δ m′n from true δ mm′ , which is the actual joint choice derived from matched dyad members. That is, L(δ mn′ , δ mm′ ) and L(δ m′n , δ mm′ ) are equal to 1 when
δ mn′ ≠ δ mm′ and δ m′n ≠ δ mm′ , respectively, and 0 otherwise. With this specification, we can define Bayes posterior expected loss associated with L(δ mn′ , δ mm′ ) and L(δ m′n , δ mm′ ) as: (11)
E (L(δ mn′ , δ mm′ ) ) = ∫ ∫ L(δ mn′ , δ mm′ ) p(u gj ( βˆ mR , βˆ nR′ ) | c n′ ′ , β nI′ ) p(c n′ ′ ) p( β nI′ | data )dc n′ ′ dβ nI′ E (L(δ m′n , δ mm′ ) ) = ∫ ∫ L(δ m′n , δ mm′ ) p(u gj ( βˆ mR′ , βˆ nR ) | c ′n , β nI ) p (c ′n ) p( β nI | data )dc ′n dβ nI From the decision theoretic perspective, a better decision is the one that is associated with
a lower integrated risk. In the Bayesian framework, evaluating the posterior expected loss associated with each teen m (parent m ′ ) in our case is equivalent to evaluating the integrated risk associated with all teens (parents) in the sample (Robert 2001, page 63). Recall that to derive joint choice from unmatched data from the perspective of member m ( m ′ ), we first have to integrate over the preference congruence data of the other member from unmatched data c n′ ′ and c n′ in equations 9a and 9b, and then also integrate over βˆ n′R and βˆ nR , which are functions of
β n′I and β nI , as shown in equations 10a and 10b. As a result, we should expect the posterior expected loss associated with member m ( m ′ ) to be larger when we have to integrate over more disperse distributions of both preference congruence c n′ ′ ( c ′n ) and initial preferences β n′I ( β nI ) of other unmatched members n ′ (n). Given that preference congruence is induced by stated initial preferences and stated initial preferences and inferred initial preferences ( β n′I and β nI ) are expected to correlated, we can focus only on the distributions of initial preferences. According to Table 6, parents initial preferences are shown to be more heterogeneous (i.e., dispersed), as a result, we expect joint decisions from parent’s perspective to have better predictive performance.
34
Next we conducted predictive tests to investigate how well our proposed methodology works in contexts where matched dyadic data may be unavailable. Using revised preferences obtained from equations 9a and 9b we computed hit rate and MAD for the five holdout joint choices as before. Again, all fit calculations were conducted using posterior distributions of the parameter estimates. Predictions based on the teens’ unmatched revised preference (hit rate=0.488; MAD=1.170) outperform those based on their initial preference (model 1, Table 8; hit rate=0.469; MAD=1.275). Similarly predictions based on the parents’ unmatched revised preference (hit rate=0.568; MAD=0.882) also outperform those based on their initial preference (model 2, table 8; hit rate=0.537; MAD=0.978). While the predictions based on unmatched revised preference for teens (hit rate=0.488; MAD=1.170) are not as good as those based on the matched case (model 3 in Table 8; hit rate=0.519; MAD=1.075), both unmatched (hit rate=0.568; MAD=0.882) and matched (model 4 in table 9, hit rate=0.568; MAD=0.884) predictions based on the parent’s revised preferences work equally well. Finally, we also computed hit rate and MAD when concession is also taken into account by using the Harsanyi’s model with equal weights. With the parent as the focal member, predictions based on a utility aggregation model (hit rate=0.576, MAD=0.861) were not found to be significantly better than predictions using parents’ revised preference for the unmatched case (hit rate=0.568; MAD=0.882). Overall, predictions based on revised preferences of unmatched members are surprisingly good. Our proposed methodology therefore does not mandate that matched data be available for all dyads. In the extreme case when the data are completely unmatched, predictions based on revised preference are found to be quite good. In summary, our empirical results convincingly demonstrate that initial preference of a member, even when that member is the primary user e.g. teen in our context, can be a poor predictor of joint choice. Revised teen preference, based on our proposed methodology, does significantly better. A similar pattern of results holds for parents—although parent’s initial and revised preference does better than the teen’s initial and revised preference, respectively. Preference concession or the use of utility aggregation also improves a researcher’s ability to predict joint choice. Empirical evidence in our study suggests that revised preference of both teens and parents, when combined with concession through the use of Harsanyi’s utility aggregation model, leads to best predictive performance. The results also suggest that our proposed methodology applies to contexts in which dyadic data are matched or unmatched.
35
Despite the value of our approach in providing firms with more accurate joint choice prediction, one needs to weigh the potential costs and benefits of implementing our approach. An obvious additional cost incurred from our approach is that firms need to collect data from more than one class of customers (e.g., both teens and parents). However, by using our approach managers no longer have to be constrained by the need to get customer dyads to make joint decisions, or even to get matched dyads of customers from different classes.
Model Extensions
We propose two extensions of the proposed model. Each requires new data and experimental design. The first could be viewed as a relatively straightforward whereas the data collection demands in the second extension are significant. Nash Model (Multiplicative Aggregation). A well-known utility aggregation model is Nash (1950; 1953) and is shown to predict cooperative negotiation, or a non-zero sum game outcomes, quite well (Curry, Menasco, and Van Ark 1991; Eliashberg et al 1986; Neslin and Greenhalgh 1983). The original Nash model, which arises from the “Nash solution” for cooperative games, aggregates utilities simply by multiplying utilities of members in a group (Davis 1970; Luce and Raiffa 1957; Nash 1950 and 1953; Owen 1969). Roth (1979) extends the original Nash model to allow asymmetric influences across different members by incorporating different decision weights for different members (Peters and Van Damme 1991). The utility associated with group g alternative j derived from the weighted Nash model can be written as (12)
R R wm u gi (u mR , u mR′ ) = (u mj − u mo ) (u mR′j − u mR′o ) wm′ ,
R and umR′j are revised utilities associated with member m and m′ , respectively, and where umj R umo and umR′o are utilities corresponding to the “no-settlement” situation for each member. The
weights wm and wm′ reflect relative degree of concession between member m and m′ ; wm > wm′ suggests relatively lower concession by member m. The key difference between Nash and Harsanyi models, from the standpoint of our paper, is that the Nash model requires the specification of status quo or non-settlement utility. Translated into out context, this implies that an alternative has to exceed each member’s baseline or status quo utility ( umR0 and umR′0 ) for it to be considered. In the event that all alternatives have utility below either member’s status quo utility implies that the group chooses none of the 36
available alternatives. The Nash aggregation model is thus not appropriate for the conditional on choice model used in our research. In order to assess the status quo or “no-settlement” utility central to the Nash model we will need (i) observations that allow respondents not to select any of the alternatives if they so choose and (ii) an unconditional on choice model that formally R captures the utility of the no choice option ( umo and umR′o ). The former requires data where
respondents are given the “none” option so that they can choose not to select any of the options available. A threshold model (e.g. Gilbride and Allenby 2006) can then be used to obtain the “no-settlement” utility. In the presence of “no choice data” the Nash utility aggregation is therefore a very straightforward extension of our proposed approach. Because groups may often decide not to select any of the available options, an extension of our approach to incorporate the “no choice” option should be explored. Embedded implicitly in Nash models is the notion of fairness which is supposedly optimal for group members who expect to engage in a long-term negotiation relationship (Keeney and Kirkwood 1975). Also, while the Nash model relies on cardinal utilities it does not require the interpersonal comparability assumption. Larger groups: Our proposed model can be extended to larger groups. For larger groups member specific preference shifts in equation (3) could be incorporated as follows: R I β mk = β mk +
(13)
9
∑ ∑φ
m ' ≠ m l =1
r m'k
γ m 'l cm ' kl
That is, shift in preference of member m for attribute k is caused by her incongruence ( cm′kl ) with each member m ′ in the group. The resulting shift captured by the product φm 'k γ m ' is expected to vary by member m ′ because it is plausible that member m reacts more strongly to the views of one member than the others. Utility aggregation then takes the following general form for the M member Harsanyi case: (14)
R u gj (u1R ,..., u MR ) = ∑m wm u mj
For the Rawls model the group utility is given by (15)
R u gj (u1R ,..., u MR ) = min(u1Rj ,..., u Mj )
While the model extension to larger groups is conceptually straightforward it mandates significant design accommodations. Unlike the dyadic case where each member is exposed to the other member’s preference, for larger groups incongruence needs to be manipulated for multiple members. For example, when the number of members equals three (e.g. teen, mom and dad) 37
stated preference manipulation (figure 3) needs to also include a similar manipulation for dad. Referring back to our earlier observation that all nine cells of the incongruence matrix (table 1) for each attribute need to be sufficiently populated to be able to estimate the revision parameters, this is particularly important as the number of members exceeds two. One area worth exploring is manipulating incongruence in an adaptive manner. Conditional on the stated preference of a given member it is possible to generate the manipulated “stated preference” of another member in such a manner that across groups all nine incongruence cells are well balanced. Such on-thefly designs are easy to implement and appear to be well suited for contexts that involve larger groups. Equation (13) can also be expanded to incorporate interaction terms in the revision process and may help understand the formation of coalitions in larger groups.
DISCUSSION
Accurate assessment of joint preference is critical in a wide variety of Business-toBusiness and Business-to-Consumer applications. Often times collecting joint data from group members to estimate joint preference is infeasible or cost prohibitive. Our main goal in this research is to propose a novel methodology to estimate joint preference based only on data collected separately from each group member. We accomplish this goal by merging experimental design, statistical modeling, and utility aggregation theories to capture the joint decision process of preference revision and concession. Our approach augments inferred preference measures based on choice data with stated preferences measures to estimate preference revision. Using data collected from over two hundred parent-teen dyads, we demonstrate that the proposed methodology works well when data are collected from matched or unmatched members. The ability of our approach to recover joint preference using unmatched members is particularly valuable in certain business contexts where it may be impossible to contact all members in the same group (e.g. a purchase manager and a physician buying hospital equipment). Note also that although our modeling framework is developed on the assumption that preference aggregation occurs between members who belong to different classes of people with distinct preferences, it is also applicable to the situation where members cannot be easily classified (e.g., co-owners of a business) into distinct groups. In this situation, one needs to specify only one heterogeneity
38
distribution for (i.e., members are exchangeable) initial preferences and estimate only one set of aggregate preference revision parameters. In addition to our main objective of predicting joint choice, our proposed methodology to measure revised preference can also be used to study preference interdependence in the conjoint choice set up. For example, future research may consider expanding our design to measure preference revision as a result of social pressures, in addition to preference of another group member. In recent years research in the area of conjoint experimental design has focused on topics such as design efficiency (e.g., Huber and Zwerina 1996; Sándor and Wedel 2005), how to handle a large number of attributes and levels (e.g., Bradlow, Hu, and Ho 2004; Srinivasan and Park 1997; Toubia et al. 2003), and matching conjoint choice share with actual market share (e.g., Gilbride, Lenk, and Brazell 2007). In light of our research, we see opportunities for follow-up research that can capture an individual’s intrinsic preference and influence of others in a unifying framework. The utility aggregation concept is also of interest for goods that are consumed in multiple contexts. Even within a person preferences are likely to be context dependent for a wide array of products such as digital cameras, personal computers and televisions. Individual preference for functions such as resolution, size and zoom for a digital camera are likely to be quite different for a child’s birthday versus a family vacation. This presents potential opportunities for follow-up research that carefully integrates utilities over an individual’s multiple consumption contexts. Despite merits, our research has several limitations. First, we test our methodology in a static joint choice context, that is, each joint choice is made independently. Future research, for example, may examine whether the Harsanyi model still performs the best in a more dynamic choice context (Su, Fern, and Ye 2003), where members make a sequence of joint choices, and may expect reciprocity. In this case, another form of utility aggregation (e.g., maximize maximum utility) may work better. Also, the very nature of product evaluation by a group may be non-compensatory—members may systematically rule out alternatives that are below a certain utility threshold. The dynamic and non-compensatory aspects of group decision making present significant conceptual and methodological challenges to study conflict which this paper does not quite address. Second, our tests for different utility aggregation models are conducted at the aggregate level (i.e., average across groups). Future research may investigate potential heterogeneity in utility aggregation methods across groups, and examine factors that affect such
39
heterogeneity. Third, we currently rely on the three simple categories of “must have”, “nice to have” and “don’t need” to capture preference congruence. Given the wealth of research in the area of self-explicated preference (Srinivasan and Park 1997), future research may develop a continuous scale that better measures extreme preference congruence to examine the polarization effect. Finally, as suggested earlier it may be fruitful to examine the effectiveness of our method as the number of members in a group increases. Larger groups also present opportunities to test novel and perhaps more efficient designs to estimate preference revision estimates.
40
APPENDIX
The Metropolis-Hasting algorithm (Chib and Greenberg 1995) was used to generate the empirical draws for estimation. Subscripts m and m ′ correspond to the two groups of parents and teens. Draws for each parameter were obtained as follows: 1) Generate {βIm, m = 1,………..,N} I −1 I I R f ( β mI | β m , Bm , γ m ,φm ) ∝ exp[ −(1 / 2)( β m − β m )′Bm ( β m − β m )]∏ Prmt ( j ) Prmt ( j ), t
where
PrmtI ( j ) =
I I exp( ∑ xmjk β mk ) k 3
∑ exp(∑ x n =1
I mnk
I β mk )
k
9
PrmtR ( j ) =
I R exp(∑ xmjk [ β mk + φm k ∑ γ m l cm ' kl ]) l =1
k
3
∑ exp(∑ x
R mnk
n =1
k
[β
9
I mk
+ φm k ∑ γ m l cm 'kl ]) l =1
2) Generate β m N
f ( β m | {β mI }, Bm ) = N ( ∑ m =1
β mI Bm N
,
N
)
3) Generate Bm N
[ Bm | {β mI }, β m ] ~ Inverted Wishart[b0 + N , B0 + ∑ ( β mI − β m )′( β mI − β m )], m =1
where b0 and B0 are the prior degree of freedom and precision, respectively. In our analysis, we set b0=10 and B0=10I+J where I is a (7×7) identity matrix and J a (7×7) matrix of 1’s. 4) Generate γ m f (γ m | {β mI }, β m , Bm ,φm ) ∝
N
exp[−(1 / 2)(γ m − γ m )′Gm−1 (γ m − γ m )]∏∏ PrmtR ( j ), m =1
t
where γ m and Gm are priors. In our analysis, we set γ m as a (9×1) vector of 0’s and Gm as a (9×9) identity matrix.
41
5) Generate φm N
R −1 f (φm | {β }, β m , Bm , γ m ) ∝ exp[−(1 / 2)(φm − φ m )′ Fm (φm − φ m )]∏∏ Prmt ( j ), I m
m =1
t
where φ m and Fm are priors. In our analysis, we set γ m as a (6×1) vector of 0’s and Fm as a (6×6) identity matrix. 6) Repeat steps 1-5 for member m ′ .
42
REFERENCES
Aribarg, Anocha, Neeraj Arora and H. Onur Bodur. 2002. Understanding the Role of Preference Revision and Concession in Group Decisions. J. Marketing Res. 39(3) 336-349. Arora, Neeraj, Greg M. Allenby and James L. Ginter. 1998. A Hierarchical Bayes Model of Primary and Secondary Demand. Marketing Sci. 17(1) 29-44. Arora, Neeraj and Greg M. Allenby. 1999. Measuring the Influence of Individual Preference Structures in Group Decision Making. J. Marketing Res. 36(4) 476-487. Arora, Neeraj. 2006. Estimating Joint Preference Using Data Imputation: A Sub-sampling Approach. Internat. J. Res. in Marketing 23(4) 409-418. Arrow, Kenneth J. 1951. Social Choice and Individual Values. Wiley, New York. Berger, James O. 1985. Statistical Decision Theory and Bayesian Analysis, 2nd ed. SpringerVerlag, New York. Bordley, Robert F. 1988. An Additive Group Utility for a Fund Manager. Management Sci. 34(7) 835-842. Bradlow, Eric, Ye Hu, and Teck-Hua Ho. 2004. A Learning-based Model for Imputing Missing Levels in Partial Conjoint Profiles. J. Marketing Res. 41(4) 369-381. Brock, Horace W. 1980. The Problem of “Utility Weights” in Group Preference Aggregation.
Oper. Res. 28(1) 176-187. Chandrashekaran, Murali, Beth A. Walker, James C. Ward, and Peter H. Reingen. 1996. Modeling Individual Preference Evolution and Choice in a Dynamic Group Setting.
J. Marketing Res. 33(2) 211-223. Chib, Siddhartha and Edward Greenberg. 1995. Understanding the Metropolis-Hastings Algorithm. Amer. Statist. 49(4) 327-335. Chorus, Caspar G., Theo A. Arentze, and Harry J. P. Timmermans. 2008. A Random RegretMinimization Model of Travel Choice. Trans. Res. 42(1) 1-18. Corfman, Kim P. 1991. Perceptions of Relative Influence: Formation and Measurement.
J. Marketing Res. 28(2) 125-36. Curry, David J., Michael B. Menasco, and James W. Van Ark. 1991. Multiattribute Dyadic Choice: Models and Tests. J. Marketing Res. 28(3) 259-267. Davis, Harry L. 1970. Dimensions of Marital Roles in Consumer Decision Making. J. Marketing
Res. 7(2) 168-177.
43
Davis, James H. 1973. Group Decision and Social Interactions: A Theory of Social Decision Schemes. Psychological Rev. 80(1) 97-125. Dawes, R. M. and B. Corrigan. 1974. Linear Models in Decision Making. Psychological
Bulletin 81(2) 95-106. DeGroot, Morris H. 1970. Optimal Statistical Decisions. McGraw-Hill, New York. Diamond, Peter A. 1967. Cardinal Welfare, Individualistic Ethics, and Interpersonal Comparison of Utility: A Comment. J. Political Econom. 75(5) 765-766. Diamond, Peter A. 1973. Consumption Externalities and Imperfect Corrective Pricing. Bell J.
Econom. 4 526–538. Dyer, James S. and Rakesh K. Sarin. 1979. Measurable Multiattribute Value Functions. Oper.
Res. 27(4) 810-822. Eliashberg, Jehoshua, Stephen A. LaTour, Arvind Rangaswarmi, and Louis W. Stern. 1986. Assessing the Predictive Accuracy of Two Utility-Based Theories in a Marketing Channel Negotiation Context. J. Marketing Res. 23(2) 101-110. Gelman, A. and D.B. Rubin (1992a), “A Single Sequence from the Gibbs Sampler Gives a False Sense of Security,” in Bayesian Statistics 4, J.M. Bernardo, J.O. Berger, A.P. Dawid, and A.F.M. Smith, eds. New York: Oxford University Press, 625–31. ——— and ——— (1992b), “Inference from Iterative Simulation Using Multiple Sequences (with Discussion),” Statistical Science, 7 (4), 457–72, 503–511 Gelman, Andrew, John B. Carlin, Hal S. Stern, and Donald B. Rubin. 2004. Bayesian Data
Analysis, 2nd ed. Chapman & Hall/CRC, Boca Raton. Geser, Hans. 2006. Pre-teen cell phone adoption: consequences for later patterns of phone usage and involvement. Sociology in Switzerland: Sociology of the Mobile Phone April. Gilbride, Timothy J. and Greg M. Allenby. 2006. Estimating Heterogeneous EBA and Economic Screening Rule Choice Models. Marketing Sci. 25(5) 494-509. Gilbride, Timothy J., Peter J. Lenk, and Jeff D. Brazell. 2007. Market Share Constraints and the Loss Function in Choice Based Conjoint Analysis. Working paper, University of Notre Dame, Notre Dame, IN.
44
Gilula, Zvi, Robert E. McCulloch, and Peter E. Rossi. 2006. A Direct Approach to Data Fusion.
J. Marketing Res. 43(1) 73–83. Green, Paul E. and Abba M. Krieger. 1985. Models and Heuristics for Product Line Selection.
Marketing Sci. 4(1) 1-19. Gupta, Sunil and Rajeev Kohli. 1990. Designing Products and Services for Consumer Welfare: Theoretical and Empirical Issues. Marketing Sci. 9(3) 230-246. Harsanyi, John C. 1955. Cardinal Welfare, Individualistic Ethics, and Interpersonal Comparison of Utility. J. Political Econom. 63(4) 309-321. Harsanyi, John C. 1975. Can the Maximin Principle Serve as a Basis for Morality? A Critique of John Rawls’s Theory. Amer. Political Sci. Rev. 69(2) 594–606. Harsanyi, John C. 1978. Bayesian Decision Theory and Utilitarian Ethics. Amer. Econom. Rev. 68(2) 223-228.
Hauser, John, Gerald J. Tellis, and Abbie Griffin. 2006. Research on Innovation: A Review and Agenda for Marketing Science. Marketing Sci. 25(6) 687–717. Huber, Joel, Dick R. Wittink, John A. Fiedler, and Richard Miller. 1993. The Effectiveness of Alternative Preference Elicitation Procedures in Predicting Choice. J. Marketing Res. 30(1) 105–114.
Huber, Joel and Klaus Zwerina. 1996. The Importance of Utility Balance in Efficient Choice Designs. J. of Marketing Res. 33(3) 307-317. Inman, Jeffrey J., James S. Dyer, and Jianmin Jia. 1997. A Generalized Utility Model of Disappointment and Regret Effects on Post-Choice Valuation. Marketing Sci. 16(2) 97-111. Keeney, Ralph L. and Craig W. Kirkwood. 1975. Group Decision Making Using Cardinal Social Welfare Functions. Management Sci. 22(4) 430-437. Keeney, Ralph L. 1976. A Group Preference Axiomatization with Cardinal Utility. Management
Sci. 23(2) 140–145. Keeney, Ralph L. and Howard Raiffa. 1993. Decisions with Multiple Objectives: Preferences
and Value Tradeoffs. Cambridge University Press, Cambridge, UK. Krishnamurthi, Lakshman. 1988. Conjoint Models of Family Decision Making. Internat. J.
Res. Marketing 5(3) 185-198. Luce, Robert Duncan, and Howard Raiffa. 1957. Games and Decisions. John Wiley, New York.
45
McFadden, Daniel S. 1974. Conditional Logit Analysis of Qualitative Choice Behavior. P. Zarembka, ed. Frontiers in Econometrics. Academic Press, New York. Menasco, Michael B. and David J. Curry. 1989. Utility and Choice: An Empirical Study of Wife/Husband Decision Making. J. Consumer Res. 16(1) 87-97. Myers, David G. and Helmut Lamm. 1976. The Group Polarization Phenomenon. Psych. Bull. 83(4) 602-627.
Nash, John F. 1950. The Bargaining Problem. Econometrica 18(2) 155-162. Nash, John F. 1953. Two Person Cooperative Games. Econometrica 21(1) 128-140. Neslin, Scott A. and Leonard Greenhalgh. 1983. Nash's Theory of Cooperative Games as a Predictor of the Outcomes of Buyer-Seller Negotiations: An Experiment in Media Purchasing. J. Marketing Res. 20(4) 368-379. Neslin, Scott A. and Leonard Greenhalgh. 1986. The Ability of Nash's Theory of Cooperative Games to Predict The Outcomes of Buyer-Seller Negotiations: A Dyad-Level Test.
J. Management Sci. 32(4) 480-498. Newton, Michael A. and Adrian E. Raftery. 1994. Approximate Bayesian Inference with the Weighted Likelihood Bootstrap. J. Royal Statist. Soc. 56(1) 3-48. Owen, Guillermo. 1969. Game Theory. W. B. Saunders Company, Philadelphia, PA. Parker, Barnett R. and V. Srinivasan. 1976. A Consumer Preference Approach to the Planning of Rural Primary Health-Care Facilities. Oper. Res. 24(5) 991-1025. Peters , Hans and Eric Van Damme. 1991. Characterizing the Nash and Raiffa Bargaining Solutions by Disagreement Point Axioms. Math. Oper. Res. 16(3) 447-461. Rao, Vithala R., Joel H. Steckel. 1991. A Polarization Model for Describing Group Preferences.
J. Consumer Res. 18(1) 108-118. Rawls, John. 1971. A Theory of Justice. The Bellknap Press of Harvard Univerisity, Cambridge, Massachusetts. Rawls, John. 1974. Some Reasons for the Maximin Criterion. Amer. Econom. Rev. 64(2) 141-146. Robert, Christian P. 2001. The Bayesian Choice. 2nd ed. Springer, New York. Roberts, John H. and James M. Lattin. 1997. Consideration: Review of Research and Prospects for Future Insights. J. Marketing Res. 34(2) 406-410. Roth, Alvin E. 1979. Axiomatic Models of Bargaining. Springer-Verlag, Berlin.
46
Sándor, Zsolt and Michel Wedel. 2005. Heterogeneous Conjoint Choice Designs. J. Marketing
Res. 42(2) 210-218. Sen, Amartya K. 1970. Collective Choice and Social Welfare. Holden-day, San Francisco. Simonson, Itamar. 1992. The Influence of Anticipating Regret and Responsibility on Purchase Decisions. J. Consumer Res. 19(1) 105-118. Small, Kenneth A. and Harvey S. Rosen. 1981. Applied Welfare Economics with Discrete Choice Models. Econometrica 49(1) 105-129. Srinivasan, V. and Chan Su Park. 1997. Surprising Robustness of the Self-Explicated Approach to Customer Preference Structure Measurement. J. Marketing Res. 34(2) 286–291. Su, Chenting, Edward F. Fern, and Keying Ye. 2003. A Temporal Dynamic Model of Spousal Family Purchase-Decision Behavior. J. of Marketing Res. 40(3) 268-281. Tobia, Olivier, Duncan I. Simester, John R. Hauser, and Ely Dahan. 2003. Fast Polyhedral Adaptive Conjoint Estimation. Marketing Sci. 22(3) 273-303. Train, Kenneth E. 2003. Discrete Choice Methods with Simulation. Cambridge University Press, New York. Yee, Michael, Ely Dahan, John R. Hauser, and James Orlin. 2006. Greedoid-Based Noncompensatory Inference. Marketing Sci. 26(4) 532-549.
47