eqal to 1 tuple per square unit. With the information about the empty areas, we can infer that the density is in fact larger in the non-empty areas and equal to: D =.
1 Query Selectivity Estimation via Data Mining Jarek Gryz and Dongming Liang Department of Computer Science York University Toronto, Canada Abstract. Estimating the result size of a join is an important query optimization problem as it determines the choice of a good query evaluation strategy. Yet, there are few efficient techniques that solve this problem. We propose a new approach to join selectivity estimation. Our strategy relies on information extracted from stored data in the form of empty joins which represent portions of the two joined tables that produce an empty result. We present experimental results indicating that empty joins are common in real data sets and propose a simple strategy that uses information about empty joins for an improved join selectivity estimation.
1.1
Introduction
A join of relations in real databases is usually much smaller than their Cartesian product. For example, the OLAP Benchmark [2] with a star schema of six dimension tables with, respectively, 12, 15, 16, 86, 1000, and 10,000 tuples, has a fact table of the size of 2.4 millions tuples. The size of the fact table is thus 0.00009% of the size of the Cartesian product of the dimension tables. This rather trivial observation about the relative size of the join and the respective Cartesian product, gives rise to the following questions: Can the non-joining portions of the tables (which we call empty joins in this paper) be characterized in an interesting way? If so, can this knowledge be useful in query processing? Consider the following example. Example 1. Consider Lineitem and Order tables in TPC-H [18]. The o order-date attribute in the Order table stores information about the time an item was ordered, the l shipdate attribute in the Lineitem table stores information about the time an item was shipped. The two attributes are correlated: an item cannot be shipped before it is ordered and it is likely to be shipped within a short period of time after it is ordered. Assume that an item is always shipped within a year from the time it is ordered. Thus, for a given range of o orderdate, only the tuples from that range extended by one year of l shipdate will be in the join of Lineitem and Order. None of the crossproduct between the remaining portions of the tables will appear together in the join result. Call any query that involves a join and that evaluates to the empty table an empty join. Now, consider the following query over TPC-H.
select sum(l totalprice) from lineitem l, order o where l orderkey = o orderkey AND o orderdate BETWEEN ‘1995.01.01’ AND ‘1996.01.01’ Since there is no predicate (except for the join) placed on the lineitem table, it seems that any tuple from that table can potentially appear in the answer. With this assumption, a database optimizer would vastly overestimate the cardinality of the join result. Given the correlation described above, however, we can infer that only the tuples satisfying the condition l shipdate BETWEEN ‘1995.01.01’ AND ‘1997.01.01’ can appear in the join. This knowledge can be used to provide a more exact estimate of the join selectivity. An empty join can be characterized in different ways. The most straightforward way is to describe it negatively by defining a correlation between data points that do join. Thus, for the two attributes from Example 1 we can specify their relationship as a linear correlation: l shipdate = o orderdate + [0, 1] year, where [0, 1] year is the correlation error. We explored this idea in [5] and showed how such correlations can be used in query optimization. We also learned, however, that such correlations are rare in the real data that we explored. Real data is likely to be distributed more randomly, yet not uniformly. In this paper, we are proposing an alternative, but complementary approach to characterizing empty joins as ranges of attributes that do not appear together in the join. For example, there are no tuples with l orderdate > ‘1995.01.01’ and l shipdate < ‘1995.01.01’ in the join of Lineitem and Order. In other words, the join of Lineitem and Order with thus specified ranges of l orderdate and l shipdate is empty. To maximize the use of empty joins knowledge, our goal is to not only to find empty joins in the data, but to characterize fully that empty space. Specifically, we discover the set of all maximal empty joins in a two dimensional data set. Maximal empty joins represent the ranges of the two attributes for which the join is empty and such that they cannot be extended without making the join non-empty. An efficient algorithm for dicovering maximal empty joins is presented in [3]. In this paper, we show how the knowledge of empty joins can be used for improved join selectivity estimates. Prediciting the size of a join is one of the most difficult tasks in query optimization and can be widely inaccurate in commercial database systems (with disastrous consequences for selecting a query evaluation plan). The technique we propose here is a straightforward generalization of Example 1. We show this technique to be useful in practice by experimental verification of the following two claims. First, real data sets contain a large number of empty joins, some of which are themselves very large. This is important as the value of our technique increases as the data is more skewed in that sense. Second, the estimates we provide are almost uniformly more accuarate than estimates based on an assumption of uniform data distribution or histograms. Last but not least, we develop this technique
with a possible commercial implementation in mind. We show how the existing tools in DB2 can be used to implement the technique. Our solution therefore has the highly desirable property that it provides new optimization method without requiring any change to the underlying query optimization and processing engine. The paper is organized as follows. Related work is described in Section 1.2. In Section 1.3, we describe a technique illustrating how knowledge of empty joins can be used in join size estimation. In Section 1.4 we present the results of experiments performed on real data, showing the nature and quantity of empty joins that can occur in large, real databases and evaluate the quality of estimates. We discuss maintanance issues in Section 1.5. Conclusions and future work are presented in Section 1.6.
1.2
Related Work
Query optimizer makes heavy use of the statistical information in cardinality estimation. There are two ways to store such information in the database: parametric and non-parametric [11] . In the parametric approach, the actual value distribution is approximated by a parameterized mathematical distribution. This technique requires little overhead, but it is typically inaccurate because real data does not usually follow any known distribution. Nonparametric approach is often histogram-based. [15,14] present histograms on single attribute. [13] presents an algorithm for generating equi-depth histograms. They show that equi-depth histograms work well for range queries only when the data distribution has low skew. [8] focuses on how to choose for each relation the histogram that is optimal for a self-join query. [12] proposes wavelet-based histograms, and their algorithm requires the domain size to be power of 2, which is too restrictive in real-life databases. Statistics for a combination of multiple attributes are studied in [15,6]. While a histogram is adequate for one attribute on a base table, [9] shows that a histogram is not practically efficient for multiple columns because of high storage overhead and high error rates. Current commercial database systems usually maintain histograms only for individual columns on base tables. A query joining two or more tables with multiple columns referenced makes the situation more complex. To estimate the size of such queries, the optimizers need to assume independence between attributes and predicates, and errors in the estimates may increase exponentially with the number of joins [15]. The problem is typically caused by propagating statistical information through the query plan. As a result, the optimizers often return lowquality execution plans for complex join queries. We are thus motivated to propose building new statistics over non base-relations for better estimates of join cardinality. To the best of our knowledge, there is no in depth effort so far to address this type of problem. [1] presents join synopses based on sampling for approximating query processing, and the technique is restricted
to be foreign-key joins. In contrast, we focus on estimating query cardinality. We are not histogram-based or sample-based, and we place no restriction on the type of joins.
1.3
The Strategy
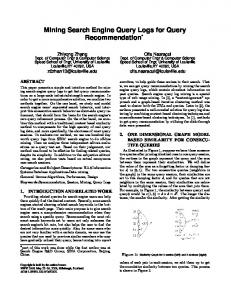
Most commercial database systems adopt the uniform distribution assumption (UDA) [16] for estimating query result size. This assumption is often incorrect even for a single attribute and is almost never true for a joint data ditribution of two or more attributes in a relation. This non-uniformity becomes extreme when the attributes come from different relations and appear together in a join result. Histograms have been shown to be an effective tool in estimating query selectivity independently of data distribution. However, their use has been mostly limited to single attribute queries; multidimensional histograms are expensive to construct and maintain. We are proposing a new technique (we call it SIEQE for Statistics in Empty Query Expression) for selectivity estimation of joins which provides much better prediction quality over UDA without the overhead associated with histograms. Our strategy is to discover and maintain several large empty joins and use information about them to improve the estimates of query selectivity. Although our techniques can be applied to distributions of several dimensions, we only consider two dimensional queries in this paper. Let R and S be two relations and R.A and S.B be two attributes referenced in range predicates. The first step of the technique consists in mining the join R 1 S for empty joins with respect to attributes A and B. Only the largest of the empty joins are maintained.1 Next, we compute the total area covered by the empty joins and adjust the ”density” of the data points in the remaining area. Let N be a number of tuples in R 1 S and < a1 , an > and < b1 , bm > be the ranges of A and B respectively. The density of data points (which is assumed to be uniform by UDA) can be defined N as D = (an −a1 )∗(b . Let Empty be the total area covered by empty joins. m −b1 ) Then the density of data points in the remaining are should be adjusted to be D0 = (an −a1 )∗(bmN−b1 )−Empty . Once a query is submitted, its overlap with the empty joins is determined and the size of non-empty area calculated. The number of data points in the non-empty area is then estimated from the adjusted density D0 . We illustrate the technique on following example. Example 2. Let the range of both A and B be < 0, 100 > and the join contain N = 10, 000 tuples. Assume that two empty joins have been discovered, one for 20 < A < 40 and 20 < B < 80, and the second one with 30 < A < 80 and 40 < B < 60 as shown in Figure 1.1. Thus, the empty joins cover 2,000 units of the entire (two-dimensional) domain. With UDA, the density D would be 1
The decision as to how many of the empty joins to maintain is application dependent; just as the decision on the number of buckets in a histogram.
B
A
���������� ������ ������ ������ ������ ���� ������������� ������� ������� ������� ������� ����� ������������ �������� �������� Q�������� �������� ����� ������������� ������� ������� ������� ������� ����� ������� ����� ����� ����� ����� ���
������ ���������������������� ������ ������ ��������������������������������� ������ ������ ������ ������������Q���������� ������ ������ ��������������������������������� ������ ������ ������ ����������� 1
2
Fig. 1.1. Empty joins and queries for Example 2.
eqal to 1 tuple per square unit. With the information about the empty areas, we can infer that the density is in fact larger in the non-empty areas and 10,000 equal to: D0 = (100−0)∗(100−0)−2,000 = 1.25. Let the first query Q1 , shown in Figure 1.1, be: select * from R, S where R.X = S.X and 50 < A < 70 and 50 < B < 70 Since only half of the query is within the region containing any data points, we can estimate the number of tuples in the result to be: 21 ∗ (70 − 50) ∗ (70 − 50) ∗ 1.25 = 250. With UDA, the number of tuples would have been overestimated to be 400. On the other hand, queries that do not overlap with empty regions would have their selectivities underestimated as the density of tuples would have been assumed to be lower. Consider query Q2 : select * from R, S where R.X = S.X and 10 < A < 30 and 70 < B < 90 With UDA, the estimated number of tuples would have been 400. However, given the existence of empty joins and consequently higher density of tuples outside the empty areas, that number should be estimated to be 500.
1.4 1.4.1
Experiments Characteristics of Empty Joins
We would expect real data sets to exhibit different characteristics than synthetic data sets such as the TPC-H benchmark. Hence, to characterize empty
Test NE 1 2 3 4 5
269 29,323 13,850 7 25,307
Size of largest 5 empty joins measured (in %) by metric S 74 73 69 7 7 68 58 40 37 28 91.6 91.6 91.3 91.3 83.1 8.8 2.1 1.2 0.6 0.3 39.9 39.8 24 20 20
Table 1.1. Number and Sizes of Empty Joins
joins we used two real databases: the first, an insurance database; and the second, a department of motor vehicles database. We ran the empty joins mining algorithm on 12 pairs of attributes. The pairs of attributes came from the workload queries provided with the databases. These were the attributes frequently referenced together in the queries (one from one table, and the other from a second table, and the tables are joined). For conciseness, we only present the results of five representative tests here.2 For all reported tests the mining algorithm ran in less than 2 minutes (on a single-user 67MHz IBM RISC System/6000 machine with 512 MB RAM). Table 1.1 contains the mining results: the number of discovered maximal empty joins NE and the sizes of the 5 largest empty joins measured by metric S. The metric S defines the size of an empty join as the area it covers with respect to the domains of values of the two attributes. It is defined formally in the following way. Let E be an empty join with the coordinates (x0 , y0 ), (x1 , y1 ) over attributes A and B with sets of distinct values X and Y respectively in tables R and S respectively. The relative size of the join with respect to the covered area, S(E), is defined as: S(E) =
(x1 − x0 ) ∗ (y1 − y0 ) [max(X) − min(X)] ∗ [max(Y ) − min(Y )]
(1.1)
The number of empty joins discovered in the tested data sets is very large. In some cases (see Test 3) it is on the order of magnitude of the theoretical limit of the possible number of empty joins [3]. In virtually all tests, extremely large empty joins were discovered. Usually, however, only a few are very large and the sizes drop dramatically to a fraction of a percentage point for the others. The empty joins overlap substantially. The five largest empty joins from Test 1 overlap with, respectively, 7, 11, 16, 7, and 8 other empty joins discovered in that data set. These overlaps are a consequence of our decision to find all maximal empty joins. They also cover a large area of the 2
They are representative in the sense that they cover the spectrum of results in terms of the number and sizes of the discovered empty joins.
join matrix; that is, the combination of values from the domains of the two attributes. We also performed experiments on attribute pairs from joins in TPC-D workload [18]. Unfortunately, the type of data distribution in TPC-D is not representative of a real data set. The data is synthetically generated, and the distribution of the attribute values tends to be uniform (except, of course, when certain constraints have to be satisfied). In all cases the results were very different from what we discovered in real data sets. Although the number of empty joins was large, they all were very small. 1.4.2
Estimate Quality
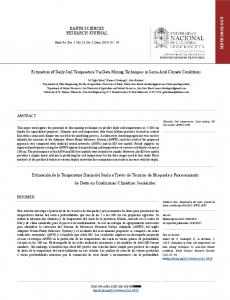
We performed experiments on 8 query templates3 from the workload described in Section 1.4.1. Each query template contained a join and two range selections. For each query template, we selected randomly 100 sets of endpoints for the ranges of the two attributes and estimated the result sizes of each such query. We mined for and maintained only five largest empty joins for each pair of attributes tested. One difficulty we faced in comparing errors produced by SIEQE and UDA was the fact that for queries which fall entirely within empty regions the error is either 0 or infinite. Thus, whenever the actual number of tuples was 0, we computed the error as if the number of tuples were equal to .01. Figure 1.2 shows the results. Except for one query template, SIEQE’s estimates are orders of magnitude better than UDA’s. Even if the empty queries are ignored, SIEQE still performs better than UDA. 10 9
10 9
10 8
10 8
10 7
10 7
10 6
10 6
10 5
10 5
10 4
10 4
10 3
10 3
10 2
10 2
10 1
10 1
Fig. 1.2. Average estimate error for eight query templates (all queries - left; nonempty queries - right) for SIEQE (white bars) and UDA (black bars).
The observed errors (even after empty queries are eliminated) are quite large.4 The reason is that the data distribution outside of the empty areas is 3 4
The workload queries did not contain actual values for the attribute ranges. We emphasize again that the number of maintained empty joins was very small (less than 5); the errors can be easily reduced by increasing that number.
Number of queries (in %)
far from being uniform and there are a few queries for which the errors are enormous. However, for most of the queries the errors produced by SIEQE are acceptable. Figure 1.3 shows the proportion of queries for which the error (produced both by SIEQE as well as UDA) was less than a given limit. For over 70% of queries, SIEQE predicted their cardinality with less than 10% error; UDA achieved it only for 34% of the queries.
100 SIEQE
75 50
UDA
25 0
0
25
50
100
75
Error
Fig. 1.3. Number of queries for which the error was less than a given limit.
100 50 0 20
40
60
80
100
−50 −100
0
Overlap of a query with an empty region (in%)
Error(under− or over−estimation)
Error(under− or over−estimation)
In the last experiment we tested how the estimate accuracy depends on the overlap of a query with an empty region. Figure 1.4 shows the errors for UDA and SIEQE respectively with an increasing overlap of a query with an empty region. For UDA, the error is underestimated for small overlaps and overestimated for large ones. This is consistent with the observation we made in Example 2. For SIEQE, there is no evident correlation, which is due to skewed distribution outside of the empty regions. We note that each point in the two figures may represent more than one query. In fact, many queries are represented by a single point (100% overlap and 0% error) in the right graph of Figure 1.4. On the other hand, none of the points representing these queries can be shown in the left graph of Figure 1.4 as the error is infinite for them.
100 50 0 20
40
60
80
100
−50 −100
0
Overlap of a query with an empty region (in%)
Fig. 1.4. Estimation error for UDA (left) and SIEQE (right) as a function of the size of an overlap of a query and an empty region.
1.5
Selection and Maintenance of Empty Joins
Since the number of empty joins discovered in real datasets is large, they cannot all be maintained. The decision on which joins to maintain depends primarily on the stability of the query workload and the frequency of updates. In an environment with a stable workload of queries and frequent updates, only a few empty joins which are most often referenced in workload queries should be kept. In [4], we proposed that empty joins be modeled as materialized views. The idea is to define views that represent exactly the queries covering the empty areas. Represented in this way, empty joins will not take space to store (except for their descriptions). However, just as with materialized views, there is an associated maintenance cost. The good news is that the techniques developed for the maintenance of materialized views [7] can be applied here as well. Since empty joins are a special case of materialized views, even more efficient maintenance techniques can be devised for them [4]. For example, empty joins are immune to deletions (they may become non-maximal, but they still correctly describe empty regions). Insertions are a problem only if they fall within a range of an empty rectangle. But even then, it is enough to keep track of the number of such insertions until they reach some unacceptable treshold. At that point, the algorithm for discovering empty joins will have to be executed again. We believe that our technique has important advantages over multidimensional histograms. First, as we argued above, it allows for an incremantal maintenance of empty joins. The only algorithm for dynamic maintenance of multidimenional histograms that we are aware of [17] does not apply to queries over joins. In the absence of incremental maintanance, multidimensional histograms have to be recomputed statically from the data. Our approach is also superior to histograms on that issue: constructing multidimensional histograms incurs a substantial cost in addition to computing the join (which is the input to the construction algorithm) [13,15]. The algorithm for empty join discovery requires only a single scan of the join result.
1.6
Conclusions and Future Work
We presented a new technique for estimating join result size. Our approach provides a substantial improvement in the quality of estimates over UDA, a standard assumption in database systems. We also showed that our technique is superior to multidimensional histograms with respect to construction and maintenance. Our next step in this work is to implement the technique in DB2. DB2 already supports the so-called twinning mechanism which allows adding a new predicate to a query to let the optimizer choose between alternate forms of predicates. For example, an IN predicate could be written as a set of OR predicates. We can use this mechanism to add a new predicate that reduces the ranges of predicates in a query that overlaps with an empty join.
The optimizer can then use the new predicate to get a better estimate of the query result cardinality. The maintanance of empty joins should also be straightforward as DB2 already supports deferred maintanance of materialized views [10].
References 1. S. Acharya, P. B. Gibbons, V. Poosala, and S. Ramaswamy. Join synopses for approximate query answering. In Proceedings SIGMOD, pages 275–286, 1999. 2. O. Council. APB-1 OLAP Benchmark Release II, Nov. 1998. (www.olapcouncil.org). 3. J. Edmonds, J. Gryz, D. Liang, and R. J. Miller. Mining for empty rectangles in large data sets. In Proc. of the 8th ICDT, pages 174–188, London, UK, 2001. 4. P. Godfrey, J. Gryz, and C. Zuzarte. Exploiting constraint-like data characterizations in query optimization. In Proceedings of Sigmod, pages 582–592, 2001. 5. J. Gryz, B. Schiefer, J. Zheng, and C. Zuzarte. Discovery and application of check constraints in DB2. In Proceedings of ICDE, pages 551–556, 2001. 6. D. Gunopulos, G. Kollios, V. J. Tsotras, and C. Domeniconi. Approximating multi-dimensional aggregate range queries over real attributes. In Proceedings of SIGMOD, pages 463–474, 2000. 7. A. Gupta and I. S. Mumick. Maintenance of materialized views: Problems, techniques, and applications. Data Engineering Bulletin, 18(2):3–18, 1995. 8. Y. E. Ioannidis and V. Poosala. Balancing histogram optimality and practicality for query result size estimation. In Proc. of the SIGMOD, pages 233–244, 1995. 9. J.-H. Lee, D.-H. Kim, and C.-W. Chung. Multi-dimensional selectivity estimation using compressed histogram information. In Proceedings SIGMOD, pages 205–214, 1999. 10. W. Lehner, R. Sidle, H. Pirahesh, and R. Cochrane. Maintenance of automatic summary tables. In Proceedings of SIGMOD, pages 512–513, 2000. 11. M. Mannino, P. Chu, and T. Sager. Statistical profile estimation in database. ACM Computing Surveys, 20(3):191–221, 1988. 12. Y. Matias, J. S. Vitter, and M. Wang. Wavelet-based histograms for selectivity estimation. In Proceedings SIGMOD, pages 448–459, 1998. 13. M. Muralikrishna and D. J. DeWitt. Equi-depth histograms for estimating selectivity factors for multi-dimensional queries. In Proceedings of SIGMOD, pages 28–36, 1988. 14. V. Poosala, Y. Ioannidis, P. Haas, and E. Shekita. Improved histograms for selectivity estimation of range predicates. In Proceedings of SIGMOD, pages 294–305, 1996. 15. V. Poosala and Y. E. Ioannidis. Selectivity estimation without the attribute value independence assumption. In VLDB’97, pages 486–495, 1997. 16. P. Selinger, M. Astrahan, D. Chamberlin, R. Lorie, and T. Price. Access path election in a relational database management system. Proc. SIGMOD, pages 23–34, May 1979. 17. N. Thaper, S. Guha, P. Indyk, and N. Koudas. Dynamic multidimensional histograms. In Proceedings of SIGMOD, pages 428–439, 2002. 18. Transaction Processing Performance Council, www.tpc.org. TPC BenchmarkT M D, 1.3.1 edition, Feb. 1998.