First European Conference on Earthquake Engineering and Seismology (a joint event of the 13th ECEE & 30th General Assembly of the ESC) Geneva, Switzerland, 3-8 September 2006 Paper Number: 619
VERIFICATION OF AN ADAPTIVE PUSHOVER TECHNIQUE FOR THE 3D CASE Helena MEIRELES1, Rui PINHO2, Rita BENTO3 and Stelios ANTONIOU4
SUMMARY The displacement based adaptive pushover (DAP) technique is an improved pushover technique in which a set of laterally imposed displacements, rather than forces, are applied in adaptive fashion to the structure. The technique has been extensively tested for two dimensional planar structures with considerable improvements when compared to conventional pushover techniques. It seems paramount, then, to verify its efficiency for the 3D case, in which it is hoped that the algorithm, will also lead to improved seismic response predictions. Herein, the DAP methodology is evaluated for a 3D asymmetric building structure (the SPEAR building). It is investigated how the pushover results of a spatial model can be best compared with the nonlinear dynamic envelops. Bidirectional excitation is considered. Seven different ground motions were used, all fitted to the same code-defined response spectrum. Additionally, the DAP methodology has been compared with a conventional non-adaptive pushover, where lateral forces in a triangular pattern are applied. Good agreement is obtained with the time history analysis results although torsional induced interstorey drifts are slightly underestimated. The advantages of the methodology are clear when compared to its non-adaptive conventional counterpart. Further testing on more irregular and complex buildings would manage to fully evidence the benefits of the method.
1.
INTRODUCTION
Pushover analysis has been gaining importance within the seismic assessment and/or design of building structures demonstrating to be a practical, easy to use, yet efficient tool; either as an alternative to the more complex nonlinear dynamic analysis for relatively simple non-critical structures or even as a complement to it for more complex and critical facilities. Indeed, even though it is unquestionable that nonlinear dynamic analysis is the most accurate method of analysis, the latter also proves to be a not–so-easy-to-use and much more demanding tool for the analyst. Indeed, the necessity of selecting, scaling and running the analysis for several ground motion records, a not so simple task, or of damping representation are some examples of such additional complexities. In addition, and especially when spatial models are required in the structural analysis, the computational effort and time consumed in the analyses can be significantly increased. On the other hand, pushover analysis is able to provide important structural response information, mainly with respect to stiffness, strength and ductility characteristics that are not so clearly recognized in the nonlinear dynamic analysis results, as discussed in detail in Pinho et al. [2006]. Furthermore, the recent developments in the field of pushover analysis have improved its accurateness and are gradually bringing it closer to the nonlinear dynamic analysis. This is accomplished by means of adaptive techniques; these take into account the stiffness degradation and consequent change of modal characteristics as the structure enters the nonlinear range; or, which is of main importance for irregular and complex structures, by considering higher mode effects. Furthermore, also included in some improved procedures is the so-called “spectral scaling” as a way to include in the analysis specific ground motion characteristics. __________________________________________________________________ 1
ROSE SCHOOL – European School for Advanced Studies in Reduction of Seismic Risk, Email:
[email protected] EUCENTRE – European Centre for Training and Research in Earthquake Engineering, Email:
[email protected] 3 IST – The Technical University of Lisbon, Department of Civil Engineering and Architectural, ICIST, Email:
[email protected] 4 SEISMOSOFT – Software Solutions for Earthquake Engineering, Email:
[email protected] 2
1
Pushover analysis was initially extensively investigated for 2D planar structures, after which the possibility of extending this analysis to irregular or asymmetric structures, as these cannot be reasonably decomposed into 2D systems, was explored. In such cases, strong coupling of the lateral and torsional motions occurs in each mode of vibration and a spatial model of the structure is required for the analysis. However, when performing a pushover analysis for 3D structures other aspects must be considered: for instance, where to apply the lateral loads, if to consider simultaneously applied loading or, instead, independent loading in the two orthogonal directions; if the latter is to be considered, how to combine the two orthogonal contributions? Moreover, the way to validate the results when comparing it to the nonlinear dynamic analysis becomes also more complex. First attempts to extend and verify 3D pushover algorithms have been carried out by Moghadam and Tso [1996], Kilar and Fajfar [1996], Faella and Kilar [1998]. Other, more recent endeavours are, for instance, the extension of the N2 method [Fajfar et al., 2005] to asymmetric buildings. Herein two independent pushover analyses in two orthogonal directions with the forces applied at centres of mass are proposed and the torsional effects are to be estimated by linear elastic response spectrum analysis, the results must then be combined. The Modal Pushover Analysis (MPA) [Chopra and Goel, 2004] which estimates the peak modal responses by performing several pushover analyses for each natural mode of vibration, with the respective invariant modal load pattern. The peak modal demand is then determined by an appropriate modal combination rule. Nevertheless, the aforementioned methods do not account for damage accumulation and consequent change of modal characteristics as the structure deforms into the inelastic range.
2.
THE DISPLACEMENT-BASED ADAPTIVE PUSHOVER (DAP) ALGORITHM-3D CASE
With a view to overcome the limitations found in force-based pushover procedures (be they adaptive or not), Antoniou and Pinho [2004] have proposed a paradigm shift in pushover analysis, by introducing the innovative concept of Displacement-based Adaptive Pushover (DAP). Contrarily to what happens in non-adaptive pushover, where the application of a constant displacement profile would force a predetermined and possibly inappropriate response mode, thus concealing important structural characteristics and concentrated inelastic mechanisms at a given location, within an adaptive framework, a displacement-based pushover is entirely feasible, since the loading vector is updated at each step of the analysis according to the current dynamic characteristics of the structure. DAP is thus an adaptive scheme that within a single run analysis accounts for changes in the stiffness properties of the system as well as for the specific properties of the required spectrum. Displacement contributions of several modes are combined (with a quadratic combination rule) and then incrementally applied to the structure. The implementation of the proposed algorithm is structured in four stages: • Definition of nominal load vector and inertia mass: this first step is carried out only once at the start of the analysis in order to define a nominal load vector U0. Such vector (i) allows for the definition of the structural nodes where the loads (forces or displacements) are applied and (ii) it characterises the initial load distribution shape. • Computation of load factor: the magnitude of the loading vector U at any given analysis step is obtained by the product of its nominal counterpart U0 and the load factor λ at that step. The load factor is automatically increased, by means of a load control incrementation strategy, until a predefined analysis target, or numerical failure, is reached. • Calculation of normalised scaling vector: the normalized modal scaling vector D determines the shape of the load vector (or load increment vector), accounting for the actual stiffness state of the structure, at every analysis step. An eigenvalue analysis is firstly carried out at the end of the previous load increment, in order to determine the mode shapes Φ and participation factors Γ of a pre-defined number of modes n. A spectral amplification factor is then also included by means of the displacement response spectrum ordinate corresponding to the period of vibration of the jth mode (Sd,j). • Update of loading displacement vector: once the normalised scaling vector D and load factor increment ∆λt have been determined, and knowing also the value of the initial nominal load vector U0, the loading displacement vector Ut at any given analysis step t can be updated according with the incremental updating scheme. As discussed in Pinho and Antoniou [2005], where the DAP algorithm is described and discussed in great detail, one of the main advantages in using a displacement-based pushover procedure lays on the fact that storey forces or shears are no longer applied directly to the structure but rather come as a result of structural equilibrium to the applied displacement pattern, thus allowing for the reproduction of reversal of storey shear distributions, observed in dynamic analysis, employing a single pushover run (rather than a combination of multiple runs).
2
3.
CASE STUDY AND MODELLING ISSUES
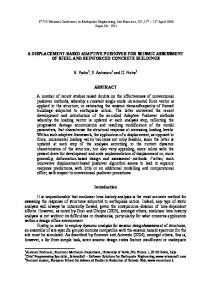
The building selected for the current study was the so-called “SPEAR building” designed within the research project SPEAR (Seismic Performance Assessment and Rehabilitation of Exiting Buildings), so as to represent typical old constructions in Southern Europe, without specific provisions for earthquake resistance. The building was designed for gravity loads alone. It features a non-symmetrical plan configuration but is regular in elevation. It consists of three two bay frames spanning from 3 to 6 meters in each direction with a storey height of three meters. From the nine columns, eight have a square cross section of 250x250 mm and one of them, referenced as C6, as a rectangular section of 250x750 mm, making it much stiffer and stronger in the yy direction. Therefore, the weak direction becomes the orthogonal xx direction. The above and the presence of a balcony on the east side of the structure are the major causes of the plan irregularity, shifting the centre of mass away from centre of stiffness. The plan view of the building can be seen in figure 1a.
East side
Y X
Figure 1: a) plan view of the building structure;
b) node numbering system.
The software used for all the performed analysis was SeismoStruct (SeismoSoft, 2006), a freely downloadable structural analysis program capable of predicting the large displacement behaviour of space frames under static or dynamic loading, taking into account the inelastic behaviour of the materials as well as the geometric nonlinearities of the elements. It is a fibre element program where the material inelasticity is explicitly modelled throughout the cross section area of the element and along the member length. The structure has been modelled as a space frame based on elements centre line dimensions. The discretised plan view of the structure with the defined node numbering system and the selected reference axes can be seen in figure 1b, where the code XX is replaced by 12 for top floor nodes. For instance, the node referred as 1217 belongs to column three and is placed at the top floor. For the inertia mass modelling it was considered the total permanent vertical loads plus 30% of its variable counterpart. The centre of mass coordinates are for the first and second floor (4,58;5,35) and for the roof are (4,65;5,44,). The centre of stiffness is very close to the central column, meaning that the eccentricity is larger in the yy direction. Rigid floor behaviour of the building structure could be assumed (since the actual slab of the tested model was very stiff in its axis). However, since the current version of the analysis software did not feature of defining diaphragm constraints to the nodes of a given floor, the diaphragm action was instead modelled by means of a set of crossed horizontal braces (infinitely rigid for axial compression and with no flexural or torsional resistance). Given the irregularity of the structure, however, and in particular due to the fact that a number of beams were supported in other beams (rather than at beam-column joints), this modelling of the slabs proved to be a delicate task with an unexpectedly relevant influence in the overall deformation of the structure for the case of the adaptive technique (DAP). In fact, while running the latter, it was observed that, for the typical bracing system initially used (four pairs of crossed braces, see figure 2), the slabs were not behaving as rigid but, instead, showed a deformed shape, as is noticeable in the same figure. In such cases, the obtained capacity curve would be prematurely finished and the complete behaviour of the structure into high levels of inelasticity could not be characterised. Also, it became apparent that local damage was being accentuated in those locations where beams
3
were connected to other beams, rather than to beam-column joints. Indeed, this undesirable local damage induced at such nodes influenced the computation of the periods and mode shapes of the structure which are subsequently used for the calculation of the induced displacements, and was thus heavily influencing the results in the DAP analysis. In conclusion, for 3D adaptive pushover, it is paramount for proper slab modelling to be available within the analytical tool being employed.
Figure 2: deformed shape for typical bracing system. Eventually, a bracing system capable of guaranteeing appropriate diaphragm action in both xx and yy positive directions was obtained. However, when pushing the structure in a different direction, a not fully satisfactorily behaviour was obtained, for which reason such results are not shown herein. For the dynamic analyses, it is also perhaps worth noting that only hysteretic type of damping, already implicitly included in the nonlinear fibre model formulation, was assumed, as all other sources of energy dissipation were considered to be negligible.
4.
PERFORMED ANALYSIS
The building structure was subjected to two types of nonlinear static analyses: the herein called conventional triangular pushover (ConvT) analysis and the displacement based adaptive pushover (DAP) analysis; additionally, nonlinear dynamic analyses (TH) were carried out so as to evaluate the performance of the preceding analyses. Therefore, the DAP methodology was not only compared with the results from the nonlinear dynamic analyses but, as means of properly accessing the advantage of having an improved pushover technique, the DAP methodology was also compared with its non-adaptive conventional correspondent, ConvT. The latter, however, is evidently force-based, given the inherently flawed nature of non-adaptive displacement-based pushovers. 4.1 Conventional triangular pushover analysis (ConvT) The herein so-called conventional triangular pushover is based on a commonly used lateral loading profile where the loading applied at each storey is inversely proportional to storey height and also proportional to storey masses. This gives rise to an inverted “triangular” loading pattern if the masses at each floor are equal. This is not the case in this study, as the sum of the masses at roof level is slightly less than the sum of the masses in each of the other two floors. The lateral loading per floor, in this way determined, was further distributed between all column-beam ends in proportion to their mass percentages. Forces are applied and not displacements. This type of conventional pushover has been extensively studied and used for plane frames. It shows to give a very accurate prediction for low rise buildings regular in elevation. However, when applied to the spatial model of the building by setting forces in both orthogonal directions it performed rather badly, as is subsequently showed. Indeed, the fact that forces were applied in the xx and yy directions simultaneously with equal intensities, showed to be the major cause of its inability to match the dynamic results. 4.2 Displacement based adaptive pushover analysis (DAP) The displacement based adaptive pushover has been preferred over its forced based counterpart (FAP) to perform the adaptive pushover analyses since when one is able to apply displacements, rather than forces, in an adaptive fashion, DAP manages to provide greatly improved predictions throughout the entire deformation range, of the dynamic response characteristics [Antoniou and Pinho, 2004]. All nodes belonging to a beamcolumn end connection in each of the floors were selected for the updating of the loading (displacements) vector. The combination rule used for combining modal contributions for the loading vector calculation was the
4
complete quadratic combination (CQC) rule with 5% damping. Spectral scaling was also considered. The spectral shape chosen was decided to be a code-defined response spectrum, which would be valid for all the accelerograms considered, since in a typical nonlinear static analysis procedure, the seismic hazard is defined in the form of a smooth site specific response spectrum. The spectrum used was for soil type A (rock or other rock like geological formation), type 1 spectrum (for moderate or large events) as is defined in Eurocode8 regulations [2002]. The loading was applied both in xx and yy directions simultaneously as in the ConvT. Finally, because the structure has unsymmetrical characteristics of strength and stiffness, both in the two orthogonal axes, but also in the two senses of the same axis, the loading was applied for both positive (x+,y+), for both negative (x-,y-) and for (x+,y-) and (x-,y+) senses. However, as referred above, the results obtained by the latest are not very reliable, due to the slab modelling issues and are not considered here. Nonetheless, this is not a very relevant aspect since differences in stiffness and strength within the same axes are almost negligible when compared to the differences between two orthogonal axes. However, it is believed that, were the differences more marked, it would be advisable that the DAP was evaluated for negative senses also, taking possibly the most critical situation. 4.3 Dynamic nonlinear analysis (TH) In order to assess the accurateness of the proposed DAP methodology when spatial models are used, several nonlinear dynamic analysis have been performed to the building structure. The dynamic analyses have been carried out for increasing intensity levels of the seismic action. Seven different accelerograms have been artificially generated corresponding to different values of magnitude and distance as well as shallow vs. deep alluvium, in order to account for different seismic hazard scenarios. The accelerograms have been fitted to the same smooth elastic response spectrum for 5% viscous damping, so has to take full advantage of the spectral scaling tool. Bidirectional excitation was considered and the accelerograms have been applied along the reference axes of the structure. It was decided that both orthogonal components would be fitted and scaled to the code selected spectrum for a certain intensity level. This meaning that both components have the same intensity. This was done for several reasons. Firstly, even though, in reality, the two orthogonal seismic components have different intensities and/or spectral shapes that may act at any angle relative to the structures reference axes, because this angle is not known in advance, site-specific spectra are generally generated using the average of fault-normal and fault-parallel attenuation relationships, thus are independent of orientation [Priestley, 2005]. It thus appears logic that the same design response spectra, of the same intensity, should be used in both directions. Secondly, if the components have different intensities, one has to decide in which direction the major component should be applied. Further, for varying incident angles, it is expected, intuitively, that the maximum response of the structure will be more similar when the two horizontal components have equal intensities than when they have different intensities, as the structure has different stiffness and strength properties in the two orthogonal directions. Finally, from the work performed it has been perceived that the capacity curves obtained by the pushover analysis (for simultaneously applied loading) were best compared with the outcomes of the time history analysis, for bidirectional excitation, for equal intensities orthogonal components. This would seem to be justified with the fact that for the calculation of the loading vector in the DAP algorithm, the value for the spectral amplification considered is the same for both directions only depending on the modal frequency. In other words, at least in its current stage of development, the DAP algorithm, does not take into account the relative intensities between the horizontal components of the ground motions. The first 3 accelerograms have been scaled for intensity levels of peak ground acceleration of: 0.06g; 0.10g; 0.15g; 0.20g and 0.25g and have been used for the comparison of the capacity curves. The last accelerograms have been scaled to intensities of 0.06g and 0.2g, representing, the former, the behaviour of the structure in the early inelastic range and the latter, the behaviour of the structure in the far inelastic range, close to collapse. These have been used to compare interstorey drifts and shear profiles.
5.
COMPARING THE RESULTS
Comparing the results obtained by the nonlinear static analyses with the outcomes from the nonlinear dynamic analyses is not a straightforward task and it requires a study of its own in order to understand how to optimise such endeavour. The comparison was based in the plotting of capacity curves, interstorey drifts and shear
5
profiles. Nevertheless, for three dimensional models it is vital that we compare these in more than just one point per floor, in the xx and yy directions. Because torsional effects are foreseen, evaluating just the central columns response, for instance, would not characterize the behaviour of the all structure. In this way, 3 points of comparison were taken. The point 1217, representing very much the behaviour of the centre of mass; the point 1231, the upper right corner point, further from the centre of mass, and the point 1201, the lower-left corner point, the furthest point from the centre of mass, see figure 1.b). 5.1 Capacity curves The capacity curves, representing the resistance of the structure when deforming into the inelastic range, come in the form of top displacement versus base shear plots. The capacity curves were evaluated for all the three selected top floor nodes, in the xx and yy directions. They were plotted against the dynamic results of only the first 3 ground motions for increasing intensity levels, as not to “overcrowd” the comparison. Regarding the dynamic envelop of the first 3 ground motions, one must decide on whether to: plot the maximum top floor displacement against the maximum base shear in a given direction independent of time at which they occur, plot the maximum base shear against the corresponding, in time, displacement value or, lastly, plot the maximum displacement against the corresponding base shear. A brief study has been dedicated to this by testing the three alternatives for plotting the results in all 3 selected points. If, in some cases, the three options would be similar, in others, the differences were evident. In figure 3, where a representative case is shown, it can be observed that the option of plotting the IDA points by taking the maximum base shear versus maximum displacement shows to be a significant advantage for comparison with the pushover curve, over the other two options. This graph corresponds to unidirectional excitation in the xx axis and to the corner point 1231. 1231. Weak direction. Top displacem ent (m m ) Base Shear (kN)
-3.0E+2 -2.0E+2 -1.0E+2 0.0E+2 0 DAPx
20
40
60
TH maxDispl vs. maxBS
80
TH maxBS vs. Displ
100
120
TH maxDispl vs. BS
Figure 3: Plotting options for the dynamic envelop. However, if it is clear the best option in the present study, it is important not to generalize the results for other structural systems as only a brief study has been carried out here (indeed, different studies, for 2D frames, seem to point in a different direction, suggesting that the best dynamic envelope plotting modality is maximum displacement against the correspondent base shear). The maximum displacement against the maximum base shear was therefore plotted in all cases. Additionally, it is important to refer that the maximum values were taken independently of the sign, i.e., the maximum absolute displacement couples with the maximum absolute base shear in a given direction. The capacity curves were also defined for loading in just one direction and for both positive and negative senses. It was seen that the difference in stiffness and strength in the positive and negative senses is negligible when compared to the differences in stiffness and strength in the two orthogonal directions. 5.2 Interstorey Drifts and Shear Profiles Interstorey drifts are an important parameter as they are closely related to the damage that can be sustained by a building in the recent trend of performance based engineering. Therefore, it is essential for static methods to provide not only correct capacity curves, but also drift values as accurate as possible. The drift profiles of the pushover and dynamic analyses were carried out for two intensity levels: for 0.06g, which is within the early inelastic range of structures response and for 0.20g, highly into the inelastic range and close to collapse (collapse was observed for some ground motions at 0.25g, bidirectional excitation). The deformation attained by the building in terms of interstorey drifts was assessed for each of the three selected points both in the xx and yy directions for the two intensity levels. The pushover interstorey drifts were taken for the maximum top displacement obtained by the nonlinear dynamic analyses, measured in the centre of mass (in fact at the point 1217). Taking the roof displacement at the centre of mass as the control displacement for the estimation of the target displacement seems to be the correct option, as the top displacement is usually the best representative point of the structures overall behaviour for buildings and the centre of mass is not influenced by torsional effects. The target displacement is, therefore, estimated directly from the dynamic results for comparison
6
purposes, although, in a typical procedure one would not have access to the dynamic analysis results. The seven ground motions were considered and their average value was also determined. Accordingly, the target displacement has been determined based on the average displacement obtained from the dynamic results of the seven ground motions. From the target displacement, one is able to determine the corresponding load factor (deformation level) in the pushover analysis. Two target displacements were calculated for the xx and yy directions based on the dynamic results yet only one corresponding load factor was determined (since a single pushover run was performed); the one matching closer both target displacements in the xx and yy directions, and then, the deformation of the structure was assessed. It was noticed that the average maximum displacements in the positive and negative senses were somewhat different. This happens due to some degree of differences in stiffness and strength for opposite senses or, more probably, due to ground motion characteristics. It was then decided that the displacements should be separated from positive to negative as it seems to be the correct procedure. In fact, there is some illogicality in selecting the maximum of the positive and negative displacements since the two ground motion components were only applied in one possible combination of senses along the reference axes. If the critical polarity of each component is to be adopted, based on the fact that the polarity of the excitation for a given ground motion record is arbitrary, then four possible combinations of the two orthogonal components should be considered, instead, in bidirectional excitation [Priestley, 2005]. And so, accordingly, the maximum positive drifts were determined and compared with the pushover applied in the positive senses of the xx and yy axes. The minimum negative drifts would be compared with the pushover applied in the negative senses; for the reasons above mentioned, this has not been presented here. In order to assess the proper distribution of the base shear throughout the floors, shear profiles were also evaluated. Shear profiles were plotted corresponding to the same load factors as the interstorey drifts, for the two intensity levels and for both pushover methods. 5.3 Influence of the intensities of ground motion components In reality, the two orthogonal components of the ground motion have different relative intensities, as has been referred. Usually, a reduction of about 90% up to 50% in the intensity is observed for the lower component. With the intention of assessing the influence of the relative intensities of ground motion components on the definition of the IDA points, the intensity of one of the ground motion components was reduced by 50%. Ground motion GM2 was used for this purpose. The dynamic analyses were run for bidirectional excitation, by applying the lower intensity component either in the xx or the yy axes and keeping the correspondent orthogonal component with the same intensity. Although the study is limited to one ground motion it can be understood that: (i) the IDA points, obtained for different relative intensities of the input ground motion, may tend in some situations to define a path that is different from the one defined by equal intensities ground motion components; (ii) it can be suspected that the capacity curves obtained by the pushover analysis are better compared with the dynamic outcomes for equal intensities ground motion components. The most perceptible results can be seen in figure 4, that correspond to the xx direction and to points 1217 and 1201. 1217. Weak direction. Base Shear (kN)
Base Shear (kN)
1201. Weak direction.
Top displacem ent (m m )
-3.0E+2 -2.0E+2 -1.0E+2 0.0E+2
Top displacem ent (m m )
-3.0E+2 -2.0E+2 -1.0E+2 0.0E+2
0 TH agy=agx
20
40
60
TH agy=0.5agx
80 100 120 140 160 180 agx=0.5agy
DAPxy
0 TH agy=agx
20
40
60
80 100 120 140 160 180
TH agy=0.5agx
agx=0.5agy
DAPxy
Figure 4: Influence of the relative intensity of ground motion components. In fact, as has been already referred, it is a logical step if we realize that the DAP algorithm, as is defined, accounts for the influence of ground motion characteristics by means of spectral scaling but it does not account for differences in the intensities or in the spectral shapes of the two orthogonal ground motion components. It could, however, be included in the algorithm the possibility of defining two different spectral shapes for the two orthogonal directions, even of different relative intensities, yet, as has been discussed above, we would then have to decide in which direction to apply the lower intensity spectral shape and it seems unreasonable to define different intensity response spectra if we note how code-defined site specific response spectra are obtained.
7
6.
ANALYSIS RESULTS
6.1 Capacity Curves The results presented in this section refer to the point 1201, in the weak direction, and to the point 1231, in the strong direction, and can be seen in figure 5. The results obtained for the other points, though not presented here, follow the same trend. 1201. Weak direction.
-2.0E+2 -1.0E+2 0.0E+2
-2.0E+2 -1.0E+2 0.0E+2
0 DA P
Top displacem ent (m m )
-3.0E+2 Base Shear (kN)
-3.0E+2 Base Shear (kN)
1231. Strong direction.
Top displacem ent (m m )
20
40
Co nvT
60
80
TH GM 2
100 120 140 160 180 TH GM 3
0 DA P
TH GM 1
20
40
Co nvT
60
80
TH GM 2
100 120
140 160
TH GM 3
180
TH GM 1
Figure 5: Capacity curves. Simultaneous loading. Bidirectional excitation. It was observed that the dynamic envelope (IDA points) featured reduced amount of scatter, mainly in the weak direction, which also refers to the direction of smallest eccentricity. It was also noticed that the dispersion of the dynamic results increased in the so-called flexible edge of the structure, both in the weak or strong directions; these results can be seen in figure 5. In general, the capacity curves obtained for the DAP had a very good agreement with the dynamic envelope, and even for the flexible edge, the matching is very well accomplished (figure 5). The precision of the methodology can be more clearly evidenced if we compare it with the results obtained for the conventional pushover also evaluated (ConvT). In this case, it was perceptible that the two pushover curves are side by side until, for higher inelastic deformations and close to the failure of the structure, the conventional pushover fails to present good results whereas the DAP can still follow the dynamic trend quite well. This shows, then, that the conventional pushover (with forces applied in both directions simultaneously) is too demanding for the structure, a feature that is clearly delayed by the adaptive pushover. 6.2 Interstorey Drifts (IDs) and Shear Profiles (SPs) From the results obtained for the IDs, the advantages of the DAP algorithm are further evidenced, mainly for high levels of inelasticity. In the early inelastic range (figure 6), it was observed that the matching of both pushover analyses to the dynamic envelope is very much achieved at the centre of mass (1217). This seems reasonable as this point is not influenced by torsional effects. For the corner nodes, it was perceptible that the DAP was able to impose to the structure an amount of torsional deformations, determined from its modal characteristics. Nevertheless, torsional induced IDs are not very well accounted for especially when estimating higher values of IDs (1201 in xx and 1231 in yy), for which both pushover methods tend to underestimate the results; still the DAP can be seen to improve slightly the results (1231 in yy). Far into the inelastic range (figure 7) the differences between the two pushovers are clearer. At this level, two conclusions could be drawn. One is the overall good performance of the DAP algorithm that consistently could adapt to the new stage of deformation and estimate the IDs at the centre of mass but could also properly estimate the IDs at the corner points. Yet, and again noticed is the slight underestimation of the IDs at the flexible edges of the structure (1201 in xx and 1231 in yy). It was seen, however, that this underestimation is reduced as we move more into the inelastic range possibly because the dynamic induced torsion tends to reduce also, as has been observed by Fajfar et al. (2005). The second main conclusion is the overall poor performance of the applied conventional pushover. The latter is mainly a consequence of loading the structure in two directions simultaneously. If the DAP is able to determine the proper load to apply in each direction and update it according to the new deformation stage, the ConvT will inevitably load excessively the structure in the weak direction and fewer in the strong direction. This feature can be clearly seen in the centre of mass (1217) where the IDs are overestimated in the weak direction and undervalued in the strong direction. Additionally, the results attained for the corner points are strongly mismatched with the dynamic envelop.
8
1231. Weak direction.
Floor
1217. Weak direction. 3
3
2
2
2
1
1
1
0 0.00%
0.25%
0.50%
0.75%
0 0.00%
1.00%
0.25%
0.50%
0.75%
1.00%
0 0.00%
3
3
3
2
2
2
1
1
1
0 0.00%
0.25%
0.50%
0.75%
0 0.00%
1.00%
0.25%
0.50%
0.75%
0.25%
0.50%
0.75%
1.00%
1201. Strong direction.
1231. Strong direction.
1217. Strong direction.
Floor
1201. Weak direction.
3
0 0.00%
1.00%
0.25%
0.50%
0.75%
1.00%
Interstorey Drift (%) DA P TH
Co nvT average
Figure 6: Interstorey Drifts. Simultaneous loading. Bidirectional excitation for 0.06g PGA.
Floor
1217. Weak direction.
1231. Weak direction. 3
3
2
2
2
1
1
1
0 0.00% 0.50% 1.00% 1.50% 2.00% 2.50%
0 0.00% 0.50% 1.00% 1.50% 2.00% 2.50%
0 0.00% 0.50% 1.00% 1.50% 2.00% 2.50%
1217. Strong direction.
Floor
1201. Weak direction.
3
1201. Strong direction.
1231. Strong direction.
3
3
3
2
2
2
1
1
1
0 0.00%
0.50%
1.00%
0 0.00%
1.50%
0.50%
1.00%
1.50%
0 0.00%
0.50%
1.00%
1.50%
Interstorey Drift (%) DA P TH
Co nvT average
Figure 7: Interstorey Drifts. Simultaneous loading. Bidirectional excitation for 0.2g PGA. The aforementioned conclusions were sustained by the SPs results. The results (figure 8), here presented for the intensity level of 0.06g, showed that, due to differences in stiffness and strength in the two orthogonal directions, the dynamic envelop presents different storey shears in xx and yy directions. This feature could be accounted for by the DAP for both stages of deformation while the ConvT fails by continually applying the same force intensity in both directions (resulting in the same storey shear). It is recalled that in DAP the storey shears are a calculated result of the imposed displacements, not withstanding, the matching was still reasonably close. Strong direction. 3
2
2
Floor
Floor
Weak direction. 3
1
0 0.0E+2 DA P
1.0E+2Storey Shear (kN) Co nvT
0 0.0E+2
2.0E+2TH
1
average
DA P
1.0E+2Storey Shear (kN) Co nvT
2.0E+2TH
average
Figure 8: Shear Profiles. Simultaneous loading. Bidirectional excitation for 0.06g PGA.
9
7.
CONCLUSIONS AND FURTHER WORK
The Displacement-based Adaptive Pushover methodology (DAP) is an improved pushover procedure, fully adaptive, multi-modal and with the possibility of including specific ground motion characteristics by spectral scaling. In its extension to the three dimensional case, loads have been applied in the two orthogonal directions, simultaneously, enabling the deformation states of the structure to be characterized by a single pushover run. No further post processing of the results are required and accuracy is gained. The results were compared with the outcomes from the nonlinear dynamic analyses for bidirectional excitation, given that for systems where the response cannot be reasonably decoupled into the two orthogonal directions (such is the SPEAR building), the accelerograms ought to include at least two orthogonal components. Both orthogonal components were scaled to the same response spectrum for the same intensity level as this was shown to be the most acceptable procedure, for both comparison purposes as well as conceptually wise. For the casestudy considered, DAP showed to be a powerful tool and overall good quality results were obtained. Still, and although it was perceptible that the DAP was able to impose to the structure torsional deformations, determined from its modal characteristics, the dynamic induced torsion is underestimated, mainly in the early inelastic range. The advantages of the methodology are clearer when compared to its non-adaptive conventional counterpart. In fact, the conventional pushover, as it was performed, is unadvisable for 3D pushover analysis, as it seems to characterise rather poorly the deformation states of the structure. To fully evidence the benefits and drawbacks of the DAP methodology further work is recommended, however, on more irregular, complex and high-rise building structures; nonetheless, it is believed that it will perform superiorly for these systems as well. ACKNOWLEDGEMENTS The research work presented here was developed within the scope of the project POCI/ECM/59306/2004 Performance-based Seismic Design Procedures and financially supported by Fundação para a Ciência e Tecnologia (FCT), Portugal. Also, it was partly funded by the FCT, under Grant from the Pluriannual Programmatic Financing POCI/SFA/76. Finally, the authors would also like to acknowledge and thank the assistance of Dr. Manuel Lopez and Dr. Roberto Nascimbene in the modelling of the SPEAR building. REFERENCES Antoniou S., Pinho R. (2004), Development and verification of a displacement based adaptive pushover procedure, Journal of Earthquake Engineering, 8, nº 5, 643-661. Comité Europeen de Normalization (2002), Eurocode 8: Design of structures for earthquake resistance, Part 1: General rules, seismic actions and rules for buildings, draft 5, Brussels Doc CEN/TC250/SC8/N317. Chopra A.K., Goel R.K (2004), A modal pushover analysis procedure to estimate seismic demands for unsymmetric-plan buildings, Earthquake Engineering and Structural Dynamics, 33, 903-927. Faella G. and Kilar V. (1998), Asymmetric Multistorey R/C Frame Structures: Push-over versus Nonlinear Dynamic Analysis, Proceedings. of the 11th European Conference on Earthquake Engineering. Fajfar P., Marušić D., Perus I. (2005), The extension of the N2 method to asymmetric buildings, Proceedings of the 4th European Workshop on the Seismic Behaviour of Irregular and Complex structures, nº 41. Kilar V. and Fajfar P. (1996), Simplified Push-over Analysis of Building Structures, Proceedings of the 11th World Conference on Earthquake Engineering, nº 1011. Lopez M. (2003), 3D pushover of irregular reinforced concrete buildings, Master Thesis, European School for Advanced Studies in Reduction of Seismic Risk (ROSE School), Italy. Moghadam A.S. and Tso W.K. (1996), Damage Assessment of Eccentric Multistory Building Using 3-D Pushover Analysis, Proceedings of the 11th World Conference on Earthquake Engineering, nº 997. Pinho R. and Antoniou S. (2005), A displacement-based adaptive pushover algorithm for assessment of vertically irregular frames, Proceedings of the 4th European Workshop on the Seismic Behaviour of Irregular and Complex structures, Thessaloniki, Greece. Pinho R, Antoniou S and Pietra D. (2006), A Displacement-based Adaptive Pushover for Seismic Assessment of Steel and Reinforced Concrete Buildings,” Proceedings of the 8th US National Conference on Earthquake Engineering, San Francisco, USA, n°. 1701. Priestley M.J.N. (2005), Performance-based design of Port Structures, Keynote Lecture at the 5th International ROSE Seminar, Pavia, Italy. SeismoSoft (2006) SeismoStruct - A Computer Program for Static and Dynamic Nonlinear Analysis of Framed Structures [online], available from URL: http//www.seismosoft.com.
10