work and home) is an integral part of daily activity. III this chapter, we .... journey. Imputed. Indoor, outdoor,. Almanza (2012). 29.93%, 39.90% greenspacc.
130
Tao FengandHarryJ. P Timmermans
R efe re nces B·Rider (2014). Cycling to work. www.h-riders.nV Sreiman, L. (1996). Ollt· oJ.bag estimation. f'tp.stat.berkeley.edulpub/userslbreimanl OOBestimation.ps Sreiman, L. (200 1). Random forests. Machine Learning, 45: 5-32. Feng, T., and Timmennans, H.J.P. (2014a) Extracting activity·travel diaries from GPS data: Towards integrated semi·automatic imputation. Procedia Environmental Science, 22: 178-185. Feng, T. , and Timmennans, H.J.P. (2014b) Travel survey using GPS devices: Experiences in The Netherlands. In Mobile technologies/or activiry·travel data collection and analy· sis. 101 Global. Feng, T., and Timmcrmans, l-l.J.P. (2013). Transportation mode rccognition using GPS and accelerometer data. Trallsportation Research Part C, 37: II S-130. Feng, T., and Timmennans, H.J.P. (20 15). Detecting activity type from GPS traces using spatial and temporal infonnation. EW'opeall JOll/'llal 0/ Transport and In/rastructure Research, 15(4): 662- 674. Gong, L. , Yamamoto, T.. and Morikava, T. (2015). Comparison of activ ity type identi fi· cation from mobilc phone GPS data using various machine learning mcthods. Asian Transport Studies, 4(1): 114-12S. Greene, E., Flake, L., Hathaway, K. , and Geilich, M. (2016). A seven·day smartphone·based GPS household trave l survey in Indiana. In TRB 95th allllllal meeting compendium 0/ papers. Washington, DC, January 10--14. Hall, M., Frank, E., Holmes, G., Pfahringer, 8., Reutemann, P., and Witten, 1.1-1. (2009). The WEKA data mining software: An update. ACM SIGKDD Explorations Nesletter, 11(1 ): 10-18. Hill , T., and Lewicki, P. (2005). Statistics: Methods and applications paperback, November Kohavi, R. ( 1995). The power 0/ decision tables. Lecture Notes in Computer Science. McGowen, P., and McNally, M. (2007). Evaluating the potential to predict activity types from GPS and GIS data. In Proceeding o/the 86th annual meeting o/the Transportation Research Board, January, Washington, DC. Mont ini, L., Rieser·SchUssler, N., Homi, A., and Axhausen, K.W. (20 14). Trip plllpose ideflfijicatioll from GPS tracks. Transportation Research Record, 2405. http://dx.doi. argl 10.3 14 1/2 405 -03 OSM. OpenStrectMap. http://wiki.openstreetmap.orglwiki/main_Page Rasouli, S., and Timmennans, H.J.P. (2013). Mobile technologies for activity· travel data collection and analysis. New York: IG I. Reumcrs. S., Liu, F., Janssens, D., Cools, M., and Wets, G. (2013). Semantic annotation of Global Positioning System traces: Activity type inference. Transp ortation Research Record: JOllrnal o/the Transportation Research Board, 23S3: 35-43. Shen, L., and Stopher, P.R. (2014). Review ofGPS travel survey and GPS data· processing methods. Transport Reviews, 34(3): 316--334. Xiao, G., Juan , Z., and Zhang, C. (2016). Detecting trip purposes from smartphone· based travel surveys with artificial neural networks and particle swrum optimization. Transpor· ration Research Part C, 7 1: 447-463. Wolf, J., Guensler, R., and Bachman, W. (200 I). Elimination o/the travel diary; An experi· ment to derive trip p urpose/rom GPS travel data. Paper Presented at SOth annual meeting of the Transportation Research Board, Washington, DC. Wolf, J., ScilOnfelder, S., Samaga, U., Ol iveira, M., and Axhauscn, K.W. (2004). SO weeks of GPS· traces: Approaches to enriching the trip infonnation. Transportation Research Record: JOllmal o/the Transportation Research Board, IS70: 46--54.
11 Processing uncertain GPS trajectory data for assessing the locations of physical activity Sungsoon Hwang, Sai Yalla and Ryan Crews Introduction An individua l's health outcomes can be influenced by lifelong environmental
exposures (Wild, 2012). However, environmental influences on health have been difficult to tes t partly due to challenges with objectively quantifying environmental exposures. in recent years, advances have been made in technologies that enable the objective and integrated measurement of the environment and health behavior
(such as active living and healthy diet). In tandem, there has been much effort in measuring context-specific physical activity using GPS, accelerometers and Geo·
graphic Infonnation Systems (GIS) in an effort to detennine environmental influences on physical activity (Oliver, Badland, Mavoa, Duncan and Duncan, 2010). Methodological combinations of these technologies increase the accuracy and sen· sitivity of exposure assessment compared to conventional methods that rely on a self-report or one of the technologies (Jankowska, Schipperijn and Kerr, 20 15). The accurate and integrated measurement of health behavior and the environ· ment (such as location-specific physical activity) is crucial to improving exposure assessment. It can he lp d eterm ine env ironmen tal correlates of h ea lth behavior (e.g., what features of the built environment encourage or inhibit physical activ·
ity?); refine ecological models of hea lth behavior (e.g., how do personal, social and environmental influences on physical activity interact with each other in a
transportation domain?); and inform policy changes fo r promoting healul behavior (e.g., what design considerations and zoning codes should be fonnulated to help build walk able and healthy cities?) (Sailis, Owen and Fisher, 2008). However, assessing context-specific physical activity using available techno 10· gies is not challenge-free. If GPS data are to p rovide the locational context, the
quality of the integrated data is only as good as that of the GPS data. Presently there is no consistent method of processing GPS data in trying to monitor the
locations of physical activity (Demant Klinker, Schipperijn, Toftager, Kerr and Troelsen, 2015; Krenn, Titze, Oja, Jones and Ogilvie, 2011; McCrorie, Fenton and Eilaway, 2014). One common problem with using GPS is that GPS logs incur gaps when GPS signals call1lot be received (typically indoors). As a resuit, many previous studies limit their analyses to physical activities that are conducted out· doors (Almanza, l eITett, D unton, Seta and Pentz, 2012; Jones , Coombes, Griffin
132
Processing uncertain GPS trajectory data
Sungsoon Hwang et al.
13 3
and Sluijs, 2009; Oliver, Badland, Mavoa, Duncan and Duncan, 2010; Oreskovic et aI., 2012; Rodriguez, Brown and Troped, 2005). This is problematic because
environmental context of physical activity, there is significant variation in the
physical activity conducted indoors (e.g., commercial settings, exercise facilities,
GPS data) can skew outcol1l.e measures (e.g., underestimation of indoor activities) and those gaps are inconsistently dealt with. The inconsistency in the methods of dea ling with location data can be noted in Table 11.1 that compares those methods employed in 13 well-cited studies intending to assess the locations of physical
work and home) is an integral part of dai ly activity.
III this chapter, we present an algorithm that assesses the location and domain of physical activity using GPS, accelerometers and GlS. The algorithm is used
method.s for processing GPS data. In particular, missing track logs (or time gaps in
This work intends to contribute to the development of a consistent method for
activity using GPS, accelerometers andlor GIS (Ahnanza et aI., 2012; Cooper et aI., 2010; Jones et aI., 2009; Lachowycz et aI., 2012; Maddison et aI., 20 I 0; McCrorie, Fenton and Ellaway, 2014; Oliver et aI., 2010; Oreskovic et aI., 2015; Rainham et aI., 2012; Rodriguez et aI., 2012; Rodriguez, Brow~ and Troped, 2005; Wheeler et aI., 2010; Wiebe et aI., 2008). It can be seen from Table 11.1 that gaps are present for a large port ion of GPSI activity data, and much of those physical activ ity data are discarded if GPS gaps
processing GPS data in order to identify the locational context of24hr/day physi-
are excluded from analysis. If gaps are not excluded from analysis, unknown
to calculate outcome measures such as the time spent on transportation domains of physical activity. Following a discussion on growing interests in the enviromnental context of physical activity and methods for objectively quantifYing context-specific physical activity this chapter will describe the newly proposed
method for measuring location-specific physical activity. Next the perfonnance of tile proposed method utilizing data collected from 39 subjects will be reviewed.
cal activity measurements. Related work Numerous health organizations recognize the importance of the mUltiple levels of
influences on health, from individual factors to the buil t environment (Shortell , Weist, Sow, Foster and Tahir, 2004). In pru1icular, an increasing number of studies
suggest that the built envirorunent (such as access to parks and recreationa"I facilities and neighborhood walkability) is associated with physical activity (Adkins, Sherwood, Story and Davis, 2004; Sundquist et aI. , 2011; Van Holle ct aI., 2014). However, results have not always been consistent (Sallis, Floyd, Rodriguez and
Saelens, 2012). Furthermore, changes to the built environment (e.g. , auto-oriented design) and demographic changes are seen to have contributed to decl.ining levels of physical activity in domains of household, occupation and transportation over the last few decades (Brownson, Boeluner and Luke, 2005; K1laing Nang et aI., 20 I 0). This implies tbat there is a need for shifting an emphasis on physical activity interventions in non-leisure time domains. In tandem, there is a growing
consensus that enviroillnentai interventions (e.g.) building bike lanes in a geo-
locations during signal loss are typically imputed using decision rules that are
developed for the respective study. The most commonly used rule is to impute an unknown locat ion during signal loss as an indoor location th at is close to the .Table 11.1 Comparison of methods for processing GPS· data for measuring the locations
of physical activity
Re/erences
The Percent o/Gaps
Handling Gaps
Types
Rodriguez (2005)
40% out of activity data 17% out of GPS data 34% out ofactiviry data 2% out of GPS data
Excluded for analysis Imputed
nla
W iehe (2008) Jones (2009)
Coo per (2010)
detected Not reponed
Excluded for analysis Imputed Excluded for analYSis Imputed
Maddison (2010) Oliver (2010)
10% out of trips
graphically targeted manner) sbould be considered in promoting physical activity in conjunction with informational and behavioral approacbes (Kahn et aI., 2002). Geospatial methods can be of value in fomlUlating effective environmental in ter-
Whee ler (2010)
Not reported
Imputed
Almanza (2012)
29.93%, 39.90%
ventions as well as elucidating the role of envirorunental exposures in shaping
Rodriguez (20 12)
10 minutes by default) occurs. PALMS marks initial locations based on the last fix before a gap,
the first fix after a gap, trip starts and trip ends. It then finds a cluster of fixes within N meters (30) of initial location, to mark a location. Once locations are identified, potentially false trips that do not meet the specifi c cooditions are removed. False
trip removal is necessary due to presence of excessive GPS jitter when the device is indoors with poor satelli te reception. The mode detection modules assign mode (e.g., pedestrian, bicycle and vehicle) based on the speed ofa trip segment.
In contrast to other approaches to GPS data processing, PALMS takes into account uncertainty of GPS data, such as missing, inaccurate and inconsistent data points. Furthermore, segmenting GPS trajectory into trips and locations makes data more manageable because it enables higher level representation with less data (e.g., significant locations and trips instead of raw GPS track logs). Similar to PALMS, our approach fully automates the process of cleaning raw data, segmenting GPS trajectory into episodes of stops and trips (moves) and synchronizing
those episodes with accelerometry-based act ivity epochs to detennine physical activity locations. Tbe proposed met bod
The proposed algoritlun assigns location category (home, work, others and transport) to epochs of physical activity. Unlike other approaches, 'processed' GPS
data are merged with activity data instead of 'raw' GPS data to minimize effects
Step 1. Data cleaning: this module deletes inaccurate and redundant records as well as spatial outliers. lnaccurate records are those with no location fix or Horizontal Dilution of Position (HDOP) > = 4, the number of sateliites used < 4
adjacent pomts. Then we divide the distance noted earlier by standard distance of p's temporal neighbor, to adjust the numerator to a degree of spatial dispersion of
p's temporal neighbor. If the ratio noted earlier is greater than 1.5, a record pis marked as a spatial outlier in the current study. Step 2. Gap treatment : a gap whose duration exceeds the minimum duration of a stop (3 minutes) is mapped to one or more episodes using decision rules. Decision ruJes are based on gap duration, gap distance, average gap speed (calculated as gap distance/gap duration) and average speed of data points for I minute fo llowing a gap. I f gap dis tance is small « 300 meters), then a gap is mapped to ~ s,to P. epIso~e. Ot!~erwlse, a gap IS mapped t~ three possible cases. If a subject IS ~vldently movmg (> 0.5 mls), then a gap IS mapped to a move episode. If a subject moves ' too slowly' « = 0.5 mls) but speed increases later, til eo a gap is mapped to a sequence of stop and move episodes. If a speed does not increase
~ ater, a gap is m~pped to a seque~ce of stop, move and stop episodes. Once a gap IS
mapped to eplSode(s), synthettc data points are added to fill a gap such that a
sequence o.f those data points can be detected as mapped episodes in the next module. For i~s tance, ':finPts data points are added at the location ofa data point before a gap If a gap IS mapped as a SlOp, and MinPts data po ints are added to
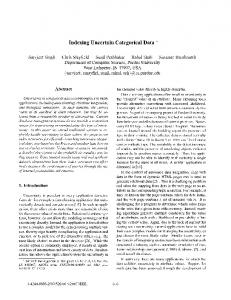
construct a linear path between two consecutive data points before and after a gap if a gap is mapped as a move. Step 3. Episode detection: this module first detects a set of consecutive GPS P?ints that are 'density connected' based on 1\yo parameters MinPts and Eps. In Figure 11.1 a, the five consecutive data points are not a stop because the number of data points within the search radius Eps is less than MinPls (five in this case). In contrast, five consecutive data points in Figure lIb could potentiall y form a
136
Sungsoon Hwang el al.
ProceSSing uncertain GPS trajectory data
Res ults
@0 .-', . " . ,--L,
,
LE
. .. . .,
".
.
'
(a) This is not a Slop
'.
".
'
'"
(b) This can be a stop
Figure II. J Detecting a stop with DBSCAN
stop because the number of data points within £ps is more than MinPrs. £ps is set to 3.5*1' to take into account the speed of consecutive data points and make the algoritlun work for GPS trajectory data with different recording time intervals r. For each spatial cluster detected earlier, the time duration of a spatial cluster is checked to see ifit is greater than or equal to MinDur. lfthe duration requirement is met, then a spatial cluster is marked as a slap. Any data point that is not marked as a stop is classified as a move. Step 4. Post-processing: once GPS track points are classified into stop or move episodes, a majority fi ltering is perfonned on a moving window to remove noi se. Any misc lassified episode value is marked for reconsideration (i.e., reclassified into alternate values). To detect a false stop or move, the algoritlun calcu lates heading change rate and circuity in addition to the length, time duration and the number of data points for each un ique episode. The idea is that many indoor stops are falsely classified as a move due to GPS jitter represented by back-and-forth movement (with high circuity and heading change rate). Conversely, a slow move (e.g. , a stroll in the park) that is falsely classified as a stop due to large Eps is marked for reconsideration due to low circuity and heading change rate. Step 5. Location assignment: once the segmentation of GPS u'ajectory into episodes is finalized, a predefined location code is assigned to each of unique episodes that are temporally sequenced. Location codes, such as 'home' and 'work' are assigned to stop episodes, respectively if mean coordinates for a stop episode are close to « 250 meters) coded locations provided by participants. Location code, 'others' is assigned to stop episodes whose locat ion code is not assigned a priori. Location code, 'transport' is assigned to move episodes. Step 6. Synchronization: activity epochs from an accelerometer are synchronized with episodes from GPS trajectory based on a timestamp. More specifically, the beginning and ending time of episodes are compared with those of activity epochs, to generate the merged master file that contains a sequence of unique events that consist of activity epochs paired with GPS episodes. This essentially assigns location code to activity epochs. The synchronized un ique event has properties like beginning time, ending time, time duration, location code and activity category (e.g., walking, standing, sitting, lying).
Thirty-~ine healthy subjects (20 urban, 19 suburban residents) were cons .. to ~artlclpate
UI Lbe study with an IRE-approved infonned consent fonn majority of participants were students (30 full-time studen ts, 6 part-time stude full-tune workers) ill thelr20's (23.64 ± 3.38yrs) with 22 male and 17 female. T were asked to wear a GPS data logger (QStarz Travel recorder BT-Q 1000XT) a trl-~Xlal acce lerometer ~PAMSys sensor, BioSensics) continuously for two ( secutlve days: GPS data IS recorded at a regular time interval (any of I, 5 01 seconds). ActiVIty datacontain ed the number of steps and body posture (walk standIng, lYIng and slttmg) at every second. MinDur was set to 180 seconds MinPls was set to 5 for GPS data process ing. Data was collected from Ap;j December of2014. The proposed algorithm was implemented in Python 2.7 \ an ArcGIS 10.4 site package ArcPy. . S~mple GPS trajectory data before and after GPS data processing are depi< ill FIgure 11.2. The GPS data processing algorithm reduced tens of thousand r~w G:S track points. into dozens of stop and move episodes. Further, the al nthm ~pu(e~ .gaps In raw ?PS trajectory and allowed for matching local ?ata With. actlvll?' data even In tbe presence of gaps, instead of excl uding g ill analYSIS. For Instance, a move episode was generated between stop episo
Input Raw GPS Trajectory (n ~ 24,589)
Output: 12 Stops and 11 Moves Exlracb
-. -
!'
- " -,. -" " -m
,
-~
Figure 11.2 Inpul and output of the GPS data processing algorithm
138
Processing uncertain GPS tl'ajectOlY data
Szmgsoon Hwang et 01.
1 and 3 as a resu lt of gap treatment. The average gap in raw GPS trajectory data was 29.2 hours out of 47.6 hours (64%) of the monitoring period. As a result of gap treatment, 99.7% of the monitored time in GPS data was matched wi th activity data. To evaluate the performance of the proposed method, reference episode values (move or stop) were manually coded for all records in the processed GPS data. The coding was conducted by visually inspecting GPS points tbat were superim posed against high resolution remotely sensed imagery in ArcGlS 10.4. The manually coded va lue was also verified against travel diaries logged by participants. To obtain a measure of overall accuracy, we first identified matched records where episode values predicted by the proposed algorithm were equal to reference values and then calculated the duration of matched records out of the total duration of GPS tracking for each of the 39 participants. That is, accuracy was measured as the percentage of correctly classified records at the unit of time. Of the whole monitoring period, the proposed method correctly class ified 95.84% of raw GPS points into episode values. The time spent in a specific domain (horne, occupational, transportation and other) of physical activity was calculated as·the total time duration of stand ing and walking spent on the unique synchronized event between GPS episodes and activity epochs with location code