speed digital computer as a tool for the analysis of spatial data. ... Spatial data handling software has generally moved from the larger, research-oriented.
12 Computer software for spatial data handling: current status and future developmental needs, by Duane F. Marble and Donna J. Peuquet Geographic Information Systems Laboratory State University of New York at Buffalo, USA
In every discipline one can trace the interaction between the availability of tools and the research problems that are perceived and attacked. Often in an active research area problems are defined and then discarded because of the lack of appropriate tools with which to handle them. A classic example of this can be found in the development of the notion in economics that the interaction patterns of sectors within a national economy can be displayed as a set of simultaneous equations. This idea was originally set forth in the 19th century, but implementation was delayed until the late 1930s when more powerful mathematical tools became available. Even then, input-output analysis did not become a standard analytical tool until high-speed computation equipment became available to handle the large systems of equations that were involved. In the discipline of geography, we have seen a number of similar interactions between tools and problems. Probably the best known of these was the 'quantitative revolution1 which occurred in the late 1950s and early 1960s. At that time, geographers first became aware of the statistical and mathematical tools that had been developed in other disciplines and began to apply them to a variety of problems in spatial analysis. This application of new tools resulted in the development of new conceptual structures which, in turn, demanded further tool development. When tools became inadequate, development shifted to more tractable areas, as evidenced by the burst of interest in Hagerstrand's Monte-Carlo models of spatial diffusion which lapsed when computational restraints were encountered. Another revolution has begun within geography in the past decade, and it is rapidly accelerating. It involves the use of the highspeed digital computer as a tool for the analysis of spatial data. Unlike the quantitative revolution, where geographers came relatively late to the field and spent many years acquiring knowledge about tools that had been developed in other disciplines, this time they were generally ready to use the new computer tools when they became available. The use of the high-speed digital computer in geographic research and practice has parallelled the development of computer applications in many other theoretical and applied areas. During the past decade, several major technological breakthroughs in computer hardware have dramatically reduced the cost of computing while at the same time making it considerably easier to handle massive spatial data sets efficiently. The price of many special peripheral units, such as interactive graphics terminals, has also decreased by more than an order of magnitude in this period and today the user is presented with developments in hardware completely different from what was available a decade ago. The prospects for the next decade are for further massive changes in available technology and substantial decreases in unit costs for handling spatial data. Computer hardware is useless without the software that acts to control its operations. Over the past decade and a half, a substantial amount of computer software has been developed that is applicable to the area of spatial data handling. Much of the available software is merely standard, non-spatial software packages, such as statistical monitors, which have been applied to spatial data. Of far greater interest and concern is the class of computer software that has been developed explicitly for handling spatial data. This includes programs for such purposes as the analysis of two-dimensional point patterns and the production of choropleth maps. In the late 1960s, it became apparent to a small group of geographers that redundancy was developing in the software area and that the increasing number of research workers who were beginning to use computers had no simple means of drawing upon the experience of other workers in this area.
83
Proceedings of the Commission on Geographical Data Sensing and Processing, Moscow 1976
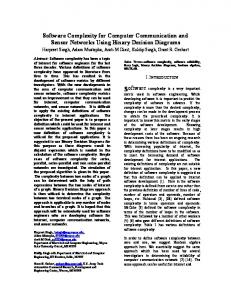
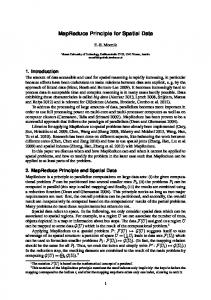
A conference in 1969, sponsored by the National Science Foundation, brought together approximately two dozen geographers with a strong interest in the computer handling of spatial data. As a result of this meeting, a software exchange centre within the discipline was established by a committee consisting of Drs. Duane F. Marble, Waldo R. Tobler and Robert Wittick, Dr. Wittick acted, as he still does, as the Director of the Geography Program Exchange (GPE), which is housed in the Computer Institute for Social Science Research at Michigan State University. The GPE began in the early 1970s to collect computer programs, largely from major academic institutions, and to make them available to other users for nominal fees. Modest support was provided by the Mathematical Social Science Board through the efforts of Dr. Michael F. Dacey, and the GPE has proved to be a successful device for technology transfer within the discipline. Spatial data handling software has generally moved from the larger, research-oriented departments to smaller schools just starting work in this area. At this time, the Commission on Geographical Data Sensing and Processing of the International Geographical Union also became interested in the status of geographic information systems and prepared a major summary of existing operations (Tomlinson, 1972) which dealt with all aspects of these integrated software systems. A geographic information system was defined as a software system which covered all phases of input, storage and manipulation, analysis and display of geographic data. The prime example of an operating geographic information system is the Canada Geographic Information System, which was designed and implemented by Dr. Roger Tomlinson during the mid- and late-1960s. THE SOFTWARE INVENTORY In the early 1970s, an examination of the activities of the Geography Program Exchange made it clear that much redundancy was developing in the production of computer software for spatial data handling. During 1974, the Commission on Geographical Data Sensing and Processing of the IGU conducted a preliminary software inventory to determine how much software was in existence, what its characteristics were and what level of redundancy was developing. The effort was complex because spatial data handling software is produced by academic geographers, practicing planners and operating government departments as well as many other individuals and institutions. As a result of this preliminary investigation, a more comprehensive IGU inventory was supported by the U. S. Geological Survey and carried out from May 1975 to March 1976. The software inventory was performed by a staff under the direction of Dr. Marble and important contributions were made by Dr. Wittick of the Geography Program Exchange, Miss Donna Peuquet, Mr. Carl Reed and Dr. Kurt Brassel of the Geographic Information Systems Laboratory of the State University of New York at Buffalo, and Dr. Sophia Bowlby of the University of Reading in England. Approximately 320 program modules and systems (many of which contained several dozen program modules in themselves) were identified during the inventory and at the time the content of the report was finalized approximately another 36 entries were on hand but not prepared in the standardized format. Since that time well over 100 more items have come to our attention. For the purposes of the Inventory, each software unit was described in a standardized fashion following the program description format shown in Table 1. In a number of cases complete information was not available, but the report covered as many items as it was possible to develop in the time available. The descriptive format adopted represented an attempt to provide complete information about the program and its operations as well as enough technical information to enable a reader to assess the possibilities of transporting the program to his own installation and, if it were transportable, if the conditions of availability were suitable. Figure 1 shows a sample directory entry. Many of the more complex systems required entries that were several pages in length. After completion of the inventory, two additional sources of software information which contained significant numbers of programs concerned with spatial data handling came to our attention. The first and most valuable was a government survey of computer programs in marine science (Firestone, 1976). This extensive directory provides short descriptions of nearly 700 program units, many of which deal with the display of spatial data. Another source of program information which is sure to expand in the future is the Federal Software Exchange Catalog (U. S. Government, NTIS, 1977). This catalog attempts to represent general-purpose software produced by government agencies and made available to other agencies and to the general public at nominal charges in order to reduce the level of redundancy in program production. An examination of the current directory reveals a number of programs dealing with such items as map projections and projection transformations, and as the federal survey progresses more programs of this type will probably be uncovered. Unfortunately, the charges established by the National Technical Information Service are more than nominal. Some of the programs listed in their catalogue are very short (50 or 60 Fortran statements) and are distributed to the user at a charge of $100. The Federal Software Exchange Center also does not identify the source of the programs, so that the potential user does not know which agency and individuals produced the code - an important factor at present in evaluating the utility and validity of any piece of software. (See Figure 2 for the coding form used in this survey.)
84
Computer software for spatial data handling: current status and future developmental needs
Table 1.
Program description format.
IDENTIFICATION
(acronym and extended name of program) PURPOSE (First paragraph is simple, free-text summary. and cover: nature of problem solved method used (if available and pertinent) unusual features range of applicability auxilliary and related programs)
Second and third paragraphs are more technical
PROGRAMMING BASIS/OPERATING INFORMATION Mode of usage: (batch, interactive, real-time, etc., end user or programmer operated) Operative computer(s): (computers on which the program is currently running; computers on which the program should run with little or no modification; comments on transferability) Fast memory and peripherals required: (indicate number of bytes or words and length of word; indicate tapes, disks, terminals, etc.) Programming language(s): Operating system required: (indicate release, options, time-sharing, other) Data files used: (name, description, type of storage, type of geocoding, nature--binary, decimal) Approximate number of source statements: Other remarks: (free text if needed to cover special items) ORIGIN OF PROGRAM Author name and organization: Is program supported: Yes No (support is taken to mean correction of reported errors, etc.) Available documentation: (note all reports, user manuals, indicate whether the listing is published) AVAILABILITY Contact for acquisition and/or additional information: (indicate name, organization, department, complete address, telephone number, telex number) Acquisition conditions: (indicate whether the program is available for distribution to everybody or only to a certain category of users (specify); indicate whether the program is distributed on basis of lease, exchange, free-of-charge, sale, royalty payment on use, subscription fee to a distribution library, handling and mailing charges only; indicate prices) Material available: (write-up(s), source, object, sample input, sample output, binary library, decimal library, overlay scheme, other) Status of release: (indicate whether the distributor performs a test or an evaluation and if updates are available) Utilization conditions: (indicate whether program use is permitted to everybody or only to a certain class of users (specify); indicate prices) DESCRIPTION PREPARED
(name of person preparing and date)
85
Proceedings of the Commission on Geographical Data Sensing and Processing, Moscow 1976
International Geographical Union Commission on Geographical Data Sensing and'Processing HILSHAD:
Automated Relief Shading
PURPOSE This system of programs combines the features of Yoeli's (1965) analytical hill shading with traditional manual relief representation as described by E. Imhof (1965). The light source is adjusted to the relief forms and illumination contrasts are modified according to the elevation of the relief. HILSHAD produces a shading code which may be represented on raster-type display media. The system includes the following routines: (1) interpolation of grid data for shading purposes, (2) computation of direction coefficients for a grid mesh to describe relief forms, (3) hill shading, (4) interpolation procedure to generate intermediate grid lines, (5) procedure to extract specific portions of the grey scale and rotate the grid to produce multicolour plates, (6) display program. PROGRAMMING BASIS/OPERATING INFORMATION Mode of usage: batch, programmer operated Operative computers: IBM 370 Memory and peripherals required: Variable, according to number of data points; minimum 128K, each routine is run separately. Programming language: PL/1 Optimizer Operating system required: full OS Data files used: Input: outlines of major course lines and ridges in various size line records, elevation as regular grid. Various intermediate data sets, all in regular grid files in random access. Output: records of shading codes for each row of representation. Other remarks: The program has been used only for research purposes so far, but may be adjusted for possible users. ORIGIN OF PROGRAM Author name and organization: Kurt E. Brassel, Department of Geography, University of Zurich, Switzerland. Documentation: Brassel, K. , 1973, Modelle und Versuche zur Automatischen Schraeglichlschattierung, Klosters, Switzerland, 116 pages. Brassel, K. , 1974, 'A Model for Automatic Hill-Shading' , The American Cartographer, Vol. 1, No. 1., pp. 15-27. ~~ ~" Imhof, E., 1965, Kartographische Gelandedarstellung, W. de Gruyter & Co. , Berlin. Yoeli, P., 1965, 'Analytical Hill Shading' , Surveying and Mapping, Vol. XXV, No. 4., pp. 573-579 AVAILABILITY Contact for acquisition and/or additional information: Kurt E. Brassel, Department of Geography, Geographic Information Systems Laboratory, State University of New York at Buffalo, Buffalo, New York 14226. Material available: listing, source DESCRIPTION PREPARED Kurt E. Brassel, Geographic Information Systems Laboratory, State University of New York at Buffalo, January 26, 1975.
Fig.
86
1.
Sample directory entry.
Computer software for spatial data handling: current status and future developmental needs
FEDERAL INFORMATION PROCESSING STANDARD SOFTWARE SUMMARY 01. Summary d*t
Tr.
02. Summary prepared by {Name and Phone)
03. Summary action
| Mo. Day
New
O4. Software date
Yr.
t Mo.
Replacement
n
05. Software title
Deletion
a
n
Previous Internal Software ID
Day 07. Internal Software ID
O6. Short title DEL Software type
09. Processing mode
10.
Application area General
Automated Data Q System p] Computer Program PI Subroutine/Module
H
Interactive Batch
I—I Combination
Computer Systems Support/Utility Scientific/Engineering
Spedftc Management/ Business Process Control Other
BibIiographic/TeJCtu»I
II. Submitting organization and address
12. Technical contact(s) and phone
13. Narrative
14. Keywords
15. Computer manuf'r and model
16. Computer operating system
17. Programing language(s)
18. Number of source program statements
19. Computer memory requirements
20. Tape drives
21. Disk/Drum unit!
22. Terminels
23. Other operational requirements
24. Software availability Available
D
25. Documentation availability Limited
D
In-house only
D
Available
D
Inadequate
D
In-house only
n
6. FOR SUBMITTING ORGANIZATION USE
185-101
Fig. 2.
Standanf Form ItS 1974 July U.S. DmpL of Commerce—NBS (FIPS. Pub. 30)
Coding form used for the Federal Software Exchange survey.
87
Proceedings of the Commission on Geographical Data Sensing and Processing, Moscow 1976
RESULTS OF THE IGU INVENTORY
In order to establish some method of organizing the program descriptions produced in the software inventory, a classification system was developed with five major categories and a variable number of subcategories within each major class. The major classifications are: - full geographic information systems - data manipulation programs - data analysis programs - display and mapping programs - supporting programs Subcategories were used in nearly all cases to develop a finer classification. For example, within category 4. 0 (Display and Mapping Programs) we see such subcategories as 4. 6 (Grid Mode Shading Programs) and 4. 7 (Vector Mode Shading Programs). The full set of categories and subcategories is given in Table 2 together with a count of the number of descriptive entries within each of them. It should be emphasized that the numbers given in Table 2 represent not the actual counts of programs, but rather those of identifiable software modules, some of which consist of a large number of programs and subroutines. For example, within the Display and Mapping Programs section there is an extry for a subroutine package (CARTSUB) developed by Professor Douglas of the University of Ottawa which contains more than 40 subroutines. Also, in the section on Full Geographic Information Systems, there are a number of very large systems which perform mearly all the operations listed in the other sections and which may, as in the case of the Canada Geographic Information System (CGIS), have more than 100,000 lines of code. Table 2.
Software directory entries
Section
Description
No. of entries
1.0
Full Geographic Information Systems
22
2.0
Data Manipulation Programs 2. 1 Arc and Segment Handling (9) 2. 2 Arc to Polygon (3) 2. 3 Computation of Polygon Measures (1) 2.4 Polygon Manipulation (9) 2. 5 Data Generalization and Parsing (15) 2. 6 Digital Image Processing (3) 2. 7 File Conversion and Miscellaneous Operations (2)
42
3.0
Data Analysis Programs
58
3. 1 Spatial Statistics (17) 3. 2 3. 3 3. 4 3. 5 4.0
Network Models and Measures (19) Demographic Models and Indices (8) Location-Allocation Models (7) Other Models and Measures (7)
Display and Mapping Programs 4. 1 General Display Systems (14) 4. 2 Data Preparation, Digitizing and Editing (11) 4. 3 Basic Drafting Operations (10) 4. 4 Diagram Display (13) 4. 5 Display of Point and Line Features (25) 4. 6 Grid Mode Shading Programs (18) 4. 7 Vector Mode Shading Programs (15) 4. 8 Contouring Programs (17) 4. 9 Three-Dimensional Representation (26)
169
4. 10 Map Projections, Transformations and Distance Measures (13) 4. 11 Miscellaneous Cartograms (7) 5.0
88
Supporting Programs 5. 1 Data Base Management (21) 5. 2 Sort Utilities (3) 5. 3 General Statistical Packages (7) 5.4 Miscellaneous Utilities (2)
33
Computer software for spatial data handling: current status and future developmental needs
The inventory identified more than 320 software modules and the report describing these modules, following the format shown in Table 1, is slightly more than 700 single-spaced pages long. The information contained in the inventory was also prepared in a machine-readable format designed for use with the TRIAL bibliographic retrieval system developed by the Vogelback Computing Center of Northwestern University. Nearly two-thirds of the software modules identified in the inventory involved some type of map or graphic display activity and many of the routines were directly oriented toward providing specialized graphic output of spatial data. An extensive analysis of these display and mapping routines has been prepared by Brassel (1977) and their characteristics are very similar to those of the total body of routines contained in the inventory. A great majority of the routines were designed for batch operation, with a surprisingly small proportion oriented toward interactive operation and particularly toward interactive computer graphics. Most programs were originally prepared for use on IBM machines, and nearly two-thirds of those identified were coded in Fortran. A number of the program modules were prepared in machine assembly languages, reflecting the user's need for speed and efficiency in spatial data handling. Most of the routines identified came from university and government sources in North America and Western Europe. The size of the programs ranged from a few dozen statements to, in one case, more than 120,000 statements, and nearly 10% of the entries in the inventory contained more than 2,000 statements. No attempt was made to provide an evaluation of the programs entered in the inventory, because of the limited time and resources available. There are also serious conceptual problems involved, as was pointed out by Hetzel (1973), in establishing the criteria for evaluating a specific piece of software. In many cases these criteria cannot be established without a specific context of use in mind. Further work needs to be done by individuals and organizations interested in spatial data handling to establish viable test criteria in this area. The inventory contained entries for a few program modules of non-spatial orientation. These fell into two classes: statistical analysis packages and sort/merge packages. The former were included because of their widespread use by spatial analysts and the fact that investigators frequently use one package without knowing of the existence of many others with similar characteristics. The sort/merge packages were included because it became apparent toward the end of the inventory effort that sorting operations formed a major item of overhead in many spatial data handling applications. In some cases, users of full geographic information systems reported that as much as 15 to 18% of total computation time was spent using the sort/merge package. Many program modules handled sorting activities through locally developed packages with rather simple algorithms. For this reason, some of the main commercially available sorting packages were identified to assist users with problems in this area. FUTURE DEVELOPMENTAL NEEDS Although the inventory revealed considerable redundancy in the development of program modules for spatial data handling (the seemingly endless contouring routines are a good example of this), it also disclosed a number of gaps and weak areas. Brassel (1977) points out that in the display and mapping area there are a number of neglected cartographic problems, including generalization of non-line features, co-ordination of multiple map elements in an automated environment, text and symbol placement and the Dasymmetric mapping. Other areas of identifiable concern include algorithm identification, data structures and the potential use of data-base management systems. Spatial data handling algorithms As has been pointed out by Knuth (1973) and other authors such as Aho et al. (1974), the fundamental basis of any computer software must be an explicit algorithm and these algorithms must, in turn, meet certain well-defined criteria. The algorithms employed for spatial data handling represent the heart of any computerized spatial data system, and their characteristics largely determine the speed and accuracy of the processes involved. An unfortunate selection of an algorithm may lead to an unworkable or uneconomical program, or, even worse, a program that works but produces incorrect results. In many fields, such as numerical analysis, the exposition and analysis of algorithms is a well-developed area of scientific investigation. Unfortunately this is not true in geography or other areas concerned with spatial data handling. Discussions of some algorithms can be found (Brassel, 1975; Davis,1975), but there is no well-defined reference series to which the spatial analyst may turn to find an appropriate algorithm for the specific task in hand. An analyst who is interested in spatial interpolation, for example, must search through an enormous body of literature covering areas ranging from geophysics to image processing in order to determine what algorithms are available, and to evaluate their relative advantages and disadvantages. In some areas, such as digital image processing, algorithm discussions are relatively well developed and are even set forth in standard texts; that of Rosenfeld and Kak (1976) is a good example. The only unified discussion of spatial data handling algorithms is a report on point-in-polygon procedures that was prepared by Ferguson (1973) but which was never formally published. This extensive report
89
Proceedings of the Commission on Geographical Data Sensing and Processing, Moscow 1976
discusses the use of point-in-polygon procedures, examines each of the approaches from both a mathematical and a computational standpoint, and presents a series of Fortran subroutines covering each of the algorithms. Regrettably, similar algorithm surveys and evaluations are not available for areas such as polygon overlay. To take the case of polygon overlay operations, recent surveys and detailed case studies of geographic information systems such as those presented by Tomlinson (1972) and by Tomlinson et al. (1976) indicate that a number of operating geographic information systems carry out polygon overlay operations. The systems use different approaches to the solution of this problem and achieve different results in terms of accuracy, economic viability, and other criteria. Nowhere, however, is there a presentation of the algorithmic basis for the operation of any of these systems. The only known expositions of many of these algorithms are contained within the software modules themselves and can be extracted only through an examination of the code. This procedure is tedious and costly and reflects the paucity of documentation of many systems. It is strongly recommended that an effort be made to identify and evaluate many of the basic algorithms used for spatial data handling. Until very recently, many geographic journals have been reluctant to publish material dealing with computer algorithms. The recent effort by Dr. Richard Baxter to establish an algorithm section in the journal Environment and Planning is highly commendable. Data structures Many of the program modules identified in the inventory assume that spatial data are presented in a relatively straightforward, sequential format... As the size of spatial data files increases, the organization of the data becomes more critical in terms of both basic computational speed and economic viability. Most spatial data consist of two classes of information: image data and attribute data. Image data is the term normally used for the co-ordinate information itself; an example is a string of spatial co-ordinates which comprises the outline of the State of New York. Attribute information generally consists of aspatial data pertaining to the spatial entity in question; for example, the population figure associated with the State of New York. Most of the program modules identified in the inventory treat image data as existing in logical point, line and area form. This is what is traditionally known as 'vector' format where a line is stored as a series of co-ordinates. This approach has fairly well matched some of the standard input procedures, such as the line-follow ing capabilities of a digitizer table arid the line-drawing abilities of many plotters. An alternative data structure, which is present in very few of the program modules identified in the inventory, is one in which the image data are organized in a 'raster' format where the image data set, instead of being organized on a logical line basis, is organized on the basis of the intersections between a horizontal raster scan line and all the lines that are cut by that scan line. Needless to say, algorithms designed for use with vector data structures are generally inappropriate when the data are organized in raster form. This problem extends and amplifies the problem identified above of identifying and evaluating spatial data handling algorithms. Few of the programs identified in the inventory, other than the full geographic information systems, used anything other than simple, sequential, vector data structures. Serious investigations are needed to explore the relative utility of vector and raster organizations of spatial data and to identify the situations in which each of these approaches is most suitable. Data base management systems There are many problems associated with the efficient handling of large quantities of data. Many commercial and governmental organizations face this problem on a day-to-day basis in their manipulation of aspatial data sets, some of which are very large and are embedded in systems requiring rapid response times (for example, airline reservation systems), Over the years, a series of specialized software packages known as data base management systems (DBMS) have been developed to assist in the management of these large data sets (see, for example, Tsichritzis and Lochovsky, 1977). One of the authors (Peuquet, 1977) has argued that a DBMS adapted to the handling of spatial data should be an essential subsystem incorporated within a geographic information system. A number of interesting methodological problems are raised by this approach. Standard DBMS practice requires users to identify both the entities that are being manipulated and the types of relationships that are to be defined as existing between the entities. The entities in most spatial data handling situations have been defined as points, lines or areas, or combinations of the three. Problems arise in using standard DBMS technology because of the large volumes of image data usually associated with these entities, and because many spatial retrieval criteria involve computational operations - not normally part of DBMS procedures - on the image data set (such as retrieval of the polygons that lie within 'x 1 distance units of the centroid of a given polygon). The methodological problems are compounded when addressing the question of relationships. Most existing data base management systems assume that the relationships between entities are explicit and clearly defined, such as hierarchical relationships existing between entities. Many spatial relationships that are important to spatial analysts are vague ones, such as 'above' or 'to the left of. These relationships vary according to relative position in space. Implementation of these relationships within a data 90
Computer software for spatial data handling: current status and future developmental needs
base management structure is difficult at present and it is not certain whether the situation is one in which the entities and relationships are adequately specified from the user's standpoint and DBMS technology is inadequate, or one in which geographers and other manipulators of spatial data have produced a set of vague concepts and this lack of concise definitional structure is preventing the use of modern DBMS technology. CONCLUSIONS An examination of computerized spatial data handling in geography and related disciplines concerned with space- and time-dependent data leads us to conclude that once again we are dealing with the S-shaped curve of innovation diffusion. For the past decade computerized spatial data handling has been growing relatively slowly and in a decentralized manner, with individual researchers 'reinventing the wheel 1 again and again. There is no comprehensive attack upon the problems inherent in computerized spatial data handling, nor have there been any adequate educational programs to train users in this area. Only within the past few years have we begun to see the production of texts (Baxter, 1976; MacDougal, 1976) and the introduction of explicit graduate training programs such as the one at Buffalo. The lower inflection point on the adoption curve has finally been passed. As a result, the next decade will see an extremely rapid acceleration of work in this area and hence the involvement of more and more research workers and the development of more comprehensive investigations into the problems of spatial data handling and the production of viable computer software.
REFERENCES Aho, Alfred V. , Hopcroft, John E. and Ullman, Jeffrey D. 1974. The design and analysis of computer algorithms. Addison-Wesley Publishing Co. , Reading, Mass. Baxter, Richard S. 1976. Computer and statistical techniques for planners. Methuen & Co. Ltd. , London. Brassel, Kurt. 1975. 'Neighborhood computations for large sets of data points' , in Auto-Carto II, Proc. of the Second International Symposium on Computer-Assisted Cartography, pp. 337-345. Brassel, Kurt. 1977. A survey of cartographic display software. Report R - 7 7 / 3 , Geographic Information Systems Laboratory, State University of New York at Buffalo. Davis, John C. 1975. 'Contouring algorithms', in Auto-Carto II, Proc. of the Second International Symposium on Computer-Assisted Cartography, pp. 352-359. Ferguson, Helaman R. P. 1973. Point in polygon algorithms. Technical Report, Urban Data Center, University of Washington, Seattle. Firestone, Mary A. , ed. 1976. Computer programs in marine science. Key to Oceanographic Records Documentation No. 5. National Oceanographic Data Center, Washington, D. C. Hetzel, William C. , ed. 1973. Program test methods. Addison-Wesley Publishing Co. , Reading, Mass. Knuth, Donald E. 1973. Fundamental algorithms, 2nd edition. Addison-Wesley Publishing Co. , Reading, Mass. MacDougal, E. Bruce. 1976. Computer programming for spatial problems. Edward Arnold Ltd. , London. Marble, Duane F. , ed. 1976. Computer software for spatial data handling. Report prepared by the IGU Commission on Geographical Data Sensing and Processing for the U. S. Geological Survey under Grant No. 14-08-0001-G-215. Peuquet, Donna J. 1977. 'Raster data handling in geographic information systems', forthcoming in Proc. Symposium on Topological Data Structures for Geographic Information Systems. Rosenfeld, Azriel and Kak, Avinash C. 1976. Digital picture processing. Academic Press, Inc. , New York. Tomlinson, Roger F. , ed. 1972. Geographical data handling (2 volumes). IGU Commission on Geographical Data Sensing and Processing, Ottawa. Tomlinson, Roger F. , Calkins, Hugh W. and Marble, Duane F. 1976. Computer handling of geographical data. The Unesco Press, Paris. Tsichritzis, Dionysios C. and Lochovsky, Frederick H. 1977. Data base management systems. Academic Press, Inc. , New York. U. S. Government, National Technical Information Service. 1977. Federal software exchange catalog. GSA/ADTS/C-77/2. Federal Software Exchange Center, Springfield, Va.
91
*
S
s
JF
/ / / /
s
s
^
^
^
^
^
^
/
"
/
"
^
// / /
"zffi&F
"*^w
"*ass*
"SSB*
'^^:
*^^"
"^s^^
*«ffl3f'
PfcK^e^cfin^s '%i$
5 1
*%0P
%sJi?
%J?
%a^f^|j^
of th^ Commission O OOOOOOOOOC O O OO
O 00
on Geoeraghicm Data ana rrocessine «•>,
O O y
y
..-::;=•:,
-!"n':..,
^-!«!-i-.
Jr^
\«i^'
U
R. P. TdhilinBri / / / / /
tf% ^%
O
O
|f%
of the International Geographical Union
/ '"
^-
^
*,
^
Preface
In conjunction with the 23rd International Geographical Congress held in Moscow in 1976, the Commission on Geographical Data Sensing and Processing of the International Geographical Union held a three-day technical meeting. Its object was to review recent developments in the gathering and handling of geographic data, particularly the development of geographic information systems and their use as a basis for regional and national planning. As the meeting was held in Moscow, the participation of Soviet scientists was substantial and particular attention was focussed on recent developments of computer-aided geographic information systems in USSR. Instantaneous translation was provided and a full and free discussion followed the presentation of each paper. The sessions were most fruitful, from the points of view both of information exchanged and of communication between the institutions and nations represented by individual participants. It became clear that techniques are developing swiftly, but in different directions and with different emphasis in different nations. Notably, two contributions from Soviet linguists brought a new approach to problems of earth description. This work has since spurred efforts in the design of data base management systems for spatial data in North America and has been the focus of three IGU-sponsored meetings on the topic in 1976 and 1977. This exchange of views is surely the purpose and essence of international scientific activity and was well exemplified at the IGU Moscow meeting. The Commission owes an immense debt of gratitude to Dr, I. S. Garelik of the Institute of Geography, USSR Academy of Sciences, for his work on its behalf as local organizer. He made an outstanding contribution to the entire program. His scientific skill, persuasive capabilities and administrative talent were brought to bear on all the problems that an international meeting can produce, and he solved them with calm efficiency and gentle humour. Dr. Garelik was aided by Dina Selifonova. The financial assistance essential for Western scientists to travel to the Congress was provided by the Division of Earth Sciences, Unesco, Paris (contract SC/RP 250. 890). This allowed far broader participation in the meeting than would otherwise have been possible and directly contributed to its scientific worth and richness of discussion. Moreover, the Unesco Division of Earth Sciences in Paris provided funds for the publication of these papers. Dr. K. Lange of Unesco, Paris, also contributed much time and patience to verifying the translation and editing of the texts of Soviet authors, a task which only those who have shared in international correspondence and translation can appreciate, but from which all the readers will benefit. The profession of geography as a whole must acknowledge a deep debt to the Division of Earth Sciences at Unesco for their continuing and valuable support to scientific inquiry in this rapidly developing field of geographic data handling. Dr. Lange has recently returned to USSR after a five-year tour of duty at Unesco. On behalf of geographic colleagues in many nations, it is appropriate to express our appreciation for his calm counsel throughout his years at Unesco and to extend our invitation for strong co-operation with Soviet scientists in future work. Finally, and on behalf of all members of the Commission and all the authors, I must extend thanks to Jocelyn Farrand and Lila Blanchard, who have been in control of all aspects of the editing and production of these proceedings. R. F. Tomlinson Ottawa, 1977
Contents
1.
2. 3. 4. 5.
6.
7.
8.
9. 10. 11.
12.
13.
Measurement of the elevation of the snow line on satellite images to study snow cover distribution in mountains, by I. S. Garelik, A. M, Grinberg, and A. N. Krenke
7
Land use grid data from ERTS multispectral space imagery, by Hosoi Shosuke
15
Detection of underground water and related phenomena by means of space photographs, by I. K. Abrosimov, G.I. Belchanskiy, E. A. Vostokova and M. E. Solomatin
19
Multispectral space images: Material to study shallow water areas, by V.I. Kravtsova
27
New information on the relationships between vegetative cover and soil thermal regime, obtained by use of remote sensing devices, by Ferdinand J. Bonn
35
Quality of space photographs for interpretation of aeolian relief,
by Y. Yermakov
41
Some questions on the application of multispectral space images in geographic investigations, by K. Ya. Kondratyev, A. A. Buznikov, O. B. Vasilyev, Al. A. Grigoryev and G. A. Ivanyan
43
Technical facilities for collection and input of geographic data into electronic computers, by V. I. Korobov, A. B. Muhamedjanov, L. I. Orlov, M. K. Polshkov, G. P. Shivanov a n d E . E . Shiryaev
45
Automatic line digitization, by A. R. Boyle
53
Computerized processing of large amounts of meteorological data, by G. V. Gruza and R. H. Reitenbach
63
Estimation from grid data: The map as a stochastic process, by Michael F. Goodchild and Wai-See Moy
67
Computer software for spatial data handling: Current status and future developmental needs, by Duane F. Marble and Donna J, Peuquet
83
Information system developments in North America, by Hugh W. Calkins
93
14.
15.
16. 17.
Principle of construction of ASGPS - GEOGRAPHY , a single automatic system for gathering, processing and storing geographic information, by E.E. Shiryaev
115
Some aspects of creation and functioning of automated geographic information systems,
by A, S. Vasmut
121
Information systems in regional planning, by N. F. Timchuk and V. A. Lihvar
129
Roles of remote sensing applications and geographic information systems in national development 1976-1980, by R. F. Tomlinson, D. S. Simonett and D. Steiner
133