James W. Duda .... Charles 1997) provide guidelines for designing and ... Family C/O = 15 minutes. MTTF = N/A. MTTR = N/A. Pallet. R R R R. P P P P. OP 60.
Proceedings of the 1998 Winter Simulation Conference D.J. Medeiros, E.F. Watson, J.S. Carson and M.S. Manivannan, eds.
SIMULATION AND PRODUCTION PLANNING FOR MANUFACTURING CELLS David S. Cochran James W. Duda Jochen Linck
Shahram Taj University of Detroit Mercy College of Business Administration Detroit, MI 48219-0900, U.S.A.
Massachusetts Institute of Technology Department of Mechanical Engineering Cambridge, MA 02139, U.S.A.
one part to go through the entire process) and elimination of the need to repeatedly sort the parts within the process. The conversion to a lean cellular manufacturing system could help improve quality, eliminate waste, and reduce total costs. An ideal, lean cell (shown schematically in Figure 1) would have all machines needed to process a part located very close together, single-piece flow of parts between operations, and operators running multiple machine types. Such a system would improve the ability to trace defects back to the machine that caused them and would eliminate nearly all of the transportation and storage of parts between operations.
ABSTRACT Simulation is used to verify the feasibility of the design of manufacturing cells. The cell design, which combines new and existing machines in a component manufacture, is presented, showing the difficulties that can result with such a system. Simply changing the layout (arranging machines into cells) could provide some benefits, but these benefits were offset by a high level of required investment. The reasons for the increased costs include poorly matched cycle times, machine downtimes, complex material handling and long changeovers. Improvements in machine and material handling designs were found to be necessary in order to increase cell performance and reduce investment to a feasible level.
Station 4
Station 5
1
INTRODUCTION
Worker 1
Station 6
The purpose of this study is to show how simulation can be used to examine the feasibility of converting an existing system to a cellular manufacturing system at a component manufacturer for a major automotive company. An existing manufacturing system was already in place and had been operating for several years. The original motivation for redesigning the existing system was the need to upgrade some of the operations. Several of the machines in use were rather old (up to 40 years old) and management desired to replace the old equipment with machines using more modern technology (CNC) to reduce cost and ensure better part quality. Because some areas of the factory would require significant changes in terms of layout and material handling when the machines are replaced, this was seen as a potential opportunity to redesign the entire system to improve efficiency and eliminate waste. It was also desired that the new system be designed with as much volume and product mix flexibility as possible, as the factory is facing increased diversity and uncertainty in demand for its products. Other specific goals included the reduction of throughput time (defined as the time it takes
Station 7
Out
Part flow
Station 3
Station 2
Worker 2
Station 1
In
Operator
Station 2
Machine
Figure 1: Lean Manufacturing Cell 1.1 Product Information The product being manufactured at this factory is a matching set consisting of one part called P and one part called R for use in a sub-assembly. The existing system produces these parts in five different sizes (or families) with 2-7 ratios per family for a total of about 20 different varieties of sets. Total production volume of the system is approximately 11,000 sets per day, or about one set every 6 seconds. A typical R part is about 9 inches in diameter, 2.5 inches thick, and weighs about 15 lbs. A typical P part is about 8 inches long, 4 inches in diameter, and weighs about 8 lbs.
973
Taj, Cochran, Duda and Linck cellular system significantly more complex (Wemmerlöv and Johnson 1997). Specifically, in this case we will see that issues of machine design and reliability as well as material handling become critical in designing a successful cellular system. Much less literature exists relating these problem areas to cell design, although some work has been done showing the importance of machine reliability and maintenance (Kelly et al. 1997, Banerjee and Flynn 1987, and Flynn 1989). As more and more implementation factors become important, the problem of cell design becomes more and more difficult to study analytically, and research tends to focus more on developing guidelines to help designers make good decisions where there is a lack of scientific analysis. Studies such as (Edwards 1996 and Charles 1997) provide guidelines for designing and developing “lean” cellular systems that will be able to meet a factory’s requirements.
1.2 Existing Manufacturing System The existing system has a departmental, process layout, with machines grouped by operation (i.e., all OP 40 machines are located together in one area) rather than by product flow. The existing machines were originally selected so as to optimize performance in each department (machine utilization, uptime, low operating costs, etc.). Buffers, in the form of tubs full of parts, are kept between some subsequent departments. Tubbing parts has the advantage of keeping the parts sorted by ratio, but it also results in increased inventory, increased throughput time (the tubs are not transported to the next department until they are full) and the need for fork-truck drivers to move the tubs around. In other cases, parts are manually loaded to and from an overhead conveyor running from one department to the next. The use of such conveyors reduces inventory and material handling, but since only one conveyor is used, the parts get mixed up and operators at the downstream department often have to search the conveyor to find the right part. 2
3
CELL DESIGN
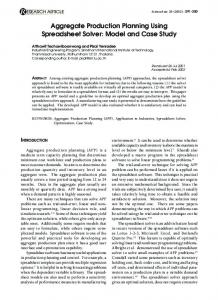
We began by first determining the number of machines to be included for each operation, i.e., how to balance the cycle times of the machines in the cell. This proved to be a difficult problem, as the existing machines had a wide range of cycle times, ranging from 6 sec/part for the fastest operation all the way up to over 200 sec/part for the slowest. The ideal case would be for each cell to contain exactly one of each machine for each operation (so that each part passing through the cell would go through each machine), thus providing a very simple and clear material flow. Since, for example, OP 50 currently requires 14 machines running in parallel this would mean that there would have to be 14 cells, and 14 of each type of machine. However, the fastest operation, OP 20, currently requires only 3 machines, which would mean that an “ideal” cellular layout would require the purchase of 11 new machines for this operation. A number of alternative cell concepts were examined and from these, a medium sized cell was selected for further investigation. A schematic of this cell is shown in Figure 2, showing the general layout including the number of machines for each operation (8 machines for OP 60 for example). Figure 3 shows the operator standard work chart for a medium sized cell.
LITERATURE REVIEW
Although a fairly large body of research exists on group technology and lean manufacturing, the situation described above was found to be somewhat unique relative to the literature in terms of cell design and evaluation issues. Most previous work in these areas falls into one of two main categories. On the one hand, there are several books presenting high-level ideas and concepts regarding how to design a “lean” manufacturing system (Ohno 1988, Monden 1983, Shingo 1989, Womack 1997, etc.) On the other hand, several studies have also been done to examine a few very specific issues involved in designing a cellular system. Several articles have been written on cell design techniques (e.g. Beaulieu et al. 1997, Christy 1986, Greene and Sadowski 1984, and Rajagopalan and Batra 1975), but such studies generally treat the cell design process purely as the selection and grouping of machines into cells. In the case presented here the grouping of machines is very simple, as all parts require the same operations regardless of family and ratio. Consequently, each cell must contain at least one of each type of machine, regardless of what family of parts it is to produce. The only factor preventing each cell from making each part type (each combination of family and ratio) would be long changeover times on some of the machines. In some cases (see Levasseur et al. 1995, for example) simply rearranging existing machines into a cellular configuration is sufficient to provide significant benefits such as reductions in inventory, throughput time, scrap, labor, and floor space. In many other cases, several other implementation issues arise that making the switch to a
974
Simulation and Production Planning for Manufacturing Cells 4.1 Modeling OP 20 Cycle = 6 sec. PCs/Cycle = 1 Family C/O = 15 minutes MTTF = 286 hours MTTR = 2.69 hours
Part P
OP 30
The new cell design was modeled in Witness. The LABOR element in Witness is used to represent the operator. In Witness, LABOR is a resource like a human operator or tools which may be required by other elements for processing, setting up, repair or loading. It should be noted that LABOR in Witness is not an active element, it can not pull/push part or walk from station to station. To model walking or removing parts, another type of Witness element, MACHINE is used. These dummy MACHINES then use LABOR. To control the movement of operators and prevent them from bypassing stations an ATTRIBUTE called position was assigned to them. When the simulation starts, the operator position is zero. For Operator Task 1 (Figure 3) a dummy MACHINE pulls two part R from tub. An operator with position zero is required for this machine during the cycle time. At the end of cycle, the operator's position is set to 1. Walking to part P loading station and taking two P parts from tray and walking to OP20 (Task #2) is modeled using another dummy MACHINE needing the operator with position 1. This dummy machine can only cycle when it obtains the operator with the proper position. At the end of the cycle, the operator position is then set to 2. Other operator tasks are modeled in the same fashion except for Task #5. In Witness a MACHINE can cycle when it has obtained all its needed PARTS and LABORS. In Task #5, the operator loads parts to cooling buffer and then walks without parts to pallet loading station. In this case, there are no parts for operator to carry. To model this walking with no parts, a dummy MACHINE needing the operator (with proper position) is used to model the walk that pulls a dummy PART. After operators finishes Task #6, its positionattribute is then reset to zero.
Part R
Cycle = 45 sec. PCs/Cycle = 4 Family C/O = 30 minutes MTTF = N/A
Operator work loop OP 10
OP 40
Cycle = 15 sec. PCs/Cycle = 1 Family C/O = 15 minutes MTTF = N/A MTTR = N/A
Cycle = 22 sec. PCs/Cycle = 1 Family C/O-New = 15 minutes Family C/O-Old = Major MTTF-New = 559 hours MTTR-New = 1.90 hours MTTF-Old = 40 hours MTTR-Old = 4 hours
OP 50
OP 50
Cycle = 45,50,75 sec. PCs/Cycle = 1 Family C/O = 4 hours MTTF = 20.31 hours MTTR = 2.77 hours
Pallet RR RR PPPP
OP 60
Gantry Machine Load/Unload = 45 Sec MTTF = 29.22 hours MTTR = 1.31 hours
OP 60
Cycle = 180, 200 sec. PCs/Cycle = 1 pair Family C/O = 4 hours MTTF = 216 hours MTTR = 8 hours
OP 60
OP 60
OP 60
OP 60
OP 60
OP 60
Figure 2: Schematic of a Medium Sized Cell Layout 4
SIMULATION ANLYSIS
Simulation analysis was used to verify the cell design in terms of production feasibility. Process flows, actual and estimated cycle times, change over times, maintenance repair data, machine downtimes, and work patterns were used for the foundation of the simulation model. Standard work charts detailing the required operator activities were also developed.
975
Taj, Cochran, Duda and Linck
PART: 2 sets of R + P Operators: 1 PROCESS TIME (secs) # Man Walk Auto OPERATION 1 OP 10 8 6 30 2 2 3 0 3 OP 20 18 5 12 4 OP 30 15 4 23 5 OP 40/50 4 1 25 6 OP 60 25 7 25
20
40
60
80
100
120
# Operator Tasks 1 Take 2 part R from tub and load into OP 10 [8 sec.] Walk to part P loading station [6 sec.] 2 Take 2 P parts from tray [2 sec.] Walk to OP 20 [3 sec] 3 Unload/load (2 P parts) OP 20 [18 sec.] Walk to OP 30 [5 sec.] 4 Unload/load (2 P parts) OP 30 [15 sec.] Walk to cooling buffer input [4 sec.] 5 Load 2 P parts to cooling buffer input [4 sec.] Walk to pallet loading station [1 sec.] 6 Load 2 P parts and 2 R parts pallet [25 sec.] Walk to part R loading station [7 sec.]
Figure 3: Standard Work Chart for a Medium Sized Cell Run by One Operator one P and one R to each machine. When it reaches the end of the row the pallet leaves the cell to go to other operations (later the empty pallet returns). We have used VEHICLE and TRACK elements in Witness to represent the Gantry and its pathways and speed. A shortcoming of using VEHICLE to represent Gantry is modeling the downtime. In Witness, the VEHICLE does not break down. A dummy MACHINE is used to model up-time and downtime for Gantries. During the downtime, the Gantry is pushed into a dummy TRACK and it stays there until the dummy machine is repaired. To meet forecasts of future volume, seven cells are required. Each was modeled in a similar way. All downtime and repair times were modeled using appropriate statistical distributions with different pseudo-random number streams.
When the simulation starts, the operator position is zero. For Operator Task 1 (Figure 3) a dummy MACHINE pulls two part R from tub. An operator with position zero is required for this machine during the cycle time. At the end of cycle, the operator's position is set to 1. Walking to part P loading station and taking two P parts from tray and walking to OP20 (Task #2) is modeled using another dummy MACHINE needing the operator with position 1. This dummy machine can only cycle when it obtains the operator with the proper position. At the end of the cycle, the operator position is then set to 2. Other operator tasks are modeled in the same fashion except for Task #5. In Witness a MACHINE can cycle when it has obtained all its needed PARTS and LABORS. In Task #5, the operator loads parts to cooling buffer and then walks without parts to pallet loading station. In this case, there are no parts for operator to carry. To model this walking with no parts, a dummy MACHINE needing the operator (with proper position) is used to model the walk that pulls a dummy PART. After operators finishes Task #6, its positionattribute is then reset to zero. The pallet containing four pairs of parts P and R is released to OP60. Two Gantries move pallets to two rows of 4-machines (Figure 2). The Gantry unloads/load a set of
4.2 Simulation Run Simulated manufacturing cells were executed to study the feasibility of the proposed manufacturing cells for production in a Just-In-Time (JIT) environment. The future volume of about 77,000 pairs of P and R per week with a complexity (mix) of 33 different types was used as a
976
Simulation and Production Planning for Manufacturing Cells the requirements of a cellular system: fast changeover, good operator access, high reliability, cycle times matched to customer takt time, etc.
schedule for the cells. The cell performance was to meet customer volume and mix requirements on a daily basis. The model was run for 10 weeks. A series of matrices was generated to show the status of production for every parttype for every day of the run and the production hours required for every cell. From these matrices, descriptive statistical analyses are easily performed.
REFERENCES Banerjee, A., and B.B. Flynn. 1987. A simulation study of some maintenance policies in a group technology shop. International Journal of Production Research 25:1595-1609. Beaulieu, A., A. Gharbi, and Ait-Kadi. 1997. An algorithm for the cell formation and the machine selection problems in the design of a cellular manufacturing system. International Journal of Production Research 35:1857-1874. Charles, M.D. 1997. the impact of machine and cell design on volume flexibility and capacity planning. Master's thesis, Massachusetts Institute of Technology. Christy, D.P., and U. Nandkeolyar. 1986. A simulation investigation of the design of group technology cells. In Proceedings of the Decision Science Institute, 12011203. Edwards, D.K. 1996. Practical guidelines for lean manufacturing equipment. Production and Inventory Management Journal 2:51-55. Flynn, B. 1989. Critical machines preventive maintenance policies for group technology shops,” International Journal of Production Research. 27:2009-2020. Greene, T.J., and R.P. Sadowski. 1984. A review of cellular manufacturing assumptions, advantages and design techniques. Journal of Operations Management 4:85-97. Kelly, C. M., C.T. Mosier, and F. Mahmoodi. 1997. Impact of maintenance policies on the performance of manufacturing cells. International Journal of Production Research 35:767-787. Levasseur, G.A., M.M. Helms, and A.A. Zink. 1995. A conversion from a functional layout to a cellular manufacturing layout at Steward, Inc. Production and Inventory Management Journal 36:37-42. Monden, Y. 1983. Toyota production system. Norcross: IIE Press. Mosier, C.T., D.A. Elvers, and D. Kelly. 1984. Analysis of group technology scheduling heuristics. International Journal of Production Research 22:857-875. Ohno, Taiichi. 1988. Toyota production system: beyond large scale production. Cambridge: Productivity Press. Shingo, Shigeo. 1989. A study of the Toyota production system from an industrial engineering point of view. Cambridge: Productivity Press. Witness. 1997. Version WIN-307, Release 8.30, Lanner Group. Wemmerlöv, U., and D.J. Johnson. 1997. Cellular manufacturing at 46 user plants: implementation
4.3 Findings The simulation results showed that not all part types can be produced in a JIT environment due to long set ups and downtimes. In order for a cellular system to be feasible, it was clear that certain improvements in the equipment would have to be made. For example, current changeover times are as long as 4 hours or more for some operations. Although most cells would be dedicated to a particular family of parts, one or two cells would be required to produce multiple part types. Poor reliability (uptimes of approximately 70%) was also a problem for the cellular system as well as the current system, and efforts were already underway to reduce unplanned downtime in these problem areas. Several other less obvious problems were identified as well. Because most of the machines were designed with a mass-production mentality, they presented a variety of impediments to the formation of cells. Some machines were very large and this resulted in long walking distance for operators expected to run multiple machines. Had the machines been designed with a cellular layout in mind, they clearly could have been improved in this regard. Another problem with some of the particularly large machines is that they require a special concrete foundation, resulting in a tremendous amount of work being required to relocate the machines. Plant management has recently placed an emphasis on purchasing only machines that can be moved more easily in recognition of the fact that layouts are always changing, but a number of the older machines do not meet these new standards. 5
CONCLUSIONS
This paper reviewed the investigation of creating a cellular system design at a factory with a mass production-type system currently in place. Although the manufacturing process is ideal for a cellular system in some ways (all parts require the same sequence of operations, for example) it was extremely difficult to design a feasible system due to the constraints imposed by the existing equipment. Problems caused by the existing machines included long changeover times, complex and expensive automated material handling, unbalanced cycle times, and poor machine reliability. In order for a cellular system to be successful in this environment, it would require that at least some of the machines be designed or redesigned to meet
977
Taj, Cochran, Duda and Linck experiences and performance improvements. International Journal of Production Research 35:2949. Womack, James P. 1996. Lean thinking: banish waste and create wealth in your corporation. New York: Simon & Schuster. AUTHOR BIOGRAPHIES SHAHRAM TAJ is a Professor in the College of Business Administration at the University of Detroit Mercy. He received a B.S. degree in Operations Research and Systems Analysis from the College of Planning and Computer Applications (Iran), M.S. in Industrial Engineering from the University of Rhode Island, and Ph.D. in Industrial Engineering and Operations Research from the University of Massachusetts (Amherst). DAVID COCHRAN is an Assistant Professor in the Department of Mechanical Engineering at the Massachusetts Institute of Technology. He received a B.S. degree in industrial engineering from Auburn University, a M.S. degree in manufacturing systems engineering from Pennsylvania State University, and a Ph.D. degree in industrial and systems engineering from Auburn University. JIM DUDA is a Ph.D. candidate in the Department of Mechanical Engineering at the Massachusetts Institute of Technology. He received a B.S. degree in mechanical engineering from Case Western Reserve University, and he received his M.S. degree in mechanical engineering from at the Massachusetts Institute of Technology. JOCHEN LINCK is a Ph.D. candidate in the Department of Mechanical Engineering at the Massachusetts Institute of Technology. He received a Dipl.-Ing. degree in mechanical engineering from RWTH Aachen.
978