John W. Fowler. Kraig Knutson. Esma Gel ... Duarte, Fowler, Knutson, Gel, and Shunk. One major obstacle in ...... ufacturing.net/scl/lessons/james.html. 1334 ...
Proceedings of the 2002 Winter Simulation Conference E. Yücesan, C.-H. Chen, J. L. Snowdon, and J. M. Charnes, eds.
PARAMETERIZATION OF FAST AND ACCURATE SIMULATIONS FOR COMPLEX SUPPLY NETWORKS
Brett Marc Duarte John W. Fowler Kraig Knutson Esma Gel Dan Shunk Department of Industrial Engineering PO Box 875906 Arizona State University Tempe, AZ 85287-5906, U.S.A.
1999). The first dimension is functional integration, involving decisions about purchasing, manufacturing and distribution activities within the company and between the company and its suppliers and customers. The second dimension is geographical integration of these functions across physical facilities located in one or several continents. The third dimension is integration of strategic, tactical and operational supply chain decisions. Supply Chains (SC) as described by Stevens (1989) is: “A system whose constituent parts include material suppliers, production facilities, distribution services and customers linked together via the feed forward flow of materials and the feedback flow of information”. With globalization of the market, optimization of supply chains becomes more and more important. Synchronizing this complex supply chain network, and making it respond to demand fluctuation is not trivial, but how well companies’ react to rapidly changing customer demands becomes a very important factor in their ability to dominate their markets. Typically, a supply chain is a multi-echelon system where each “node” in the supply chain may have several disparate suppliers. A simple supply chain in the semiconductor industry that was adapted from Godding and Kempf (2001) is shown in Figure 1.
ABSTRACT More efficient and effective control of supply networks is conservatively worth billions of dollars to the world economy. Adopting an approach by which the basic disciplines of Industrial Engineering, Control Engineering, System Simulation and Business Re-Engineering are integrated into one comprehensive system has been known to produce impressive results. This paper discusses a modular approach to develop a discrete event simulation model that has the appropriate level of abstraction to capture the inherent complexities that exist in a supply chain and is yet simple, fast and produces results of high fidelity. It discusses a method to parameterize each module by finetuning a few parameters to make it represent an entire factory, a warehouse or a transportation link. 1
INTRODUCTION
High value products that quickly become obsolete! A vast manufacturing network! Rapidly declining prices! A demanding customer base! The supply chain challenges facing the semiconductor industry are complex and difficult! In today’s globally competitive business world, the network of companies that band together to create an end product or service are not restricted to a sub-continent. The world is moving from single enterprise mass production to multiple enterprise customizations. Why? The strengths strategic alliances have to offer, which include higher margins, shorter development cycles, higher quality, lower overall costs, and the ability to meet demand on a singlecustomer basis. The key to gaining this competitive advantage is integrating decisions across the supply network. across geographically dispersed facilities, and across time. The essence of Supply Chain Management is integrated planning, which has three important dimensions (Shirodkar
G e o-1
M atl
F ab/S ort-1
A D I-1
A /T -1
C W -1
M atl C U S T O M E R S
M atl M atl
M atl
M atl F ab/S ort-2
A D I-2
A /T -2
C W -2
M atl
G e o-2
Figure 1: Simple Model of a Supply Chain
1327
Duarte, Fowler, Knutson, Gel, and Shunk One major obstacle in creating a seamless supply chain is uncertainty. In order to deal with this issue, it is imperative to identify and understand the cause of uncertainty and determine how it affects other activities up and down the supply chain. The complexity described above causes the semiconductor industry to experience erratic changes in demand and this makes it difficult to decipher the true demand from normal fluctuations, (Shirdokar 1999). What often appears as small random ripple variations in sales at the market place are amplified dramatically at each level in the chain, so that upstream companies or facilities experience the classical “boom-bust” effect, (Towill 1996). In particular the variance in orders tends to be larger than that of sales and this distortion tends to increase upstream. (Lee et al 1997) describes this phenomenon termed the “bullwhip” effect and attributes its cause to demand forecast updating, order batching, price fluctuations, and rationing and shortage gaming. Computer simulation, because it can be applied to operational problems that are too difficult to model and solve analytically, is an especially effective tool to help analyze supply chain logistical issues. Currently, tools for understanding uncertainty are limited to traditional mathematical formulas that do not account for variability. However, simulation is one of the best means for analyzing supply chains because of its capability to handle variability, (Towill 1996). Obviously, experimenting with an actual supply chain could be detrimental, as the profit at risk is prohibitively high. Useful results have been obtained by adopting an approach in which the basic disciplines of industrial engineering, control engineering, system simulation and Business Reengineering are integrated into one comprehensive system , (Forrester 1961). 2
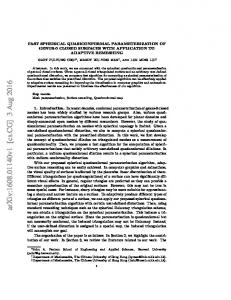
High - Detail Simulation Model
A C C U R A C Y Low Detail Simulation Model
SIMULATION RUN TIME / (cost)
Figure 2: Simulation Accuracy Versus Run Time 3
THE BASIC ATOMIC MODULE
To model the material flow in the physical system a module was developed by Shirodkar (1999) that can be used to represent a factory, a transportation link, or a warehouse. This hybrid module is made up of three sub-modules: a capacity sub-module, a delay sub-module and a yield submodule as shown in the Figure 3. T3
CAPACITY SUB-M ODULE
DELAY SUB-M ODULE Infinite Servers
Units in
Q U E U E
P roce ssing Les s er of the two
Units to be processed
P roce ssing P roce ssing
C apa c it y D is tribu tio n
T1
Y I E L D L O S S
T2
T1! The time a lot spends in the queue T2 !The processing time of the lot. T3 ! Total cycle time of the lot Figure 3: The Basic Atomic Module (Adapted from Shirodkar 1999) The production units that arrive at the capacity submodule sit in a queue. A sample is then drawn from a probability distribution, which represents the capacity of the module. This occurs at a predetermined time interval based on the chosen sampling rate; we use once a day in our experimentation. The value of capacity drawn from the distribution is then compared to the number of lots sitting in the queue and the lesser of the two is picked and that number of lots are released from the capacity sub-module into the delay sub-module. The delay sub-module has an infinite number of servers and each lot that enters this module is allotted a processing time from a user specified probability distribution. The queue in the capacity module thus represents the time spent waiting in front of the capacity for it to become available and the delay sub-module represents the time spent in processing once the capacity has become available. The lots that finish processing proceed to the “yield sub-module” where the good lots are separated from the defective ones.
PROBLEM STATEMENT
Traditionally, simulation models used in supply chains have either been detailed discrete event simulation (DES) models that track every individual lot that is processed at every workstation or high-level, continuous simulation models that do not track each lot but consider the gross output and cycle time performance of each factory in the chain. The first approach produces results that are very accurate but it generally takes a long time to build the model and the execution time of such a model is often extremely slow. Building models of the second type is generally much easier and their execution time is much faster, but the data produced is often far from accurate. Little work has been done to combine these approaches to develop a model that has an appropriate level of abstraction to capture the inherent complexities that exist in a supply chain and is yet simple, fast and produces results of high fidelity. The schematic diagram shown in Figure 2, illustrates the objective.
1328
Duarte, Fowler, Knutson, Gel, and Shunk eterize the atomic module is shown in Figure 4. In this approach, we use data taken from the real factory or from a detailed discrete event simulation (DES) of a factory to develop the capacity and cycle time parameters. Determining the capacity distribution is relatively simple. Since the predetermined sampling rate at the capacity sub-module is chosen to be once a day, the capacity parameters are determined by fitting the daily throughput of a simulation of a fully loaded factory to an empirical distribution or by fitting the daily throughput of the real factory divided by the utilization of the bottleneck to an empirical distribution.
PARAMETERIZATION OF MODULE
Among the various sources of error that make the output from a simulation less valid, is the modeling the “wrong” distribution for various input quantities, for example the arrival times of jobs to a job shop or the service time of machines. A commonly encountered problem in simulation modeling is the specification of a suitable input distribution for the observed data. The data is a specific realization of some underlying distribution that can be regarded as the “true” distribution, (Shankar and Kelton 1999). A prevalent practice is to approximate this “true” distribution with a standard family, for example an exponential distribution or a uniform distribution. In many situations, this approximation may not adequately represent the observed data, and may introduce significant error in the input that may adversely affect the validity of the output. In general there are three methods of specifying an input distribution, (Shankar and Kelton 1999).
Output measures of performance can indeed be sensitive to the particular input distribution. Using standard two-parameter distributions for which only the first two moments are captured in many cases is not sufficient, unless the system is running at relatively high traffic intensity. It may be necessary to use at least five moments for systems with low traffic intensity, (Gross and Juttijudatta 1997), even though the lower order moments are the ones that actually dominate. It is apparent that the problem of input distribution selection is inherent to simulation modeling. A point in favor of the empirical distribution is that their performance is consistent. This cannot be said about the standard distributions whose performance quality depends more critically upon the underlying true distribution. This robustness of an approximating method is an important issue in input distribution specification. Results from the previous research inferred that the model produces data that is qualitatively correct. The next step would therefore be to develop an approach by which the model could produce throughput and cycle time data that is (nearly) quantitatively correct and thus consistent with data from a real factory. The approach used to param-
9 8 Frequency (%)
7 6 5 4 3 2 1 55
52
50
47
45
42
40
37
35
32
30
27
25
22
10
0 20
3.
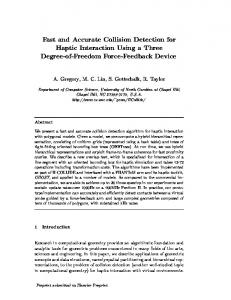
Matching the cycle time is not as straightforward because the cycle time distribution depends on the loading of the factory. It is important to use the cycle times of individual lots in ascertaining the distribution at each capacity loading. By using individual cycle times the reduction in variance caused by the averaging affect of lots coupled into daily or weekly time buckets is eliminated. Figure 5 shows the (sanitized, for confidentiality) distribution of cycle times for lots coming out of a real Intel factory. Figure 6 shows a similar cycle time distribution of lots coming out of the detailed discrete event simulation (DES) model. The model used was dataset #1 from the MASM Lab at Arizona State University (www.eas.asu. edu/~masmlab). The dataset was modified to consist of a single product with a release rate of 12 lots/day, which corresponds to a factory loading of 97%, each lot containing 48 wafers. The modified model produces no scrap and has 83 tool groups with 265 tools. The model also has 32 operator groups with 90 operators. The detailed simulation was run for 200 days with 10 replicates and the first 65 days of each replicate was truncated. The remaining lot cycle times were combined into one file and data from 10,000 lots were used to plot the histogram.
17
2.
Figure 4: Parameterization Methodology
Use a “standard” parametric distribution: These include distributions such as uniform, exponential, weibull. Use an empirical distribution: Here the observed data itself is used in some way to come up with a distribution function. Empirical distributions have flexibility, which is much desired. Use a Flexible parametric family: Such a parametric family supplies a flexible distribution function that is an approximation of the true distribution function. This alternative can be viewed as a compromise between the first two approaches and is both generalizable and flexible.
15
1.
12
4
Cycle Time
Figure 5: Total Cycle Time of Lots From a Real Factory
1329
Duarte, Fowler, Knutson, Gel, and Shunk results of both simulations. Therefore, subtracting the additional queue time ‘T1’ would render results that are very accurate, as we would expect since the resulting cycle time is simply a sample from the actual cycle time distribution.
6 5 4 3
DES Our M ode l
38 Average Cycle Time (Days)
55
52
50
47
45
42
40
37
35
32
30
27
25
22
20
17
15
12
2 1 0 10
F req u en cy (% )
9 8 7
Cycle Tim e (Da ys)
Figure 6: Total Cycle Time of the Detailed DES
33 28 23 18
The cycle time distribution in Figure 5 and Figure 6 above look fairly similar. Note that the average cycle time of the DES model is 34.65 days. A simulation was then run using our atomic module (coded in EXTENDTM). The capacity distribution for this model was obtained from the 100% factory loading detailed DES and the cycle time distribution was obtained from the 97% factory loading detailed DES by fitting the cycle time of the 10,000 lots to an empirical distribution. Figure 7 shows the cycle time distribution from this simulation run.
40
50
60
70
80
90
10 0
C ap acit y L o a d in g (% )
Figure 8: Average Cycle Time versus Capacity Loading Estimating this additional queue time ‘T1’ can be either done on an individual entity basis or by evaluating the average queue time at a particular capacity loading using analytical methods. The latter approach proves beneficial later in the section, as a graph of the average queue time versus the capacity loading is a good characteristic approximation of what the cycle time curve would look like qualitatively.
9 8 F req uency (%
7 6 5
4.1
4
Analytical Approach to Estimate Queue Time
3 2 1
The model under consideration can be thought of as an inventory system that has a deterministic supply but a random demand. It is assumed that any demand that cannot be satisfied for the day is lost.
55
52
50
47
45
42
40
37
35
32
30
27
25
22
20
17
15
12
10
0 C ycle T im e (D a ys)
Figure 7: Total Cycle Time from Our Model
The demand on day n The inventory available to satisfy the demand on day n. Deterministic start rate (Lots/day), of the lots that arrive at the beginning of the day and are available to satisfy the demand for the day.
Yn Xn
Once again the distribution looks similar to that of the DES. The average cycle time however is 40.87 days, which is higher that that of the DES and is attributed to the additional time the lots spend at the capacity sub-module. The breakdown of the overall cycle time of a lot through the atomic module is shown in Figure 3. The value ‘T1’, which is the amount of time a lot spends in the queue, is determined by the capacity sub-module and will be negligible when the factory is lightly loaded, but will increase as the factory loading increases. ‘T2’ for each lot is simply a sample from the given cycle time distribution and does not depend on the factory load. ‘T3’ is the total cycle time of a lot and is the sum of ‘T1’ and ‘T2’. Matching the cycle time distribution of the detailed simulation with that from our module for a given loading by running a detailed simulation for each loading of interest is easy. A simple experiment shown in Figure 8 show the results obtained by using this approach. As mentioned above the difference in cycle times between the two simulations is purely due to the time a lot spends at the capacity submodule “T1”. As the system is more heavily loaded this queue time increases and so also the difference between the
a
The stochastic process {Xn, n ≥ 0} possesses the Markovian property which states that if the present state of the system is known, the future of the system is independent of its past, (Kulkarni 1995). Stated another way, the present state of the system contains all the relevant information needed to predict the future in a probabilistic sense. Hence the stochastic process {Xn, n ≥ 0} can be modeled as a Discrete-Time Markov Chain (DTMC). The steady state distribution of the process can be found by solving for the following set of equations. π
j
=
∞
∑π i=0
1330
i
.Pij
∀ i = 0,1,2,…and
∞
∑π j=0
j
=1
Duarte, Fowler, Knutson, Gel, and Shunk where lim Pij = π j , is the long-run average fraction of
0 1 2 3 4 5 6 7 8 9 10 11 12 13 14 15 16 17 18 19 20
n →∞
time that the system stays at state j and Pij represents the transitional probability of moving from state ‘i’ to state ‘j’ as shown in Figure 9 and each state is defined as the inventory left at the end of the day. P ij
1
2
Figure 9: Markov Chain with Transition Probabilities
0 0.85
1 0.03
2 0.02
3 0.02
4 0.02
5
6
7
8
9
10
11
12
13
14
15
16
17
18
19
0
0
0
0
0
0
0
0
0
0
0
0
0
0
0
0.03 0.03
0.03 0.03
0.02 0.03
0.02 0.02
0.02 0.02
0.06 0.02
0 0.06
0 0
0 0
0 0
0 0
0 0
0 0
0 0
0 0
0 0
0 0
0 0
0 0
0 0
0.74
0.04
0.03
0.03
0.03
0.02
0.02
0.02
0.06
0
0
0
0
0
0
0
0
0
0
0
0.70
0.04
0.04
0.03
0.03
0.03
0.02
0.02
0.02
0.06
0
0
0
0
0
0
0
0
0
0
0
0
0
0
0
0
0
0
3
4
5
0.02
0.02
0.06
0
0.03
0.02
0.02
0.02
0.06
0
0
0
0
0
0
0
0
0
0
0
0
0
0.03
0.03
0.03
0.02
0.02
0.02
6
0.06
7
8
0
0
0
0
0
0
0
0
0
0
0
0
0
0.74
0.04
0.03
0.03
0.03
0.02
0.02
0.02
0.06
0
0
0
0
0
0
0
0
0
0
0
0
0
0
9
10
0
0
11 0
0
12 0
0
13 0
14
15
0
0
0
0
20
0
0 0
0.04
0.04
0.03
0.03
0.03
0.02
0.02
0.02
0.06
0
0.04
0.04
0.04
0.03
0.03
0.03
0.02
0.02
0.02
0.06
0
0.04
0.04
0.04
0.04
0.03
0.03
0.03
0.02
0.02
0.02
0.06
0
0
0
0.04
0.04
0.04
0.04
0.04
0.03
0.03
0.03
0.02
0.02
0.02
0.06
0
0
0
0
0
0
0
0
0.53
0.05
0.04
0.04
0.04
0.04
0.04
0.03
0.03
0.03
0.02
0.02
0.02
0.06
0
0
0
0
0
0
0
0.48
0.05
0.05
0.04
0.04
0.04
0.04
0.04
0.03
0.03
0.03
0.02
0.02
0.02
0.06
0
0.43
0.05
0.05
0.05
0.04
0.04
0.04
0.04
0.04
0.03
0.03
0.03
0.02
0.02
0.02
0.06
0
0
0
0
0
0.37
0.06
0.05
0.05
0.05
0.04
0.04
0.04
0.04
0.04
0.03
0.03
0.03
0.02
0.02
0.02
0.06
0
0
0
0
0.32
0.05
0.06
0.05
0.05
0.05
0.04
0.04
0.04
0.04
0.04
0.03
0.03
0.03
0.02
0.02
0.02
0.06
0
0
0.27
0.05
0.05
0.06
0.05
0.05
0.05
0.04
0.04
0.04
0.04
0.04
0.03
0.03
0.03
0.02
0.02
0.02
0.06
0
0.22
0.05
0.05
0.05
0.06
0.05
0.05
0.05
0.04
0.04
0.04
0.04
0.04
0.03
0.03
0.03
0.02
0.02
0.02
0.06
0
0.18
0.04
0.05
0.05
0.05
0.06
0.05
0.05
0.05
0.04
0.04
0.04
0.04
0.04
0.03
0.03
0.03
0.02
0.02
0.02
0.06
0.12
0.04
0.05
0.05
0.05
0.06
0.05
0.05
0.05
0.04
0.04
0.04
0.04
0.04
0.03
0.03
0.03
0.02
0.02
0
0.06
0.12
0.04
0.05
0.05
0.05
0.06
0.05
0.05
0.05
0.04
0.04
0.04
0.04
0.04
0.03
0.03
0.03
0.02
0
0
0.06
0.12
0.04
0.05
0.05
0.05
0.06
0.05
0.05
0.05
0.04
0.04
0.04
0.04
0.04
0.03
0.03
0.03
0
0
0
0.06
0.12
0.04
0.05
0.05
0.05
0.06
0.05
0.05
0.05
0.04
0.04
0.04
0.04
0.04
0.03
0.03
0
0
0
0
0.06
0.12
0.04
0.05
0.05
0.05
0.06
0.05
0.05
0.05
0.04
0.04
0.04
0.04
0.04
0.03
0.06 0.08 0.10 0.12 0.15 0.18
0
0
0
0
0
0
0 0
0
0
19
0.58
0
0
18
0.62
0
0
0
0.70
0
0
17
0.67
0
0
16
0
0 0
0
0
0
0
0
0
0
0 0
rithm was coded in Matlab. The expected queue length (not including jobs in processing) ‘Lq’ can then be calculated as L
=
q
n
∑
π
j
⋅ j
j= 0
From Little’s Law we have: L
= λ * W
q
Where λ denotes the start rate and Wq denotes the waiting time in the queue. Therefore for a given start rate ‘λ‘, the waiting time in queue Wq can easily be calculated. One question that arises is how big should the truncated transitional probability matrix be? Naturally we expect that the bigger the matrix, the more accurate the result will be. Figure 12 show the trade-off between the size of the matrix and the average queue time obtained. The experiment was carried out using the matrix corresponding to a 97% loading. Average Queue Tim e (Days)
7 6 5 4 3 2 1 0 0
100
200
300
400
500
600
700
800
Siz e of S quare Ma trix
Figure 12: Trade-Off between the Size of the Matrix and the Average Queue Time for a 97% Capacity Loading
20
0.06
0.82 0.79
2 0.02
0.03
0.79
process it calculates the steady state probability vector π ′ = [π 0 π 1π 2 ... ] with low relative error. The GTH algo-
The Transitional Probability Matrix (TPM) that represents this Markov chain is set up by evaluating the probability of a having a certain number of lots waiting in inventory at the end of the day, after the capacity of the system has been set for that day The example shown in Figure 10 is for a start rate of 5 lots/day. P00 would therefore be the transition probability of having zero lots at the end of a day on which five lots entered the system with an initial inventory of zero. This would occur if the capacity for the day were greater than or equal to 5. The probability of achieving this based on the capacity distribution is 0.85. Similarly, P01 is the transition probability of having one lot at the end of a day on which five lots entered the system with an initial inventory of zero. This would occur if the capacity for the day were four. The probability of achieving this based on the capacity distribution is 0.03. Similarly the rest of the probabilities in the transitional probability matrix (TPM) can be evaluated. The TPM for the model is that of an irreducible Markov chain with infinite state space. The matrix is symmetrical with an upper and lower triangle of zeros. A quick way of solving this matrix is by approximating the TPM with a finite state space. We truncated the TPM as shown in Figure 11, and then solved it using the Grassmann, Taksar and Heyman (GTH) algorithm (Grassmann et al 1985). The GTH Algorithm is a state reduction algorithm. Recursively, a Markov chain with one state less is constructed from the previous one. The algorithm begins with th the n row and column and performs a series of iteration and computation, working its way up the matrix. In the 0 1 2 3 4 5 6 7 8 9 10 11 12 13 14 15 16 17 18
1 0.03
0.82
Figure 11: Transitional Probability Matrix (TPM) with Finite State Space
8
0
0 0.85
0 0
0.67
0.04
0.04
0.04
0.03
0.03
0.03
0.02
0.02
0.02
0.06
0
0.62
0.04
0.04
0.04
0.04
0.03
0.03
0.03
0.02
0.02
0.02
0.06
0
0
0
0
0
0
0
0
0
0.58
0.04
0.04
0.04
0.04
0.04
0.03
0.03
0.03
0.02
0.02
0.02
0.06
0
0
0
0
0
0
0
0
0.53
0.05
0.04
0.04
0.04
0.04
0.04
0.03
0.03
0.03
0.02
0.02
0.02
0.06
0
0
0
0
0
0
0
0.48
0.05
0.05
0.04
0.04
0.04
0.04
0.04
0.03
0.03
0.03
0.02
0.02
0.02
0.06
0
0
0
0
0
0
0
0.43
0.05
0.05
0.05
0.04
0.04
0.04
0.04
0.04
0.03
0.03
0.03
0.02
0.02
0.02
0.06
0
0
0
0
0
0.37
0.06
0.05
0.05
0.05
0.04
0.04
0.04
0.04
0.04
0.03
0.03
0.03
0.02
0.02
0.02
0.06
0
0
0
0
0.32
0.05
0.06
0.05
0.05
0.05
0.04
0.04
0.04
0.04
0.04
0.03
0.03
0.03
0.02
0.02
0.02
0.06
0
0
0
0.27
0.05
0.05
0.06
0.05
0.05
0.05
0.04
0.04
0.04
0.04
0.04
0.03
0.03
0.03
0.02
0.02
0.02
0.06
0
0
-
0.22 0.18
0.05 0.04
0.05 0.05
0.05 0.05
0.06 0.05
0.05 0.06
0.05 0.05
0.05 0.05
0.04 0.05
0.04 0.04
0.04 0.04
0.04 0.04
0.04 0.04
0.03 0.04
0.03 0.03
0.03 0.03
0.02 0.03
0.02 0.02
0.02 0.02
0.06 0.02
0 0.06
-
0.06
0.12
0.04
0.05
0.05
0.05
0.06
0.05
0.05
0.05
0.04
0.04
0.04
0.04
0.04
0.03
0.03
0.03
0.02
0.02
0.02
-
-
-
-
0
0.06
0.12
0.04
0.05
0.05
0.05
0.06
0.05
0.05
0.05
0.04
0.04
0.04
0.04
0.04
0.03
0.03
0.03
0.02
0.02
0
0
0.06
0.12
0.04
0.05
0.05
0.05
0.06
0.05
0.05
0.05
0.04
0.04
0.04
0.04
0.04
0.03
0.03
0.03
0.02
-
-
-
-
19
0
0
0
0.06
0.12
0.04
0.05
0.05
0.05
0.06
0.05
0.05
0.05
0.04
0.04
0.04
0.04
0.04
0.03
0.03
0.03
-
-
-
-
20
0
0
0
0
0.06
0.12
0.04
0.05
0.05 -
0.05 -
0.06 -
0.05 -
0.05 -
0.05 -
0.04 -
0.04 -
0.04 -
0.04 -
0.04 -
0.03 -
0.03
-
-
-
-
-
-
Results obtained by using the analytical method of estimating queue time were also compared to that of the simulation to check the validity of the method. The comparison is shown in Table 1. Therefore, if we can estimate the additional queue time analytically, it is relatively easy to match the cycle time distribution of the detailed simulation with that from our module for given start rates by running a detailed simu-
-
-
∝
∝
Figure 10: Transitional Probability Matrix (TPM) with infinite state space
1331
Duarte, Fowler, Knutson, Gel, and Shunk asymptote corresponds to a lightly loaded factory where the cycle time is almost equal to the raw processing time. The second asymptote represents a heavily loaded factory where the traffic intensity approaches the capacity of the system. The cycle time for such loadings approaches infinity due to the ever-increasing queue. As a next step, to achieve the cycle time at various loadings, we linearly interpolated the average cycle times or each segment of the curve based on the load percent. Developing linear equations to represent each segment requires two reference points for each equation. The question is how do we pick the reference points? A graph of the average queue time versus the capacity loading is a good characteristic approximation of what the cycle time curve would look like qualitatively. Since obtaining the average queue time using analytical methods is efficient, we use the queue time versus capacity loading graph to choose which capacity loadings to run the DES to best represent each cycle time segment. The mean and standard deviation of the cycle time at each reference point is noted and linear equations for both parameters are set.
Table 1: Comparison of the Queue Time Achieved from the Analytical Approach to that of the Simulation Run A N A L Y T IC A L A P P R O A C H
C a p a c ity L o a d in g
Avg Q ueue T im e
H a lf w id th C o n fid e n c e L e v e l( 9 5 .0 % )
R e p lic a te s
In v e n to r y Level
Avg Q ueue T im e
∆
5
4 0 .5 0 %
0 .1 4
0 .0 1
6
0 .7 3
0 .1 4
0 .0 0
7
5 6 .7 0 %
0 .2 2
0 .0 1
6
1 .5 5
0 .2 2
0 .0 0
8
6 4 .8 0 %
0 .2 9
0 .0 1
6
2 .3 4
0 .3 0
-0 .0 1
9
7 2 .9 0 %
0 .4 3
0 .0 7
6
5 .8 3
0 .4 1
0 .0 2
10
8 1 .0 0 %
0 .6 0
0 .0 7
6
9 .9 8
0 .6 3
-0 .0 3
11
8 9 .1 0 %
1 .2 5
0 .2 4
6
2 1 .0 4
1 .2 2
0 .0 3
12
9 7 .3 0 %
6 .3 0
2 .0 6
6
6 3 .6 0
6 .2 1
0 .0 9
lation for each loading of interest, using empirical distributions for the capacity and delay and subtracting the additional queue. However, our goal is to specify a small number of capacity and cycle time parameters that will give reasonable estimates of cycle time distributions over a range of factory loadings. As indicated earlier, using a single cycle time distribution to statistically match data at different capacities would be ideal. In order to see how well a single cycle time distribution would work, the module was run using the empirical cycle time distribution that was built using data that corresponded to a 40% capacity load of the detailed DES. It was assumed that the effect of queuing is insignificant at this loading. The capacity distribution supplied to the module was the throughput distribution from a detailed DES at 100% capacity load. The module was then run at different start rates (40%, 81%, 90%, 97%) to check if the output matched that of the detailed DES. The results of this experiment are shown in Figure 13. Notice that the average cycle time from our module significantly underestimated the average cycle time from the detailed DES for all loadings. The same experiment was repeated using the 80% cycle time distribution of the detailed DES as the delay distribution in our module. As shown in Figure 13, using this distribution led to a significant overestimate of average cycle time for a lightly loaded factory and a significant underestimate for a heavily loaded factory. The cycle time characteristic curve of a system, with no batching policies, can be represented by a monotonically increasing curve (Fowler and Park 2001). For these systems, the cycle time curve can be broken up into three principal segments, two asymptotes and a knee. The first
Queue Tim e (Days)
1.5
40
Av g C ycle T im e ( D ay
25 23 21 19 17 60
70
80
90
32 30
Segments
28 26 24 22
50
60 70 80 Ca pa city Loa ding (%)
90
100
20 40
50
60
70
Capacity Loading (%)
80
90
100
Based on the assumption of Rose (1999), the cycle time distributions at higher capacity loadings can be assumed to be normally distributed. Using the equations for the mean and the standard deviation we can set the parameters of the normal distribution. Intuitively the average cycle time using our module will still be overestimated due to the fact that a non-linear curve has been replaced by a linear one for the purpose of estimation and due to the additional queue time ‘T1’ in the model. We propose to use the analytical method to estimate ‘T1’ and subtract this estimate from the cycle time of each lot so as to eliminate the later problem. To verify this approach, the simulation model was run for a period of 3400 days at different start rates. An initial bias of 5000 lots were considered and eliminated from the statistics. Eight replicates were performed at each capacity loading. The results obtained are shown in Figure 15 and in Table 2. Figure 16 is a plot of the average daily cycle time versus the elapsed time for the system run at 89% capacity loading which corresponds to a start rate of 11 lots/day. Data from day 400 through day 3400 has been plotted. The average cycle time for the DES is 25.20 days with a standard deviation of 1.78 days while our model has a mean cycle time of 25.58 days with a standard deviation of 1.51
27
50
Detailed DES
Figure 14: Choosing the Three Segments
29
40
34
18
0
31
30
1
0.5
O ur M odel-80% F ac tory E x plorer O ur M odel-40%
33
36
A vg Q ueue Tim e S egm ents c hos en to represent c urve
2
37 35
Cycle Time Characteristic Curve
2.5
Average Cycle Tim e (Days)
S IM U L A T IO N S ta rt R a te L o ts /d a y
100
L o ad in g ( %)
Figure 13: Cycle Time Versus Capacity Loading Using a Single Delay Distribution
1332
Duarte, Fowler, Knutson, Gel, and Shunk T ime b uck ets A v e ra g e C y c le T im e
38
Input
DES
2
T im e b uc kets 3
4
Inp ut
units /d ay
O ur M o d e l
34
1
30
26
22
1
2
3
4
u n its /day
1
1
D 2 a y 3 s 4
D2 a y 3 s 4
5
5
18 30
40
50
60 70 C a p a c ity L o a d in g (% )
80
90
100
Figure 15: Cycle Time Versus Capacity Loading
Figure 17: Effect of a Deterministic/Stochastic Cycle Time Distribution
Table 2: Statistical Comparison of DES with Our Model
7 9 7 % C a p a c i ty L o a d i ng
S td De v of T hro u g hp
Capacity Loading 40.50% 56.70% 64.80% 72.90% 81% 89% 97.30% Start Rate 5 7 8 9 10 11 12 Meat CT (DES) 18.80 19.38 19.94 20.86 22.58 25.57 34.65 Mean CT (Our Model) 18.80 19.83 19.95 20.86 23.24 25.54 34.73 Standard Error 0.00 0.01 0.01 0.01 0.03 0.11 0.73 Median 18.80 19.83 19.95 20.86 23.24 25.46 35.16 Standard Deviation 0.01 0.02 0.02 0.02 0.07 0.31 2.07 Sample Variance 0.00 0.00 0.00 0.00 0.01 0.10 4.28 Range 0.05 0.06 0.07 0.07 0.20 1.02 5.64 Minimum 18.77 19.79 19.91 20.82 23.15 25.17 31.58 Maximum 18.81 19.85 19.98 20.89 23.35 26.19 37.22 Sum 150.39 158.65 159.58 166.87 185.95 204.35 277.87 Count 8.00 8.00 8.00 8.00 8.00 8.00 8.00 Confidence Level (95.0%) 0.01 0.01 0.02 0.02 0.06 0.26 1.73
8 9 % C a p a c i ty L o a d i ng
6
8 1 % C a p a c i ty L o a d i ng 4 0 % C a p a c i ty L o a d i ng
5 4 3 2 1 0
5
10
15
20
25
S td De v of Cy c le T im e D is trib ut io n (D ay s )
Figure 18: Effect the Delay Distribution has on the Throughput trates the extent to which this “cross-jumping” of lots effect the variance in throughput. When the delay distribution is deterministic, the standard deviation of the throughput for our model matches that of the DES, however, as the width of the cycle time distribution increases, the standard deviation of the throughput decreases till it eventually reaches a steady state.
Figure 16: Cycle Time/Throughput Versus Elapsed Time at 89.1% Capacity Loading
5
days. Similar experiments were run to validate the model at different capacity loadings. As far as throughput goes, the first 400 days of data has been truncated and data for the next 600 days has been plotted. Notice that while the average throughput of our model is consistent with that of the DES, it does not have as much variability. The average throughput for the DES is 11.03 units/day while that for our model is 11.02 units/day. The standard deviation for the DES is 6.27 units/day while that for our model, however, is 3.36 units/day. This is attributed to the interaction between the capacity distribution and the delay distribution. The schematic diagrams in Figure 17 illustrate the effect of the interaction between the capacity and delay distribution. The system is analogous to a conveyor on which the delay distribution sprays lots. When the delay distribution is deterministic, the lots that enter the delay submodule fall into the same time bucket and the variability in throughput is preserved. For this example the processing time is 4 days. With the advance of the time clock the lots move one day closer to completion as a result the throughput at the end of days four, five, six, seven and eight would be five, two, zero, five, and six. However, variability in the delay distribution causes lots to jump into different time buckets and in the process reduces the variability in the throughput. Figure 18 illus-
EXECUTION TIMES
As far as accuracy goes, sufficient evidence has been put forth to illustrate the credibility of our model, speed on the other hand is a critical issue. Figure 19 is a plot of the simulation run time for the DES compared to our model. The model was run at different capacity loadings and the simulation run time was recorded. The experiments were run on a Pentium II, 333 MHz machine. The results show that our model is much faster than the DES.
Ru n Tim e (M
50 40 30
DE S O ur M odel
20 10 0 30
40
50
60
70
80
90
100
Ca pa city Lo a ding (%)
Figure 19: Simulation Run Time When modeling complex, supply networks, which consists of several manufacturing, assembly and distribution facilities, the speed of our model would be even more apparent. With its low run time and accuracy the model should be a useful tool.
1333
Duarte, Fowler, Knutson, Gel, and Shunk 6
REFERENCES
CONCLUSIONS
In manufacturing, common performance measures used to evaluate a system are Cycle Time (CT), Throughput (TH) and Work in Process (WIP). Changes to operating policies can be evaluated by examining the impact on these three performance metrics. Due to the complexities of manufacturing systems in the semiconductor industry, a simulationbased approach becomes a viable choice. As stated earlier, detailed discrete event simulators (DES) track each individual lot that is processed at every workstation. As a result such models produce results that are very accurate but they generally take a long time to execute. Our model on the other hand aims at having the right level of abstraction to capture the inherent complexities that exist in a supply chain and yet is simple, fast and produces results of high fidelity. By means of a simple model, we intend to foster a basic understanding of the behavior of manufacturing units. If the simple modeling approach mimics the full factory accurately, then these models can be used to model complex supply networks. As far as accuracy goes, sufficient evidence has been put forth to prove its credibility. Speed on the other hand is a critical issue. Run-time experiments carried out on a Pentium II 333 MHz machine show that our model is much faster than the detailed discrete event simulator (DES) when modeling a single manufacturing unit. It is believed that the speed of the model would be even more impressive when modeling a complex supply network consisting of multiple factories, assembly facilities, transportation centers and component warehouses. Currently the model is set up to accommodate one generalized product family, however an important next step would be to accommodate multiple product groups. This would lead to a more intuitive understanding of factory dynamics based on product prioritization coupled with various dispatching policies. Future research in this area would be aimed at attaining output parameters, namely cycle time and throughput that are statically indistinguishable from data obtained from a real factory. The present model produces results that are very encouraging, however, interaction between the capacity and delay distribution tends to squeeze the variability in the throughput. Each module can further be embellished to make it look more like a factory, a transportation link or a component warehouse. Yield loss can be incorporated into the model to give it a more realistic flavor. As the capacity loading of the system increases the effect of auto-correlation in cycle time becomes more apparent. Future work in this area could entail comparing several correlation scenarios with respect to their ability to mimic real factory data.
Forrester, J.W.,1961 Industrial Dynamics. MIT Press, Cambridge, MA. Fowler, W. J., Park, S., 2001, Efficient Cycle TimeThroughput Curve Generation Using Fixed Sample Size Procedure. International Journal of Production Research, Vol. 39, No.12, 2595-2613. Godding, G., Kempf, K., August 11-14, 2001, A Modular, Scalable Approach To Modeling And Analysis Of Semiconductor Manufacturing Supply Chains. Proceedings of IV SIMPOI/POMS 2001, Guarujá/SP-Brazila. Grassmann, W. K., Taksar, M. I., Heyman, D. P.,1985, Regenerative Analysis and Steady State distributions for Markov Chains. Operations Research, Vol. 33, No. 5, 1107-1116. Gross, D.,Juttijudatta, M., Dec.1997, Sensitivity Of Output Performance Measures To Input Distributions In Queuing Simulation Models. Winter Simulation Conference, pp 296-302. Hopp, W. J., Spearman, M. L, 2001, Factory Physics. Second Edition. Ingalls, R., Kasales, C., Dec.1999, CSCAT: The Compaq Supply Chain Analysis Tool. Winter Simulation Conference, Vol. 1, pp 1201-1206. Jain, S., Lim, C.C., Gan, B.P., Low, Y.K., Dec 1999, Criticality Of Detailed Modeling In Semiconductor Supply Chain Simulation. Winter Simulation Conference, Vol.1, pp 888-896. Kempf , K., Knutson, K., Fowler J. W., Armbruster, B., Duarte, B. M., Babu, P., April 24-25, 2001, Fast And Accurate Simulations Of Physical Flow In Demand Networks. Proceeding of International Conference on Semiconductor Manufacturing Operational Modelling an Simulation, Seattle, WA, pp 111-116. Kitagawa, T., Maruta, T., Ikkai, Y., Komoda, N., Aug 2426, 2000, A Description Language Based On Multifunctional Modeling And A Supply Chain Simulation Tool. 4th IEEE International Workshop, pp 71–78. Kulkarni, G. V.,1995, Modelling And Analysis Of Stochastic Systems. 1995 Edition. Law, A. M., Kelton, D. W.,1991, Simulation Modelling And Analysis. Second Edition. Lee, H. L., Padmanabhan, V., and Whang, S., April 1997, Information Distortion In A Supply Chain: The Bullwhip Effect. Management Science, Vol. 43, No. 4, pp 546-558. Leemis, L., Dec 2000, Input Modeling. Winter Simulation Conference, Vol. 1, pp 17-25. Maltz, A. B., Grenoble, W. I., Rogers, D. S., Baseman, R. S., Grey, W. and Katircioglu, K .K., Lessons From The Semiconductor Industry. Retrieved March 10, 2001 from the World Wide Web: http://www.man ufacturing.net/scl/lessons/james.html
ACKNOWLEDGMENTS This research has been partially supported by a grant from Intel Corporation.
1334
Duarte, Fowler, Knutson, Gel, and Shunk at Advanced Micro Devices. His research interests include modeling, analysis, and control of semiconductor manufacturing systems. Dr. Fowler is the co-director of the Modeling and Analysis of Semiconductor Manufacturing Laboratory at ASU. The lab has had research contracts with NSF, SRC, SEMATECH, Infineon Technologies, Intel, Motorola, ST Microelectronics, and Tefen, Ltd. He is a member of ASEE, IIE, IEEE, INFORMS, POMS, and SCS. His email address is
Maruta, T., Ikkai, Y., Komoda, N., May 1999, Simulation Tool Of Supply Chain Model With Various Structure And Decision Making Processes. 7th IEEE Conference, Vol. 2, pp 1443-1449. Maskell, B., 2001, The Age Of Agile Manufacturing. Supply Chain Management: An International Journal, Vol. 6, ISSN 1359-8546. Ramberg, J. S., Dudewicz, E. J., Tadikamalla, P. R., Mykytka, E. F., May1978, A Probability Distribution And Its Uses In Fitting Data. ASQC Chemical Division Technical Conference. Rose, O., Jan 1999, Estimation Of The Cycle Time Distribution Of A Wafer Fab By A Simple Simulation Model. In Proceedings of the SMOMS '99 (1999 WMC), pp. 133-138. Schunk, D., Dec 2000, Using Simulation To Analysis Supply Chains. Winter Simulation Conference, Vol. 2, pp 1095-1100. Shankar, A., Kelton, W., Dec.1999, Emperical Input Distributions: An Alternative To Standard Input Distributions In Simulation Modeling. Winter Simulation Conference, pp 978-985. Shirodkar, S., Dec.1999, A Modular Approach For Modeling And Simulating Semiconductor Supply Chains. Masters thesis at Arizona State University. Stevens, J., 1989, Integrating The Supply Chain. International Journal of Physical Distribution & Material Management, Vol. 19, pp 3-8. Towill, D., 1996, Industrial Dynamics Modeling Of Supply Chains. International Journal Of Physical Distribution And Logistics Management, Vol. 26, No.2, pp 23-42. Towill, D. R., 1995, Time Compression And Supply Chain Dynamics. Logistics International, Sterling publications, London, pp 43-7. Turner, S., Gan, P., 2000, Adapting A Supply Chain Simulation For HLA. 4th IEEE International Workshop, pp 71-78, Aug. 24-26.
KRAIG KNUTSON is an assistant professor in the Del E. Webb School of Construction at Arizona State University. He holds a bachelor’s and master’s degree in construction and a Ph.D. in industrial engineering from Arizona State University. His research interests are related to the design, simulation and optimization of manufacturing systems and construction processes. He is a member of IIE, INFORMS, AACE, AIC and ASCE. ESMA GEL is currently Assistant Professor of Industrial Engineering at Arizona State University. Her research interests are stochastic modeling and control of manufacturing systems and her current work is on agile workforce policies in various production environments. She is a member of INFORMS, IIE and ASEE. She completed her Ph.D. studies in 1999, at the Department of Industrial Engineering and Management Sciences of Northwestern University where she also received her M.S. degree in 1996. She earned her B.S. degree in Industrial Engineering from Orta Dogu Technical University, Ankara, Turkey and was awarded the Walter P. Murphy Fellowship by Northwestern University for graduate study in 1994. DAN SHUNK is a Full Professor of Industrial Engineering at Arizona State University and former Director of the CIM Systems Research Center. He is currently pursuing research into global new product development, modelbased enterprises and global supply chain. His latest book is Integrated Process Design and Development, an Irwin publication. Dr. Shunk studied at Purdue where he received his Ph.D. in Industrial Engineering in 1976. He is cofounder of the USAF Integrated Computer Aided Manufacturing (ICAM) Program where he launched such industry standards as IDEF and IGES, former manager of Industrial Engineering at Rockwell, former manager of manufacturing systems at International Harvester, and former VP-GM of the multi-million dollar Integrated Systems Division of GCA Corporation. Dr. Shunk has served on the Board of Advisors of CASA of the Society of Manufacturing Engineers, and chaired CASA in 1993. He helped Motorola conceive Motorola University and has served on their faculty since 1984. He is on the Editorial Board of the Agility and Global Competition Journal and the International Journal of Flexible Automation and Integrated Manufacturing. He is an active member of the Inter-
AUTHOR BIOGRAPHIES BRETT MARC DUARTE received his Master’s degree in Industrial Engineering from Arizona State University in May 2002. He has a specialization in manufacture of semiconductors, and his interests lie in simulation and modeling, with an emphasis on supply chain management and integration. His email address is JOHN W. FOWLER is an Associate Professor in the Industrial Engineering Department at Arizona State University. Prior to his current position, he was a Senior Member of Technical Staff in the Modeling, CAD, and Statistical Methods Division of SEMATECH. He received his Ph.D. in Industrial Engineering from Texas A&M University and spent the last 1.5 years of his doctoral studies as an intern
1335
Duarte, Fowler, Knutson, Gel, and Shunk national Federation of Information Processors (IFIP) Committee 5.3 on CIM. He is a senior member of SME and IIE. He won the 1996 SME International Award for Education, the 1999 and 1991 Industrial Engineering Faculty of the Year award, the 1989 SME Region VII Educator of the Year award, chaired AutoFact in 1985, and won the 1982 SME Outstanding Young Engineer award. For the year 2000 he has been nominated as the US Alternate to the Intelligent Manufacturing Systems project.
1336