VIII International Conference on Computational Plasticity COMPLAS VIII E. Oñate and D. R. J. Owen (Eds) © CIMNE, Barcelona, 2005
2D FE MODELLING OF MACHINING: A COMPARISON OF DIFFERENT APPROACHES WITH EXPERIMENTS Halil Bil*, A. Erman Tekkaya† and S. Engin Kılıç‡ *
Institute for Manufacturing Engineering and Production Management – FBK Kaiserslautern University of Technology Email:
[email protected], Web page: http://www-user.rhrk.uni-kl.de/~bil/ †
Department of Manufacturing Engineering, ATILIM University Email:
[email protected] - Web page: http://design.atilim.edu.tr/tekkaya/ ‡
Department of Mechanical Engineering, Middle East Technical University Email:
[email protected] - Web page: http://www.me.metu.edu.tr/kilic/
Key words: Finite element modelling, Orthogonal cutting, Chip separation, Friction. 1 INTRODUCTION In recent years, finite element analysis has become the main tool for analyzing metal cutting. Although early models involved self-written codes, application of commercial FE packages is preferable for industrial utilization. Recently, some commercial FE codes offer the modelling of cutting. As these codes are based on different algorithms, it is not known if and by what degree results from each of them will differ. The aim of this study is to evaluate these different approaches to the modelling of machining. MSC.Marc, Deform2D and AdvantEdge have been used in the investigation. Experiments have been performed by cutting a tube from the end to verify the simulation results. 2 FINITE ELEMENT MODELS The FE models consist of a rigid tool and a deformable workpiece, for which plane-strain condition was assumed. In MSC.Marc and Deform2D, left and bottom boundaries of the workpiece are totally fixed. AdvantEdge, however, is an automated program and the boundary conditions are hidden. Friction is modelled as constant shear in MSC.Marc and Deform2D, whereas, AdvantEdge uses the Coulomb friction model. The flow curves are represented by tabulated data, which depends on strain, strain rate and temperature1. In addition, MSC.Marc does not extrapolate and evaluates the flow stress at the limit of the available data range, whereas Deform2D extrapolates using the last two data points. Thirdwave AdvantEdge uses an analytical equation2 for material characterization. In MSC.Marc and Thirdwave AdvantEdge, chip separation is achieved by continuous remeshing3. In Deform2D, on the other hand, element erase4, based on normalized Cockroft-Latham damage criterion, has been used for separation. For thermal solution, the heat is generated due to plastic work in the cutting zone and friction at the tool chip interface. At the same time, workpiece loses heat to the environment due to convection and to tool due to conduction.
Halil Bil, A. Erman Tekkaya and S. Engin Kılıç.
3 COMPARISON OF RESULTS Table 1 shows the experimental results of chip thickness and shear angle, where γ is the rake angle, f is the feed rate, tc is the chip thickness, φ is the shear angle, which is calculated from the measured chip thicknesses. In all experiments, cutting speed is 125 rev/min. γ f (mm/rev) 0.05 0.1
20° tc (mm) 0.10 0.27
25° φ 29.54° 21.73°
tc (mm) 0.12 0.21
φ 24.62° 28.24°
Table 1: Experimental results of chip geometry parameters.
γ f (mm/rev) m=0.2 m=0.4 m=0.7
20 25 0.05 0.1 0.05 0.1 0.08 0.16 0.07 0.15 0.09 0.18 0.08 0.18 0.09 0.22 0.11 0.22 tc (mm)
20
25
0.05 0.1 0.05 0.1 31.62 30.77 34.83 33.63 28.01 30.97 32.39 29.01 28.45 25.61 27.73 27.39 φ (Strain Rate)
20
25
0.05 0.1 0.05 0.1 37.65 37.20 40.60 40.07 32.66 32.45 36.22 34.32 32.45 26.83 28.38 27.68 φ (Chip Thickness)
Table 2: Chip geometry results obtained by MSC.Marc
γ f (mm/rev) m=0.2 m=0.4 m=0.7
20 25 0.05 0.1 0.05 0.1 0.07 0.12 - 0.12 0.08 0.13 0.07 0.12 0.09 0.14 0.08 0.13 tc (mm)
20
25
0.05 0.1 0.05 0.1 32.74 38.74 33.42 29.60 37.41 29.93 31.36 33.69 33.69 26.57 29.28 φ (Strain Rate)
20
25
0.05 0.1 0.05 0.1 44.45 48.27 51.25 39.06 43.28 44.65 49.38 34.68 42.99 37.59 46.26 φ (Chip Thickness)
Table 3: Chip geometry results obtained by Deform2D
γ f (mm/rev) µ=0.2 µ=0.4 µ=0.5
20 0.05 0.09 0.103 0.11
25 0.1 0.05 0.1 0.18 0.09 0.18 0.211 0.10 0.20 0.23 0.10 0.21 tc (mm)
20
25
0.05 0.1 0.05 0.1 27.73 31.04 32.21 32.86 27.39 26.39 31.18 29.22 27.78 26.15 26.50 30.25 φ (Strain Rate)
20
25
0.05 0.1 0.05 0.1 32.92 32.02 34.72 33.93 28.59 27.97 30.71 30.24 26.82 25.89 29.53 28.35 φ (Chip Thickness)
Table 4: Chip geometry results obtained by Thirdwave AdvantEdge.
Table 2 shows the results from MSC.Marc. It can be concluded that for m=0.7, estimation of chip thickness is the best. Shear angle was found both by plotting the equivalent plastic strain-rate distribution and by calculating from the estimated chip thicknesses. By Deform2D (Table 3), chip thicknesses are estimated again better when the friction factor is 0.7. The shear
2
Halil Bil, A. Erman Tekkaya and S. Engin Kılıç.
angles, calculated from chip thicknesses, are not in agreement with the experiments. In addition, results of Deform2D are not consistent in itself. Table 4 shows the results from Thirdwave AdvantEdge. The results of both chip thickness and shear angle are in very good agreement with the experiments when the friction coefficient is taken as 0.5. In the view of above results, it can be concluded that the three commercial codes estimate the chip thickness and shear angle satisfactorily if an appropriate friction factor or coefficient is used. Table 5 shows the effect of friction on cutting and thrust forces. Contrary to the chip geometry variables, cutting forces are estimated better when the friction parameter is small. AdvantEdge predicts higher cutting forces than the other two codes due to Coulomb friction law, which supplies regardless of the magnitude of interface pressure a frictional stress that is proportional to this pressure. However, the pressure is very high, yielding a frictional shear stress, which is even larger than the shear strength of the material. Hence, the supplied frictional stress is not realistic. This is also the reason that AdvantEdge is giving better (bigger) thrust force predictions.
Deform2D
MSC.Marc
Experiments m=0.1 m=0.2 m=0.4 m=0.7 m=0.1 m=0.2 m=0.4 m=0.7 µ=0.2 µ=0.4 µ=0.5
AdvantEdge
AdvantEdge
Deform2D
MSC.Marc
Experiments m=0.1 m=0.2 m=0.4 m=0.7 m=0.1 m=0.2 m=0.4 m=0.7 µ=0.2 µ=0.4 µ=0.5
γ=20° γ=25° f=0.05 f=0.1 f=0.05 f=0.1 62.4 131.5 58.8 127.9 64 126 58 125 65 126 60 121 74 142 65 139 90 174 86 171 66 125 59 100 63 110 100 67 119 68 110 76 136 72 125 110 200 100 185 118 215 108 195 130 220 120 215 (a)
γ=20° γ=25° f=0.05 f=0.1 f=0.05 f=0.1 55.2 65 49.7 57 -13 -24 -16 -39 -10 -16 -14 -26 -4 -5 -9 -5 12 28 9 13 -23 -42 -25 -45 -22 -31 -38 -14 -24 -15 -32 -6 -10 -8 -21 18 10 15 5 26 30 20 20 35 45 30 32 (b)
Table 5: Comparison of Cutting (a) and Thrust (b) Force Results.
In the results of MSC.Marc and Deform2D, for small friction factors the tool appears to be drawn into the workpiece (thrust force is negative). The reason is that, for small friction parameters, the vertical component of normal force exceeds the normal component of friction force; hence the tool is pushed into the workpiece.
3
Halil Bil, A. Erman Tekkaya and S. Engin Kılıç.
4. CONCLUSIONS This study reveals the effects of friction, chip separation and material data in the simulation of orthogonal cutting. Friction parameter affects the simulation results drastically but tuning this parameter yield good agreement only for some variables in the range. A smaller friction parameter leads to good results for cutting force, whereas other variables (such as thrust force, shear angle) are computed more accurately with larger friction parameters. Therefore, the accuracy of a simulation must be assessed by examining all predictable process parameters. The plain Coulomb friction model is not appropriate for machining purposes since it supplies an unrealistic frictional stress.
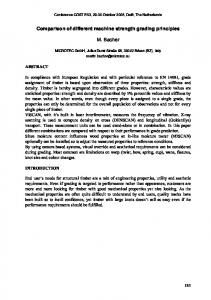
Figure 1: Crack generation during a remeshing step.
Although separation by remeshing gives better results, it is based on the misconception of crack generation in the material at the tool tip (Figure 1). After the penetration of tool into the material, a new mesh is defined with a new surface, which is bigger than the former surface with a constant volume. This is only possible by introducing a crack, which is independent from element size. In addition, the direction of this crack is not in the direction of shearing. Despite the extrapolation of flow curves by completely different procedures, no significant effect has been observed on the results. This may be due to the simultaneous effect of hardening due to high strain rates and softening due to the high temperatures. It should also be noted that none of the well known shear angle relationships are material dependent; hence the real effect of material behaviour can only be seen in the parameters such as temperatures, forces. 5. REFERENCES [1] [2] [3] [4]
H. Bil, Simulation of Orthogonal Metal Cutting by Finite Element Analysis, M.Sc. Thesis, Department of Mechanical Engineering, Middle East Technical University, Ankara, Turkey (2003). Third Wave Systems, Third Wave AdvantEdge Theoretical Manual v4.0, 7301 Ohms Lane – Suite 580, Minneapolis, MN 55439, USA. H. Borouchaki, A. Cherouat, P. Laug, K. Saanouni, “Adaptive Remeshing for Ductile Fracture Prediction”, C. R. Mecanique, 330, 709-716 (2002). E. Ceretti, P. Fallbohmer, W. T. Wu, T. Altan, “Application of 2D FEM to Chip Formation in Orthogonal Cutting”, Journal of Materials Processing Technology 59, 169-180 (1996).
4