3.12
DECADAL VARIATIONS OF MIXED LAYER DEPTH AND BIOLOGICAL RESPONSE IN THE SOUTHERN CALIFORNIA CURRENT
Hey-Jin Kim*, Arthur J. Miller, Douglas J. Neilson, and John A. McGowan Scripps Institution of Oceanography, UCSD, La Jolla, CA
1.
INTRODUCTION
The California current System (CCS) is highly variable and very productive. Many physical processes interact with biological productivity, mainly because they control the nutrient input system in the CCS. Roemmich and McGowan (1995) found that there is a warming trend of the surface ocean in the CCS, using the California Cooperative Oceanic Fisheries Investigations (CalCOFI) dataset, which resulted in a deeper thermocline depth and consequently reduced zooplankton productivity of about 70%. Thus, decadal variations of stratification are the important key to understanding biological responses to climate changes in the CCS. Coastal upwelling by Ekman transport at the California coast also has substantial effects on the biological productivity. Di Lorenzo et al. (2004) suggested isopycnal deepening of the Southern California Current System (SCCS) decreased input of cold nutrient-rich water from the deep ocean to the surface in spite of increased upwelling-favorable winds. In this paper, stratification changes are examined in more detail in terms of mixed layer depth (MLD) and thermocline depth. The data include both the 55year in-situ CalCOFI observations and the 40-year SODA-POP (Simple Ocean Data Assimilation – Parallel Ocean Program; update of Carton et al., 2000, courtesy of B. Giese, private communication) global ocean analysis product.
2.
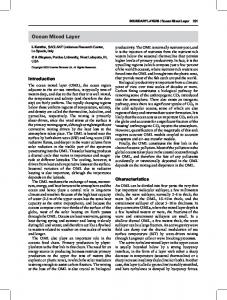
The CalCOFI program is an intense ongoing observational project, which started in 1949, and observes chemical and biological variables such as the major nutrients, chlorophyll and oxygen, as well as hydrographic variables of the California current. Stations maps and time periods are not regular for each cruise, and the key period for the climate regime shift, the 1970’s, does not have many cruises. The variable time step and station positions result in difficulty with dealing with CalCOFI dataset. However, the standard 66 stations have been repeated quarterly since 1984 (Fig. 1). 2.2 SODA-POP SODA-POP is a global ocean retrospective analysis using ERA-40 winds of ECMWF and World Ocean Database 2001. The horizontal resolution is 0.5o by 0.5o. Standard stations of CalCOFI are sampled from SODA to compare MLD fields. 2.3 MLD calculations Each hydrographic profile was interpolated to 1m vertical resolution through a piecewise cubic spline method. Two criteria were applied to calculate MLD. One is a fixed temperature o difference of 0.8 C between 10 m depth and MLD, and the other is a variable density difference from the 10 m depth corresponding to a temperature o change of 0.8 C.
DATA 3.
RESULTS
2.1 CalCOFI 3.1 Hydrographic data comparison *Corresponding author address: Climate Research Division, Scripps Institution of Oceanography, La Jolla, CA 92093-0224
[email protected]
A TS diagram of Line 93 shows that SODAPOP reproduced the observed temperature data very well, but not salinity (Fig. 2). Temperature o o ranges are very well matched (6 C – 18 C), but
CalCOFI salinity has a broader range than SODAPOP. CalCOFI temperature sections along line 93 have a pattern similar to SODA-POP, whereas salinity sections show a more variable spatial pattern (not shown). SODA-POP temperature is very reliable in this study area. Fig. 3 is a time series of average temperature of the upper ocean from the surface to 100m demonstrating that both datasets show a clear warming trend, as was found by Roemmich and McGowan (1995). They are especially well matched since the mid-1980’s. There is a missing period of CalCOFI in-situ data in the 1970’s. 3.2 Mixed layer depth comparison CalCOFI and SODA-POP show significant decadal variations of MLD. Fig. 4 a is space-time plot of MLD fields of CalCOFI and SODA-POP, which both show deepening of MLD. The average MLD of CalCOFI before the climate regime shift in 1977 deepened by 6% after the shift. The average SODA-POP MLD deepened by 7% after the shift for the same time periods.
4. SUMMARY CalCOFI in-situ data were compared to SODA-POP reanalysis. SODA-POP reproduced the temperature field reliably, but not salinity. CalCOFI and SODA-POP show significant post-
1976-77 shift deepening of MLD, which is consistent with Roemmich and McGowan (1995) and Di Lorenzo (2004). This upper-ocean warming may decrease input of nutrient-rich deep water to the ocean surface.
4. REFERENCES Carton, J. A., Chepurin G, Cao X.H., and Giese B., 2000: A Simple Ocean Data Assimilation analysis of the global upper ocean 1950-95. Part I: Methodology. J. Phys. Oceanogr., 30, 294-309. Di Lorenzo, E., A. J. Miller, N. Schneider and J. C. McWilliams, 2004: The warming of the California Current: Dynamics, thermodynamics, and ecosystem implications. J. Phys. Oceanogr., in press Hayward, T. L., and Venrick E. L., 1998: Nearsurface pattern in the California Current: coupling between physical and biological structure. Deep-Sea Res., 45, 1617-1638. McGowan, J. A., S. J. Bograd, R. J. Lynn and A. J. Miller, 2003: The biological response to the 1977 regime shift in the California Current. Deep-Sea Res, 50, 2567-2582. Roemmich, D., and J. McGowan, 1995: Climatic warming and the decline of zooplankton in the California Current. Science, 267, 13241326.
18
16
9
36
Latitude
14 Temperature
38
34
12
10
8 32
SODA
6 30
CalCOFI
4 32.8 28 -128
-126
-124
-122
-120 Longitude
-118
-116
-114
Fig 1. Standard station map of CalCOFI (starting in 1984), and horizontal model grid of SODA-POP o
o
(0.5 by 0.5 ).
33
33.2
33.4
33.6 33.8 Salinity
34
34.2
34.4
34.6
-112
Fig 2. TS diagram of CalCOFI (blue dot) and SODA-POP (black square) along Line 93.
18
17
Temperature
16
15
14
Fig. 3. Time series of the upper ocean average temperature along Line 93.
13
CalCOFI, and blue dots are SODA-POP.
SODA CalCOFI
12
Red dots are Both
show warming trend of the upper ocean clearly. 11 1960
1970
1980
1990
2000
Year
2000 100
1995
90
1990
70 65
1990
60
80 70
1980
60 50
1970
Time (Year)
Time (Year)
1985 55 1980
50
1975
45 40
40 1970
35
30
1960
20 -122
-121
-120 -119 Longitude
-118
-117
1965 1960 -124
30 -123
-122
-121 -120 Longitude
-119
-118
-117
Fig. 4 Hovmoller diagram of MLD calculated by CalCOFI (a) from 1950 to 2002, and SODA-POP (b) from 1960 to 1999.
Axis limits are different.
Black dots of (a) are data points of CalCOFI observation.