theoretical models [Kitaigorodsky, 1960; Kraus and Turner,. 1967; Tuner and Kraus, 1967] were developed to explain the thermal structure of the oceans and its ...
JOURNAL
OF GEOPHYSICAL
RESEARCH,
VOL. 88, NO. C10, PAGES 5987-5996, JULY 20, 1983
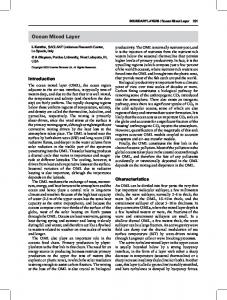
Surface MixedLayerTemperature andLayer Depthin WaterOff the ArgentinianCoast SILVIA BLANC AND GUSTAVO GO•I Departamento Oceanografi•, $ervtcto de Htdrograft• Naval, 1271 BuenosAires, Argentina
JORGE NOVARINI Departamento de Investigactdn,$ervtctoNaval de Inve•lgactdn y Desarrollo, 1638 Vicente L6pez, Pcta. de BuenosAires, Argentina
Analysisof 26 yearsof bathythermographic data is usedto describethe connectionbetweenthe sea surfacetemperatureand the layer depthin the westernSouthAriantic, off the Argentiniancoast.The area is influencedby the presenceof two water masses,subtropicalwatersand subantarcticwaters.A seasonalanalysiswas carried out for $o squares.The plotting of mixed layer depth versussurface temperature providestwo types of patterns. Evidencesuggests that they might be related to the presenceof each of the above-mentionedwater masses.A clearrelationshipwasfound for data distribution in eachsubarea.The exponentialfunctionL = a exp (-bTs) wasfound to fit bestthe dependenceof the mixed layer depth (L) on the surfacetemperature(Ts). Very defferent rangeswere empirically found for the real constantsa and b dependingon the predominantwater massin each subarea.
INTRODUCTION
of the two above-mentioned
currents can be visualized.
As
it is well known, the confluenceof both currentsgivesrise to the so-called Convergence Zone , where both northern
The sea surface temperature and its relationship with the thermoclinedepth have been the subjectof a large num- and southern boundaries are not well defined. This has been ber of studies in the last 30 years [Munk and Anderson, pointed out by Sverdrupet al. [ 1946], who mentionedthat 1948; Mazeika, 1960; Tully, 1964; Kenyon, 1978]. Many the location of the Subtropical Convergenceis less well theoretical models [Kitaigorodsky, 1960; Kraus and Turner, defined than the Antarctic Convergence,and, consequently, 1967; Tuner and Kraus, 1967] were developedto explain he considered it more correct to refer to a region instead of the thermal structure of the oceans and its temporal and referring to a line of convergence[Defant,1938]. spatial variations.The problem is quite complex becauseit Figure 1 schematically shows the distribution of the involves several physical processes. Accordingly, such water massesin the studied area according to Boltovskoy modelshold only for local geographicalregions. [1970]. It should be emphazisedthat this configuration is Despite the large amount of data existing for the only a grossapproximation to the actual distribution since northern hemisphere,there is little information availablein the location of the ConvergenceZone is highly dependent the South Atlantic Ocean and especially near the Argen- on seasonal variations. tinjan coast.In the presentwork, about 9100 bathythermograms (BT) from the western South Atlantic Ocean off the MIXED LAYER DEPTH VERSUS SURFACE Argentinian coast, collected over the period 1954-1980, TEMPERATURE were analyzed. The aim of this paper is to explore the relaThe area was divided in 12 5ø square for data av.lysis. tionship between the sea surface temperature and the mixed layer depth. Seasonal as well as geographicalvaria- Mixed layer depth is establishedas the top of the seasonal tions have been studied. Two distinctive relationshipswere thermocline, that is the level where the temperature observed that seem to be correlated with the presenceof gradient is more than 0.2 ø C per 20 m. Mixed layer depth different water masses. versus surface layer temperature was plotted for every seasonof the year in each of the above-mentionedsubareas. AREA CHARACTERISTICS Figures 3 and 4 show the results for two adjacent The shaded area shown in Figure 1 represents the geo- subareas(35 ø S to 40øS, 50øW to 55øW and 35øS to 40øS, 55 ø W to 60 øW). It was found that those subareasmainly graphicalregion for which the BT's were analyzed. According to the traditional classification[Deacon, influenced by the Subtropical Water Massexhibit a pattern 19331 in the above-mentionedarea, there are two water as that shown in Figure 3. Subareas influenced by the masses(see Figure 1), namely, subtropicalwaters(transpor- Subantarctic Water Mass exhibit a pattern as shown in Fited by the Brazil current) characterized by its high salinity gure 4 which seemsto be the mirror image of that shown in and temperature values and subantarcticwaters (in which Figure 3._For the ConvergenceZone, the relationshipis not Malvinas current [Gordon, 19811 becomes predominant) well defined, and both types of patterns occur simultacharacterizedby lower values of salinity and temperature. neously. Figure 2 shows a current pattern [Sverdrup et al., The two above-mentioned distinctive patterns are 19461 for the studied area, where the predominant effects schematically represented in Figure 5. In Figure 6, each subareais labeledwith lettersA or B, accordingto which of the two types of patterns, shown in Figure 5, it exhibits. Copyright 1983 by the AmericanGeophysicalUnion. Althouh
Papernumber2C1935. 0148-0227/83/002C- 1935 $05.00
all data turned
out to be distributed
accor-
ding to one of the two patterns mentioned above, it must be pointed out that data density was found to be nonuni-
5987
5988
BLANC
70 o
60 ø
ET AL.:
50 o
MIXED
LAYER
OFF
ARGENTINA
provided the exponential function (equation (1)) as the
45 o
best fit.
BUENOS AIRES
! !
i
i%
!:
y
.
,
.-
'
.
Figure 11 shown the regressionlines through the data plots, correspondingto spring, for six different subareas out of the entire area under study. The calculated correlation coefficients are included in each plot as well as the predominant water massin each of these subareas. It can be observedthat the plots shown in Figure 11 are good examples of the two types of patterns (see Figure $) and their apparent correlation with the presenceof a parti-
=-•_•WATER MASS ,.t
..'•
j,
..:J
cular water mass.
."'/
Following the two distinct relationships mentioned above, two very different ranges of values were
empirically found for the constantsa and b. For all the subareasinfluenced by the Subtropical Water Mass,
....ii
0.45 m