3D Graphics Benchmarks for Low-Power Architectures Iosif Antochi, Ben Juurlink, Stamatis Vassiliadis Computer Engineering Laboratory, EEMCS Delft University of Technology Mekelweg 4, 2600 GA Delft, The Netherlands Phone: +31 15 2783644 Fax: +31 15 2784898 E-mail: {tkg|benj|stamatis}@ce.et.tudelft.nl Abstract—Currently, there is much interest in wireless 3D graphics applications, in particular games. Since current 3D graphics accelerators consume too much power to be employed in mobile computing devices, several companies and universities have started to develop low-power 3D graphics accelerators. However, to the best of our knowledge, there is no publicly available benchmark suite appropriate for evaluating such devices. In this paper we present a set of 3D graphics benchmarks which can be considered typical 3D workloads of contemporary and emerging mobile devices. First, reasons why most 3D benchmarks employed for desktop computers are not suitable for mobile environments are given. After that, simulation results such as the number of triangles or fragments processed by a typical rasterization pipeline are presented. Finally, we discuss some architectural implications of the obtained results for low-power implementations.
I. I NTRODUCTION In recent years, mobile computing devices have been used for a broader spectrum of applications than mobile telephony or personal digital assistance. Several companies expect that 3D graphics applications will become an important workload of wireless devices. For example, according to [1], the number of users of interactive 3D graphics applications (in particular games) is expected to increase drastically in the future: it is predicted that the global wireless games market will grow to 4 billion dollars in 2006. Because current wireless devices do not have sufficient computational power to support 3D graphics in real time and because present accelerators consume too much power, several companies and universities have started to develop a low-power 3D graphics accelerator. However, to the best of our knowledge, there is no publicly available benchmark suite that can be used to guide the architectural exploration of such devices. The goal of this paper is to propose a set of benchmarks that represents the types of 3D applications that might be run on low-power, mobile systems. These benchmarks were collected to facilitate our own studies on low-power 3D graphics accelerators. It includes several games as well as virtual reality applications such as 3D museum guides.
18
Petri Liuha NOKIA Research Center Tampere, Finland E-mail:
[email protected]
Applications were selected on the basis of several criteria. For example, CAD/CAM applications, such as contained in the Viewperf package [3], were excluded because it is unlikely that they will be offered on mobile devices. Other characteristics we considered are resolution and polygon count. A second goal of this paper is to provide a quantitative workload characterization of the collected benchmarks. For each benchmark, we collected several statistics such as the average and maximum numbers of triangles before and after culling, the number of resulted fragments and the total required texture memory. Such statistics could be used to guide the development of low-power 3D graphics architectures. This paper is organized as follows. Previous work on 3D graphics benchmarking is described in Section II. In this section we also give reasons why most current 3D graphics benchmarks are not appropriate for mobile environments. Section III describes our tracing environment, the simulator we used to collect the statistics, and the components of the proposed benchmark suite. Section IV provides a workload characterization of the benchmarks and discusses some architectural applications. Conclusions and directions for future work are given in Section V. II. R ELATED W ORK To the best of our knowledge, 3D graphics benchmarks specifically targeted at low-power architectures have not been proposed. One well-known benchmark suite used to evaluate 3D graphics accelerator cards employed in desktop computers is SPEC’s Viewperf [3]. Most benchmarks contained in the Viewperf package, however, are not suited for evaluating low-power 3D graphics architectures for the following reasons: • The Viewperf benchmarks are designed for highresolution output devices, but the output devices of current wireless systems have a limited resolution. Specifically, by default the Viewperf package is running at resolutions above SVGA (800x600 pixels), while current mobile devices use at most VGA (640x480) resolution.
The benchmarks use a large number of polygons in order to obtain high picture quality (most benchmarks have more than 20,000 triangles per frame [4]). Translated to a mobile platform, most rendered polygons will be smaller than one pixel so their contribution to the generated images will be small or even invisible. Specifically, the polygon count of the Viewperf benchmarks DRV, DX, ProCDRS, and MedMCAD is too high for mobile devices. Moreover, they are using rendering modes (wire-frame or shaded models) that are not encountered on low-power 3D graphics devices. • Some benchmarks are CAD/CAM applications. It is unlikely that such applications will be offered on mobile platforms. Except Viewperf, there are no publicly-available, portable 3D graphics benchmark suites. There have been several studies related to 3D graphics workload characterization (e.g., [4][15]). Most related to our investigation is the study of Mitra and Chiueh [4], since they also considered dynamic, polygonal 3D graphics workloads. Dynamic means that the workloads consist of several consecutive image frames rather than individual images, which allows to study techniques that exploit the coherence between consecutive frames. Polygonal means that the basic primitives are polygons, which are supported by all existing 3D chips. The main differences between that study and our workload characterization are that Mitra and Chiueh considered high-end applications (Viewperf, among others) and measured different statistics. •
III. T HE B ENCHMARK S ET In this section are described the environment we used to create some of the benchmarks, the components of our benchmark set and also some general characteristics of the workloads. A. Tracing Environment Due to their interactive nature, 3D games are generally not repeatable. In order to obtain a set of repeatable workloads, we traced existing applications, logging all OpenGL calls. Our tracing environment consists of two components: a tracer and a trace player. Our tracer is based on GLtrace from Hawksoft [6]. It intercepts and logs OpenGL calls made by a running application, and then calls the OpenGL function invoked by the application. No source code is required provided the application links dynamically with the OpenGL library, meaning that the executable only holds links to the required functions which are bounded to the corresponding functions at run-time. Statically linked applications, in
19
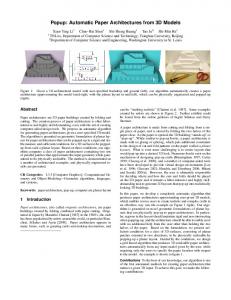
which case the required libraries are encapsulated in the executable image, cannot be traced using this mechanism when the source code is not available. We improved GLtrace in two ways. First, GLtrace does not log completely reproducible OpenGL calls (for example, textures are not logged). We modified the GLtrace library so that the OpenGL calls used by the targeted applications are completely reproducible. Second, the trace produced by GLtrace is a text trace, which is rather slow. We improved its performance by adding a binary logging mode that significantly reduces the tracing overhead. In addition, we developed a trace player that plays the obtained traces. It can play recorded frames as fast as the OpenGL implementation allows. It does not skip any frame so the workload generated is always the same. The workload statistics were collected using our own OpenGL simulator based on Mesa [9], which is a freely available implementation of OpenGL. B. The Benchmarks The proposed benchmark suite consists of the following components: • Q3L and Q3H. Quake III [10] or Q3, for short, ( depicted in Figure 1) is a popular interactive 3D game, belonging to the shooter games category. We used two profiles for this workload in order to determine the implications of different image sizes and object complexity. The first profile, which will be referred to as Q3H, uses a relatively high image resolution and objects detail. The second profile, Q3L, employs a low resolution and objects detail. Q3 makes extensive use of blending operations in order to implement multiple texture passes. • Tux Racer (Tux) [11]. This is a freely available game that runs on Linux. The goal of this game is to drive a penguin down a mountain terrain as quickly as possible, while collecting herring. Tux makes extensive use of automatic texture coordinate generation functions. • AWadvs-04 (AW) [3]. This test is a component of the Viewperf 6.1.2 package. In this test a fully textured human model is viewed from different angles and distances. As remarked before, the other test in the Viewperf package are not relevant for low-power accelerators, because they represent high-end applications or are from an application domain not likely to be offered on mobile platforms. • ANL, GRA, and DIN. These three VRML scenes were chosen based on their diversity and complexity. ANL is a virtual model of Austrian National Library and consists of 10292 polygons, GRA is a model of Graz University of Technology, Austria and consists of 8859 polygons, and Dino (DIN) is a model of a dinosaur consisting of 4300 polygons. In order to obtain a workload similar to one
(a) Q3
(b) Tux
(c) Aw
(d) Nat Lib
(e) Gratz
(f) Dino
Fig. 1. The benchmark suite components
that might be generated by a typical user, we created “flyby” scenes. Initially, we used VRWeb [12] to navigate through the scenes, but we found that the VRMLView [13] navigator produces less texture traffic because it uses the glBindTexture mechanism. Our benchmarks set is the result of extensive searching on the World Wide Web. Although there are more OpenGL applications available, most represent high-end applications and thus are not suited to evaluate low-power 3D graphics architectures. Recently, several links to 3D games were provided on Mesa’s website (www.mesa3d.org). However, these games such as Doom, Heretic, and Quake II belong to the same category as Quake III and Tux Racer, and therefore do not represent benchmarks with substantially different characteristics. We expect that more 3D graphics applications for low-power mobile devices will appear when accelerators for these platforms will be introduced. For example, recently the Khronos group proposed a lightweight version of OpenGL called OpenGL ES [5], which is supposed to be a better match for mobile and embedded platforms.
20
IV. B ENCHMARKS S TATISTICS Tables I,II, and III present some statistics of the workloads. The characteristics and statistics presented in these tables are: • Image resolution. A low-power accelerator should be able to handle scenes with a currently typical resolution of 320x240 pixels. Since in the near future the typical resolution is expected to double we decided to use a resolution of 640x480. For the Q3 benchmark we have also included the results a lower (320x240) resolution in order to study the impact of changing the resolution. • Frames. The total number of frames in each test. • Avg. triangles. The average number of triangles sent to the rasterizer per each frame. • Avg. processed triangles. The average number of triangles per frame, that remained after back-face culling, i.e., the triangles that remained after eliminating the triangles that are invisible because they are facing in the same direction as the view angle. • Avg. total area. The average number of fragments/pixels after scan conversion per each frame. • Texture size. This quantity gives an indication of the
Benchmark Q3L Q3H Tux AW ANL GRA DIN
Resolution 320x240 640x480 640x480 640x480 640x480 640x480 640x480
Frames 1,379 1,379 1,363 603 600 599 600
Texture Mem. (MB) 12.84 12.84 11.71 3.25 1.8 2.1 1.7
TABLE I G ENERAL CHARACTERISTICS OF THE BENCHMARKS
Benchmark
Avg. Triangles
Q3L Q3H Tux AW ANL GRA DIN
4,504 4,591 2,985 23,336 4,458 4,901 4,151
Avg. Processed Triangles (PT) 3,245 3,361 1,801 10,551 4,458 3,682 4,151
Avg. Area 422k 1,678k 760k 63k 776k 245k 153k
TABLE II G ENERAL STATISTICS OF THE BENCHMARKS (AVERAGES )
Benchmark
Max. Triangles
Q3L Q3H Tux AW ANL GRA DIN
9,706 9,802 4,809 25,720 14,236 10,475 4,313
Max. Processed Triangles 6,829 6,979 2,964 13,931 14,236 6,907 4,313
Max. Area 1,327k 5,284k 1,224k 307k 1,242k 325k 259k
TABLE III G ENERAL STATISTICS OF THE BENCHMARKS (M AXIMUMS )
amount of texture memory required. • Maximum triangles per frame. The maximum number of triangles that were sent for one frame. Because most 3D graphics accelerators implement only the rasterization function, this statistic is an approximation of the bandwidth required for geometry information, since triangles need to be transferred from the CPU to the accelerator via a system bus. We assume that triangles are represented individually. Sharing vertices between adjacent triangles al-
21
lows to reduce the bus bandwidth required. This quantity also determines the throughput required in order to achieve real-time frame rates. We remark that the maximum number rather than the average number of triangles per frame determines the required bandwidth and throughput. • Maximum processed triangles per frame. The maximum number of triangles that remained after back-face culling, over all frames. • Maximum area per frame. The maximum number of
fragments after scan conversion, over all frames. Several observations can be drawn from Table III. First, it can be observed from the column labeled “Max triangles per frame” that the scenes generated by Tux and Dino have a relatively low complexity, that Q3, ANL, and Graz consist of medium complexity scenes, and that AW produces the most complex scenes by far. Second, back-face culling is effective in eliminating invisible triangles. It eliminates approximately 30% of all triangles in the Q3 benchmarks, 24% in Graz, and more than half (55%) of all triangles in AW. It does not eliminate any triangle in the ANL and Dino workloads, because it was not enabled. If we consider the largest number of triangles remaining after backface culling (14236 for ANL) and assume that each triangle is represented individually and requires 28 bytes (xyz coordinates, 4 bytes each, rgb for color and alpha for transparency, 1 byte each, and uvw texture coordinates, 4 bytes each) for each of its vertices, the required bus bandwidth is approximately 1.2MB/frame or 35.9MB/s to render 30 frames per second. Another observation that can be drawn from Tables II and III is that the AW and DIN components have an average number of triangles almost equal to their maximum number of triangles, while for the rest of the components the average number of triangles is about 50% of the maximum number of triangles. The same observation is also valid for the number of processed triangles. The implication of this observation is that if a rasterization accelerator is designed to have a sustained triangle processing rate close to the maximum values (to ensure a real-time frame generation, in most of the cases it might not be used to its full potential and thus it could normally operate at a lower frequency in order to reduce the power consumption. Finally, we remark that the largest amount of texture memory (as presented in Table I) is required by the Q3 and Tux benchmarks, and that the other benchmarks require a relatively small amount of texture memory. Other relevant observations obtained from the simulation results are: The Q3 benchmark is quite scalable and the results obtained for the low resolution profile (Q3L) are similar with the results obtained for the high resolution profile (Q3H). The Q3 benchmark can be characterized as an application that uses textures for most of its primitives. The Tux component is also using textures for more than 70% of its primitives, and it also uses the fog unit. The AW component does not use the scissor test as the others are doing and it has no pixels rejected at the depth test. Another difference from the previous components is that AW is also using the dithering mechanism, which allows it to produce better looking images on devices with a low color depth.
22
V. C ONCLUSIONS AND F UTURE W ORK Although high-end 3D graphics benchmarks have been available for some time, there are no benchmark suites dedicated to low-power 3D graphics accelerators. In this paper we have described a set of relevant applications for low-power 3D graphics accelerators performance evaluation. Also one of the objectives of this paper was to provide a quantitative workoad characterization that can be used by 3D graphics designers. While most of the benchmarks have a significant difference between the average processed number of primitives and the maximum, there are some which have no difference at all, thus producing almost the same load for all the frames. As future work, we intend to extend the number of components for this benchmark suite and we also intend to extend the statistics to include results from low-power graphics architectures that are using a tile-based rendering mechanism. R EFERENCES [1] [2] [3] [4]
[5] [6] [7] [8] [9] [10] [11] [12]
[13] [14]
[15]
ARM Ltd., ARM 3D Graphics Solutions. Available at http://www.arm.com/armtech/5D9JZR/$File/MBXWhitePaper.pdf. Yonsei University, 3D Graphics Accelerator Group, http://msl.yonsei.ac.kr/3d/ SPEC, SPECviewperf 6.1.2, Available at http://www.specbench.org/gpc/opc.static/opcview.htm. Tulika Mitra and Tzi-cker Chiueh, Dynamic 3D Graphics Workload Characterization and the Architectural Implications, 32nd ACM/IEEE Int. Symp. on Microarchitecture (MICRO), November 1999, Haifa, Israel, pp. 62-71. The Khronos Group, OpenGL ES Overview, Available at http://www.khronos.org/opengles/index.html. Hawk Software, GLTrace Programming Utility, Available at http://www.hawksoft.com/gltrace/. Stanford University, GLSim & GLTrace, Available at http://graphics.stanford.edu/courses/cs448a-01-fall/glsim.html SourceForge, spyGLass: an OpenGL call tracer and debugging tool, Available at http://www.hawksoft.com/gltrace/. The Mesa Project, The Mesa 3D Graphics Library, Available at http://www.mesa3d.org. Id Software Inc., Quake III, Available at http://www.idsoftware.com. Sunspire Studios, Tux Racer, Available at http://tuxracer.sourceforge.net/. Michael Pichler, Gerbert Orasche, Keith Andrews, Ed Grossman, and Mark McCahill, VRweb: a multi-system VRML viewer, Proc. of the First Symposium on Virtual Reality Modeling Language, 1995, San Diego, California, United States, pp. 77-85. Systems in Motion, VRMLView, Available at http://www.sim.no I. Antochi, B.H.H. Juurlink, A. G. M. Cilio, P. Liuha, Trading Efficiency for Energy in a Texture Cache Architecture, Proc. of the 2002 Euromicro Conference on Massively-Parallel Computing Systems, April 2002, Ischia, Italy, pp. 189-196. J.C. Dunwoody and M.A. Linton. Tracing Interactive 3D Graphics Programs, Proc. of ACM Symposium on Interactive 3D Graphics, 1990.