th
Proceeding 8 International Seminar on Industrial Engineering and Management ISSN : 1978-774X
3D SOLAR SYSTEM VISUALIZATION WITH OpenGL Feby Fitria1, Riri Safitri2 Informatics Engineering, Al Azhar Indonesia University, Jakarta, Indonesia
[email protected],
[email protected]
ABSTRACT Computer graphics is the process of making the design, 2D, 3D and animation of an object. Computer graphics can do many things, including modeling, simulation and visualization of an object or a problem. Modeling is a representation of how people describe or explain an object, system, or a concept, which is usually manifested by simplification or idealization. This can be represented by physical models (mockups, prototypes), the model image (design drawings, computer images), or mathematical formulas. Visualization can also be done to facilitate the delivery of a material in a formal classroom or school. Solar system is a set of celestial bodies bound by gravitational forces. The movement of celestial bodies like the sun, stars, planets and the other will be more easily understood if taught through visualization movement through computer animation. This visualization shows the solar system planetary motion, or we can call it a revolution, that is, when the planets move around the sun, and remain in orbit each using OpenGL API to represent the solar system as a visual. OpenGL support this modeling capability as OpenGL has additional features to better produce something more realistic. OpenGL allows us to create a graph that can be run on any operating system only minor adjustments. Keywords: Modeling, Solar System, Revolution, Planet.
1. INTRODUCTION The development of technology has increased very rapidly and can be found in almost all areas of human life, author can find one of them in the field of education. Nowadays, education learning is using technology in order to perform the delivery of material will become more interesting and easy memorable. The use of technology in education can be implemented with a visualization on a subject of study. The study of the solar system for example, by using the visualization of objects in the solar system would facilitate teachers for the delivery of content. Visualization of the solar system is modified in graphic or animation to display a collection of celestial objects that consist a large star called the sun, and all objects that are bound by the force of gravity. The objects are eight planets that make a revolution or rotation of the sun and remain in orbit respectively. Based on the things that have been described in the background of the problem,
DSS-94
the author identify some of the problems that exist, there are: 1. How does the process of making the visualization of the solar system? 2. How to implement a visual method of learning about the solar system? Many problems that can occur, then the author will limit these problems by: 1. This solar system visualizer application using API OpenGL. 2. This application only displays real comparison of the diameter, distance, lane orbital trajectory, and speed of the planets around the sun. The purpose of this application is as follows: 1. To create a visualization of the solar system. 2. To apply the visual method of learning about the solar system. The benefits of the research are as follows: 1. In order to be used as a reference in the process of visualization of the solar system.
3D Solar System Visualization (Feby Fitria)
th
Proceeding 8 International Seminar on Industrial Engineering and Management ISSN : 1978-774X
2. In order to be used as a reference to learn about the solar system. 3. For an application that is created can be used for the learning process of the solar system 2. THEORETICAL BACKGROUND 2.1 Computer Graphics Computer graphics is concerned with all aspects of producing pictures or images using a computer (Angel, 2012). Computer graphics is the process of transforming a 3D model of the object in the form of geometric shapes, position, color, texture, and lighting into 2D images. Edwar Angel in his book: Interactive computer graphic divide the applications of computer graphics into 4 major areas (Angel, 2012): 1. Display of information 2. Design 3. Simulation and animation 4. User interfaces
Figure 2. OpenGL rendering pipeline (Neider, 1997) In general, to create graphics with OpenGL should note a few steps, as shown in the following figure:
Figure. 3 General Structure of OpenGL Program (Shreiner, 2004) 2.3 Transformation In addition to the position and orientation of the camera can be permuted, by naturally objects can also switch to the position and orientation relative to the others. Modelling transformation is used for object manipulation, such as translation, rotation and scaling. Figure 1. Some Applications of Computer Graphics (Wright, 2011) 2.2 OpenGL OpenGL is a computer graphics rendering API or we can say that OpenGL is a library for doing computer graphics. OpenGL is designed as a streamlined, hardwareindependent interface to be implemented on many different hardware platforms. OpenGL can used to create an interactive applications that render high-quality color images composed of 3D geometric objects and image. 3D Solar System Visualization (Feby Fitria)
Transformation of objects can be represented in several ways, namely: 1. using the transformation matrix (glLoadMatrix) 2. using the transformation operations (glRotate, glTranslate) 3. change the status of OpenGL projection mode with command glMatrixMode (GL_MODELVIEW).
DSS-95
th
Proceeding 8 International Seminar on Industrial Engineering and Management ISSN : 1978-774X
6. The orbit of each planet Tracks Display every planetary orbit. 3. RESEARCH METHOD
Figure 4. Translating and rotating an object (Neider, 1997) in order to specifying the viewing volume we want displayed in the window and how it should be transformed, we have to specify the projection first. Projection transformation are divided in two types (Wright, 2011): 1. Perspective projection The viewing volume of the this projection is something like a pyramid with the top shaved off. This projection add the effect that distant objects appear smaller than nearby objects. 2. Orthographic projection Orthographic or parallel projection specifying a square or rectangular viewing volume. All objects with the same dimension will appear with the same size, regardless of the position of objects far or near. 2.4 Material Material of the solar system based on discussion as needed for design, there are: 1. The composition of the solar system Displays information about the sun and the order of the planets and their orbital trajectory. 2. Various planets Displays the names of the planets in order. 3. The size of the planet Displaying diameter comparison by the actual size of the planet and visualization. 4. Distance planet to the sun Displaying diameter comparison by the actual distance of the planet and visualization. 5. The revolution speed of each planet Revolution speed comparison by the actual speed of the planet and the visualization
DSS-96
Stages of making solar system visualization: 1. Declare all the attributes that needed for the keyboard function and rotation. 2. Set the speed of rotation of each planet, because the speed of each planet to make one revolution is different. 3. Create the sun with a solid sphere, set the size, and position in the center point (0,0,0) so that the sun became the center of planets that will be surrounding them. 4. Create the planets Mercury, Venus, Earth, Mars, Jupiter, Saturn, Uranus, Neptune with a solid sphere, set the size of each planet, and the planet's position in accordance with the ratio of the actual distance. 5. Set the revolution of each planet. 6. Create the orbit of each planet, with torus (ring), set torus in the center, so the planets will move around the sun, and still remain in orbit. 7. Create Keyboard function for regulating the movement of the display. 8. Input the Sound, for make it look like more interesting. 9. Adjust the lighting to give a 3D effect. In this visualization,user can interacts with the application to perform transformation against planets. Users can do the translation and rotation against 3d planets, and can also plays music to accompanying the visualization of the solar system. User can interact with the application by keyboard function as follows: a : translate to left d : translate to right w : translate up s : translate down e : zoom in q : zoom out x : rotate in x axis y : rotate in y axis z : rotate in z axis p : plays music
3D Solar System Visualization (Feby Fitria)
th
Proceeding 8 International Seminar on Industrial Engineering and Management ISSN : 1978-774X Start
Configure and open a window
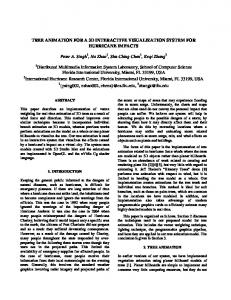
Author do some action with keyboard function, for example author change the x rotation, so the appearance will be like this
Initialize OPenGL’s state
Draw an 3D Solar System
Press a Key
Process object state based on the keyboard function
End
Figure 5. Flowchart of the visualization 4. RESULT AND DISCUSSION 4.1 Interface design The first appearance is animation of planet movement, they move around the sun automatically, and it also give general information about the solar system.
Figure 7. Ssolar system seen in X rotation Then, author do some action with keyboard function again, for example author change the user view, with zoom in, so the appearance will displayed like the picture below:
Figure 8. Planets on the orbits-zoom in
Figure 6. Screen Shoot of the animation 3D Solar System Visualization (Feby Fitria)
DSS-97
th
Proceeding 8 International Seminar on Industrial Engineering and Management ISSN : 1978-774X
4.2 Comparison 4.2.1 Size of Planet Table 1. Size of Planets diameter Planets real opengl Sun 1391684 278336.8 Mercury 4879 975.8 Venus 12104 2420.8 Earth 12742 2548.4 Mars 6779 1355.8 Jupiter 139822 27964.4 Saturn 116464 23292.8 Uranus 50724 10144.8 Neptune 49244 9848.8 (sumber: https://pds.jpl.nasa.gov/planets)
The real data about diameter of the planet, author get from nasa official website. Author do a comparison scale of diameter for used in OpenGL, author apply the same formula on each planet, formula is a real diameter divided by 5, to make the size to be small. So the scale is 5:1. 4.2.2 Distance of Planet from The Sun The real data about distance of the planet, author get from nasa official website. Author do a comparison scale of distance for used in OpenGL, author apply the same formula on each planet, formula is visual planet distance plus a real diameter of the sun, to make the right position in coordinat. Because the distance is measured from the outer surface of the sun. So the scale is 1000:1. Table 2. Distance of Planet from the Sun distance (x1000 km) Planets real opengl Sun 0 0 Mercury 5791 284127.8 Venus 10821 289157.8 Earth 14960 293296.8 Mars 22794 301130.8 Jupiter 77841 356177.8 Saturn 142672 421008.8 Uranus 287097 565433.8 Neptune 449825 728161.8 (sumber: https://pds.jpl.nasa.gov/planets)
DSS-98
4.2.3 Speed of Each Planet Revolution Table 3. Speed of Each Planet Revolution revolution(year) Planets real opengl Sun Mercury Venus Earth Mars Jupiter Saturn Uranus Neptune
0 0.24 0.62 1 1.88 11.86 29.45 84.02 164.79
0 41.66666667 16.12903226 10 5.319148936 0.84317032 0.339558574 0.119019281 0.060683294
(sumber: https://pds.jpl.nasa.gov/planets)
The real data about speed of each planet revolution obtained from Nasa official website. Author do a comparison scale of speed or revolution for used in OpenGL, author apply the same formula on each planet. In OpenGL, the larger number have a faster movements. Then author did a comparison of the speed of the earth, with another planet. Each velocity divided by the speed of the earth, then the planet which is have a faster revolution than the earth, it will have a larger number than the Earth. Then author multiply with10, to make a movement can be seen at OpenGL. So the scale is 1:10 5. CONCLUSION Based on the results of discussion that has been done, the authors can conclude that: 1. Animation circulation of planets around the sun interface design is the design of the visual and interpretive models designed. 2. Application of learning visualization of the solar system was designed using API OpenGL that can facilitate computer users to know the objects of the solar system and the solar system information more easily Advice can be given by the author in connection with the limitations of the system is built, is:
3D Solar System Visualization (Feby Fitria)
th
Proceeding 8 International Seminar on Industrial Engineering and Management ISSN : 1978-774X
1. The author sincerely hope the development of imagination and the ability to process a multimedia device that is imaginary with supporting software utilization growing. 2. The author also hopes the necessity of adding multimedia animation, and texture for better and have a variety of materials, so that users can more enjoyed this application. 6. REFERENCES (a) Angel, Edward, 2012. Interactive computer graphics: a Top-Down Approach with Shader-Based OpenGL 6th ed. Addison Wesley. (b) F.S.Hill, Jr., 2001. Computer Graphics – Using Open GL, Second Edition, Prentice Hall. (c) Foley, van Dam, Feiner, Hughes and Philips, 2000. Introduction to Computer Graphics, Addison Wesley. (d) Neider,Jackie. 1997. OpenGL Programming Guide: the official guide to learning OpenGL. second edition. Addison Wesley.
3D Solar System Visualization (Feby Fitria)
(e) Richard S.Wright Jr. 2011. OpenGL Super Bible: Comprehensive Tutorial and Reference 5th ed. Pearson Education, Inc. (f) Shreiner. Dave, 2004. An Interactive Introduction to OpenGL Programming Courese #29, Siggraph. (g) PDS: The Planetary Data Systems, https://pds.jpl.nasa.gov, accessed at 29 January 2015 (h) PDS: The Planetary Data Systems, https://pds.jpl.nasa.gov/planets, accessed at 29 January 2015 AUTHOR BIOGRAPHIES Riri Safitri is a lecturer in Department of Informatics Engineering, Faculty of Science Technology, University of Al Azhar Indonesia, Jakarta. She received her Master of Electrical Engineering: Digital Media and Game Technology from Institut Technology Bandung in 2009. Her research interests are in the modelling and visualization in Augmented Reality. Her email address is
DSS-99