Workshop on 3D Remote Sensing in Forestry, 14th-15th Feb. 2006, Vienna – Session 8a
211
3D VEGETATION MAPPING AND CLASSIFICATION USING FULL-WAVEFORM LASER SCANNING Vesna Ducic1, Markus Hollaus1, Andreas Ullrich2, Wolfgang Wagner1 and Thomas Melzer1 1
Christian Doppler Laboratory for Spatial Data from Laser Scanning and Remote Sensing, Vienna University of Technology, Vienna, Austria;
[email protected],
[email protected],
[email protected],
[email protected] 2 Riegl Research GmbH, Horn, Austria;
[email protected]
ABSTRACT Classifying vegetation points from 3D airborne laser scanner (ALS) point clouds is a challenge and focus of current research. In particular, low vegetation points are very difficult to identify. The basic problem is that so far the majority of ALS systems have provided only the 3D coordinates of scattering objects and most of the criteria used in classifying points had to rely on simple geometric characteristics of a point relative to its neighbourhood. Methods for ALS data processing could be much improved if ALS systems measure, in addition to the range, further physical observables which can be used for vegetation classification. New ALS systems, which record the full echo-waveform, may provide crucial information for the classification of vegetation points. In this paper we show that the additional features derived from the full-waveform data – the amplitude, the pulse width and the number of pulses - can be used to discriminate between vegetation and non-vegetation points without using geometry information. Thus, a truly three dimensional representations of the classified ALS points can be obtained. The classification algorithm is based on a decision tree technique. The applicability of this method is demonstrated on data collected by the RIEGL LMS-Q560 sensor over the Schönbrunn area of Vienna. The performance of the classification algorithm was checked manually on 500 points randomly distributed and on several test zones selected over the study area. We found an overall accuracy of 88.6% with a kappa coefficient of 0.8. Keywords: Laser scanning, classification, vegetation, forestry, full-waveform
1
INTRODUCTION
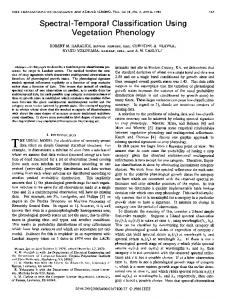
The RIEGL airborne laser scanner LMS-Q560 is one of the first commercial small-footprint fullwaveform digitizing laser scanners with a data logger capability for recording the digitised waveforms of both the transmitted laser pulse and the backscattered signal (Riegl 2004). The digitization feature of the instrument enables the user to analyse the waveform off-line in post-processing and thus to use different detection methods for range determination or even a combination of methods in order to extract additional information from the data. Wagner et al. (2006) showed that small-footprint waveform data can be modelled as a series of Gaussian pulses. The decomposition of an observed laser waveform into Gaussian components not only improves the ranging accuracy of the laser measurement (Hofton et al. 2000) but also allows deriving further physical observables in addition to the range – the amplitude and the standard deviation of each pulse (namely pulse width). Figure 1 shows an example of a measured waveform from a forested area. These additional features constitute a valuable source of information for classification purposes. In this paper we investigate the possibility of using the amplitude, the pulse width and the number of pulses derived from the full-waveform analysis to classify the vegetation points (trees and bushes) without including any geometric information. The first part of this paper describes the study area and the classification algorithm. In the second part, results are presented and discussed highlighting the advantages and the possibilities of the full-waveform observables in forestry applications.
Workshop on 3D Remote Sensing in Forestry, 14th-15th Feb. 2006, Vienna – Session 8a
212
Figure 1: Example of a measured versus a modeled waveform (Wagner et al., 2006).
2
METHOD
2.1
LMS-Q560 data
The LMS-Q560 data used in this study were acquired on August 30, 2004 by Milan-Flug over the Schönbrunn area of Vienna. The instrument was installed on an airplane equipped with GPS and INS. The scanned area comprises natural forest and a large variety of land cover types, including the buildings and park of Schloß Schönbrunn, densely built up areas, residential areas and allotment of gardens. The flight altitude was about 500 m above ground, which resulted in a laser footprint size of 25 cm on ground. An area of about 2 km2 was covered by eleven parallel flight tracks. The area analysed in this paper represents approximately 400x650 m2. The scan rate was set to 66 kHz which resulted in a mean point density of four measurements per square meter. The maximum scan angle was 25°. More detailed information is given in Wagner et al. (2006).
2.2
Classification algorithm
To gain an understanding of the information provided by full-waveform data we chose to use a classification tree approach to extract the vegetation points. Decision tree theory for land cover classification has been applied previously to remotely sensed data (Michaelson et al. 1994, Hansen et al. 1996). The tree approach has a number of advantages over traditional classification methods (Hansen et al. 1996). It requires no assumptions regarding the distribution of input data, as in a maximum likelihood approach, and also provides an intuitive classification structure. Moreover, from a practical point of view, it is immediately apparent which variables contribute to the discrimination between classes (DeFries et al. 1998). This can be very useful for defining subsequent suitable inputs for vegetation point characterizations. In this study we built a decision tree classifier based on object signatures analysis.
3
RESULTS AND DICUSSION
3.1
Features derived from the full-waveform
The RIEGL LMS-Q560 system is able to record all returns per pulse. Figure 2a depicts a 3D point cloud of the study area. The colour shows the index of the corresponding scatterer. Up to 7 scatterers have been observed for a given waveform (from first to last pulse). The multiple echoes appear mainly in forested terrain (Figure 2b). The multiple returns can therefore be of importance in filtering and modelling algorithms related to vegetation and ground surface separation and for deriving forest parameters. Multiple echoes can also be found at the edges of buildings, thus indicating a very fast change in elevation. Another estimate derived from the full-waveform analysis is the amplitude. The amplitude or power of the return signal depends on several factors: the total power of the transmitted pulse, the fraction of the laser pulse that is intercepted by a surface, the reflectance of the intercepted surface at the laser’s wavelength, and the fraction of reflected illumination that travels in the direction of the sensor. Some authors have already used amplitude data successfully in classification algorithm, e.g. finding a
Workshop on 3D Remote Sensing in Forestry, 14th-15th Feb. 2006, Vienna – Session 8a
213
specific geometric or statistic structure, such as buildings or vegetation (Rottensteiner et al. 2005) or discriminating between different types of vegetation cover (Schreirer et al. 1985). In Figure 3a, a 3D point cloud of the area is shown, where the colour indicates the amplitude of the points. The red colour corresponds to low amplitude and the blue one to high amplitude measurements. The surface classes - forest, grass and buildings - can be distinctly identified in the amplitude image. However, the vegetation presents the same range of amplitude as asphalt streets (section 3.2). Therefore, the amplitude information is not recommended to be used alone for a priori classification of objects. The amplitude can be used for visualization of the scene but also to improve filtering/removal and classification/separation of objects in combination with the range and other information. The amplitude value can also be used for separating segments of artificial objects from vegetation (Hug&Wehr, 1997).
(b)
(a)
Figure 2: 3D point cloud of the study area. The colour shows the index of the corresponding scatterer. (a) Points presenting only one echo pulse. (b) Points presenting two echoes and more.
(a)
(b)
High
Low
Figure 3: (a) Amplitude image showing trees, vegetation, access roads and buildings. (b) Pulse width image.
The full-waveform provides also an estimate of the standard deviation describing the width of each Gaussian component. In Figure 3b the pulse width is illustrated. The dark points correspond to wide echoes pulses, the light points correspond to narrow echo pulses (flat and no-tilted surfaces). For vegetation points, we observe systematically a broadening of the pulse width. The pulse width
Workshop on 3D Remote Sensing in Forestry, 14th-15th Feb. 2006, Vienna – Session 8a
214
appears therefore to be a very useful parameter to discriminate between vegetation and nonvegetation points (Persson et al. 2005).
3.2
Object signatures
In order to determine the input variables and the corresponding thresholds to be used in the decision tree classifier, we selected manually 5000 training points and did the signature analysis for the classes: vegetation (trees and bushes), grass, asphalt road and various roofs (buildings and houses). In Figure 4 the histograms of the pulse width (a) and the amplitude (b) for these classes are shown. We observe that the multiple echoes correspond mainly to vegetation points. Points with amplitude higher than 75 amplitude units correspond mostly to roofs and grass and points presenting a pulse width wider than 1.9 ns are vegetation points.
0 1
1.5
2
2.5 Grass
3
3.5
4
500 0 1
1.5
2 2.5 3 Roof (Buildings + houses)
3.5
4
Nb. of points
500 0 1
1.5
2
2.5 Road
3
3.5
4
50 0 1
1.5
2
2.5 3 Pulse width (ns)
3.5
4
(a)
Nb. of points
10
Nb. of points
20
Nb. of points
One echo Multiple echoes
Vegetation (trees + bushes) 50
0 0
One echo Multiple echoes 50
100
150
200
250
100 150 200 Roof (Buildings + houses)
250
Grass 200 0 0
50
100
Nb. of points
Vegetation (trees + bushes)
1000
Nb. of points
Nb. of points
Nb. of points
We can see that substantial overlap exists in the amplitude-pulse width space for different classes. It is for example impossible for narrow pulse width points to separate vegetation from buildings or road based only on the pulse width. Also, laser points corresponding to grass present the same range of amplitude as building roofs. Given this overlap we merged the classes road, grass and roofs in one class “non-vegetation”. Now, the issue is how to define a decision tree algorithm such that the classes vegetation and non-vegetation can be accurately discriminated and mapped in an efficient and repeatable fashion. It is clear that only the combination of different features allows distinguishing between these two classes.
50 0 0
50
100
150
200
250
100 150 Amplitude
200
250
Road 50 0 0
50
(b)
Figure 4: (a) Histogram of the pulse width of points. (b) Histogram of the amplitude of points. The blue points correspond to one echo and the red ones to multiple echoes.
3.3
Decision tree
To grow the tree we used the previous signatures. Figure 5 illustrates a portion of the hierarchical structure of the tree. The complete tree has six final nodes. The first split uses the number of scatterers per pulse to partition the data. Combining together the pulse width, the amplitude and the multiple returns provided simultaneously by the laser scanner, classification of vegetation points can be done automatically.
3.4
Evaluation of the results of classification
The results of classification are shown in Figure 6. The green points correspond to vegetation points and the red ones to non-vegetation points. In general the classification algorithm gives satisfying results. The vegetation areas are correctly identified; even low vegetations (bushes) are correctly
Workshop on 3D Remote Sensing in Forestry, 14th-15th Feb. 2006, Vienna – Session 8a
215
mapped. Also, non-vegetation points corresponding to buildings, houses, grass and asphalt streets are precisely classified.
Figure 5: Partial classification tree for the study area. Rectangles are non-terminal nodes, and circles are terminal nodes with class assignments within each node. The corresponding input parameter is shown within each rectangle. The associated thresholds are shown on diagonal edges.
To provide a realistic estimate of the classifier performance for discriminating vegetation from nonvegetation points, we checked manually 500 points randomly distributed over the study area. Approximately half of these points were vegetation points. This showed that there were 17 vegetation points classified as non-vegetation and 40 non-vegetation points classified as vegetation, indicating that the decision tree classification algorithm works rather well. One reason for having more nonvegetation misclassified than vegetation points is the difficulty to correctly classify off-terrain points below trees canopy. Also some points belonging to building edges and facades are misclassified. They present a broadening of the pulse width comparable to vegetation points. Non-vegetation points corresponding to flat surfaces like building roofs, grass or asphalt road are very well classified.
Figure 6: Classification result obtained with the decision tree algorithm. The green points correspond to vegetation points and the red ones to non-vegetation points.
Workshop on 3D Remote Sensing in Forestry, 14th-15th Feb. 2006, Vienna – Session 8a
216
For the final accuracy assessment we have analysed in addition several training areas corresponding to non-vegetation and vegetation regions (more than 10000 points). The overall accuracy of the classification is 88.6% with a kappa coefficient of 0.8. The advantage of this method is the possibility to assign a label to the laser point. As opposed to the existing 2.5D models derived form first/last-pulse laser scanner systems, a truly three dimensional representations of the vegetation has been obtained
4
CONCLUSIONS
So far, ALS systems have provided only 3D coordinates, compelling segmentation and classification approaches to rely on geometric information only. With a full-waveform laser scanner, by pulse-wise analysis of the backscattered signal, it is possible to determine quality parameters for a given range measurement as pulse amplitude or pulse width, which can be used as a direct input into further classification steps. In this paper we investigated the potential of the additional observables derived from the RIEGL LMS-Q560 full-waveform to classify and to map the vegetation points without using the geometry information. A decision tree algorithm was implemented. The overall accuracy of the decision tree classifier is 88.6% with a kappa coefficient of 0.8. This suggests that incorporation of amplitude, pulse width measurements and number of pulses in classification schemes will result in significant progress towards detailed mapping of natural and man-made objects. The classified vegetation points can be very useful as input parameters for existing filtering and classification algorithms, improving at the same time the resulting digital terrain model (DTM) and therefore the normalized digital surface model (nDSM) product. It can also help segmentation purposes and can be used for “internal” validation of classification. On the other hand, the direct retrieval of vegetation points can also facilitate analysis and extraction of vegetation parameters, which is particularly interesting for forestry applications. It would be thus possible to derive a truly three dimensional representations of the vegetation as opposed to the prevalent 2.5 models derived form first/last-pulse data.
ACKNOWLEDGEMENTS We would like to thank the Schloß Schönbrunn Kultur- und Betriebsges.m.b.H for their support of the data acquisition campaign. Also we would like to thank all colleagues from TU Wien and RIEGL who have been involved in carrying out the field campaign and processing of the data.
REFERENCES DeFries, R.S., Hansen, M., Townshend J.R.G. and Sohlberg R. (1998). Global land cover classification at 8 km spatial resolution: the use of training data derived from Landsat imagery in decision tree classifiers. Int. J. Remote Sens. Vol. 19, No. 16, 3141-3168. Hansen, M., Dubayah, R. and DeFries, R. (1996). Classification trees: An alternative to traditional land cover classifiers. Int. J. Remote Sensing, Vol. 17, 1075-1081. Hofton, M.A., Minster, J.B., Blair, J.B. (2000). Decomposition of laser altimeter waveforms. IEEE Trans. Geosc. Remote Sens. 38(4):1989-1996. Hug, C. and Wehr A. (1997). Robust Detecting and identifying topographic objects in imaging laser altimeter data. International Archives of Photogrammetry and Remote Sensing, Vol. 32, Part3-4W2I, “3D Reconstruction and modelling of topographic objects”, Stuttgart, Germany, 17-19 September, pp. 19-26. Maas, H.-G. (2001). The suitability of airborne laser scanner data for automatic 3D object reconstruction. “Third Int'l Workshop on Automatic Extraction of Man-Made Objects”, 10-15 June, Ascona, Switzerland. Michaelson, J., Shmiel, D.S., Riedl, M.A., Davis, F.W. and Dubayah, R.O. (1994). Regression tree analysis of satellite and terrain data to guide vegetation sampling and surveys. Journal of vVegetation Science, 5, 673686. Persson, Å, Söderman, U., Töpel, J., Ahlberg, S. (2005). Visualization and analysis of full-wavefrom airborne laser scanner data. International Archives of Photogrammetry, Remote Sensing and Spatial Information Sciences 36 (Part 3/W19), 103-108. Riegl Laser Measurement Systems (2004). Website: www.riegl.com
Workshop on 3D Remote Sensing in Forestry, 14th-15th Feb. 2006, Vienna – Session 8a
217
Rottensteiner, F., Trinder, J., Clode, S., Kubik, K. (2005). Using the Dempster Shafer method for the fusion of LIDAR data and multi-spectral images for building detection. Information Fusion 6(4), 283-300. Schreier, H., Lougheed, J., Tucker, C., and Leckie, D. (1985). Automated measurement of terrain reflection and height variations using an airborne laser system. Int. J. Remote Sensing 6:101-113. Wagner, W., Ullrich, A., Ducic, V., Melzer, T. and Studnicka, N. (2006). Gaussian Decomposition and Calibration of a Novel Small-Footprint Full-Waveform Digitising Airborne Laser Scanner. ISPRS Journal of Photogrammetry & Remote Sensing, in press.