recently introduced into both the Java 5 and C# 2.0 pro- gramming ... ten deployed open source applications and provide analysis about the frequency and ...
3D Visualization of Class Template Diagrams for Deployed Open Source Applications Benjamin N. Hoipkemier, Nicholas A. Kraft and Brian A. Malloy Computer Science Department Clemson University {bhoipke,nkraft,malloy}@cs.clemson.edu
Abstract In this paper, we exploit the g 4 re infrastructure to facilitate comprehension of generic programs written in the C++ language, including class templates, instantiated class templates and specialized class templates [16]. We evaluate our 3D visualization technique using ten deployed open source applications and provide analysis about the frequency and efficiency of generic programming in these applications.
1. Introduction The generic programming paradigm is becoming increasingly popular as an ancillary tool to object technology, with conferences, seminars and other literature appearing to address these growing concerns [3, 6, 11, 32]. Generic programming deals with finding abstract representations of efficient algorithms and data structures and expressing these structures in an adaptable interoperable manner [11]. The canonical example of generic programming is the Standard C++ library (STL); however, recent libraries, such as Boost, Loki and Blitz++, rely heavily on both generic and generative programming to produce code that is more general, more efficient and more easily incorporated into existing applications than their non-generic counterpart [1, 27, 33]. In recognition of the importance of generics, they have been recently introduced into both the Java 5 and C# 2.0 programming languages [22, 28]. One problem with generic programming is the dearth of tool technology to facilitate comprehension, documentation and debugging of applications that utilize generic programming [11]. This may be true, in part, because the showcase language vehicle for generic programming is C++, which is notoriously difficult to parse [14, 15, 24]. Moreover, we have been unable to find any tool description in the literature that provides facility for comprehension, visualization
or debugging of generic programming in C++. In this paper, we exploit the g 4 re infrastructure to facilitate comprehension of generic programs written in the C++ language, including class templates, instantiated class templates, and specialized class templates [16]. Unlike other systems that use the source code to construct UML class diagrams, our system uses an abstract semantic graph (ASG), which contains additional information about templates not included in the source code. Our visualization technique leverages 3D class diagrams with classes and class templates presented in the X-Y plane, and instantiated, and specialized classes presented along the Z axis. To evaluate our 3D visualization technique, we examine ten deployed open source applications and provide analysis about the frequency and efficiency of generic programming in these applications. Our case study illustrates the type of information that can be extracted using our visualizer that cannot be obtained using previous class visualization techniques. Moreover, our approach is the only reported work that includes template considerations into the visualization of class diagrams. In the next section, we provide background information about compilation and analysis of C++ applications and we describe the g 4 re system, UML class diagrams, GXL and schemas. In Section 3 we provide an overview of our system and in Section 4 we describe results from our visualization of ten deployed C++ applications. In Section 5 we describe the type of information that can be obtained using our visualizer and in Section 6 we review some of the literature related to our work. Finally, we draw conclusions in Section 7.
2. Background In this section we provide background about tools and terminology that we use to visualize 3D class diagrams. In Section 2.1 we motivate our approach and in Section 2.2 we review the g 4 re reverse-engineering system analyzes the
To appear in The Eighteenth International Conference on Software Engineering and Knowledge Engineering (SEKE’06) San Francisco Bay, USA, July 5-7, 2006
C++ application. In Section 2.3 we review class diagrams, and in Section 2.4 we describe GXL and schemas.
2.1
Analyzing source code
There are several viable graphical source code representations and the most common of these are the abstract syntax tree (AST) and the abstract semantic graph (ASG). The AST is a pruned parse tree with many of the unnecessary productions removed from the tree. An ASG is an AST that is adorned with additional nodes and edges to represent semantic information such as the scope of identifiers or the types of variables. The ASG has a distinct advantage over analysis of a program at the source, AST or object code level: information about template instantiations, template specializations and template partial specializations is readily available in the ASG. For example, an application that contains a class template Stack can be instantiated for various types or can be specialized for a stack that requires time and space efficiency provided by bit manipulation [31]. Our 3D visualizer exploits class template information provided by an ASG.
2.2
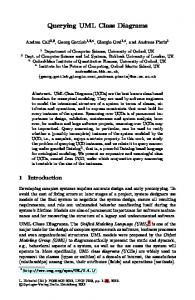
Figure 1. System overview. This figure illustrates the important components in our 3D visualization of class template diagrams.
graph. GXL is used to represent both instance data and schemas describing the structure of the data; schemas in GXL are represented as UML class diagrams.
3. System Overview In this section we provide an overview of our system, including discussion of the important components and subsystems that we use to build a 3D class template diagram. Figure 1 summarizes our visualization system, where a C++ program consisting of input files, shown in the middle left of Figure 1, are read by the builder component of our system. The builder component is part of the ctd subsystem, shown in the lower middle of the figure. The builder component instantiates a CppInfo API, shown in the lower left of the figure, which provides information about class templates, class template instantiations and class template specializations for the input program under study. The builder component generates a class template diagram for the program and writes the diagram to a file in GXL format, shown in the upper middle of the figure. Finally, the GXL encoded class template diagram is used as input to our visualizer component, which uses the graphviz dot program to build a partial layout of the class diagram. Finally, the visualizer produces a 3D picture of the class template diagram, with classes and parent class templates appearing in the X-Y plane, and template instantiations, and specializations appearing along the Z axis. The visualizer component reads GXL files output by builder, and builds a three dimensional environment for the class template diagram. After the visualizer parses the classes in the GXL file, the dot tool then generates a 2D layout of the classes and parent class templates. The visualizer component then uses OpenGL to create a 3D scene consisting of the classes and parent class templates in the X-Y plane, and template instantiations along the Z axis. The user can maneuver around the scene in real time using our graphical visualizer tool. Within the OpenGL en-
4
The g re Tool Chain
The g 4 re tool chain exploits the gcc Abstract Semantic Graph (ASG), GENERIC, to provide an Application Programmers Interface (API) to facilitate easy access to information about types, including classes, templates, template instantiations, and template specializations, as well as scopes, variables, functions and statements. The advantages of the g4 re tool chain is that it can analyze any program that can be compiled by the gcc C++ compiler. We use the g4 re tool chain to create an API that abstracts the important information about the C++ application. Our 3D visualizer uses this information to build class diagrams. We describe this process in Section 3.
2.3
UML Class Diagrams
Because of the complexity inherent in large programs, a developer, or group of developers, may not be able to grasp the overall design of the system, even if they are familiar with the source code. The Unified Model Language (UML) includes graph structures to represent aspects of the program, providing an overview of the programs structure and behavior[2]. The UML can help even non-programmers get a better grasp of the overall functionality of the system.
2.4
GXL/Schemas
GXL (Graph eXchange Language) [9] is an XML sublanguage defined by an XML DTD (Document Type Definition) and conceptualized as a typed, attributed, directed 2
Test Case Version C++ Translation Units NCLOC (≈ K)
Doxygen 1.4.4 69 170
FOX 1.4.17 245 110
FluxBox 0.9.14 107 32
HippoDraw 1.15.8 249 55
Jikes 1.22 38 70
Keystone 0.2.3 52 16
Licq 1.3.0 28 36
Pixie 1.5.2 78 80
Scintilla 1.66 78 35
Scribus 1.2.3 110 80
Table 1. Testsuite. This table lists the ten test cases that we use in our study, including the version, the number of translation units, and the approximate number of non-commented, non-preprocessed lines of code (NCLOC).
vironment all classes and instantiations are represented by boxes. Class information about data attributes and functions is included on the side of the box. This is information as it would appear in a UML Class Diagram. Inheritance edges are represented as lines with the ancestor portion of the line drawn in green, and the descendant portion drawn in brown. Classes are illustrated as yellow boxes, while template classes are colored light blue. Template instantiations are colored in red and descend down the Z axis away from their parent template. Instantiations are connected by a blue line running from the template instantiation to the parent template. Template instantiations that have the same parent template reside on the same X-Y plane.
[5]. HippoDraw provides a highly interactive data analysis environment [8]. Jikes is a Java compiler system from IBM [10]. Keystone is a parser and front end for ISO C++ [13, 19]. Licq is a multi-threaded ICQ clone [18]. Pixie is a RenderMan like photorealistic renderer [23]. Scintilla is a source code editing component that includes support for syntax styling, error indicators, code completion, and call tips [25]. The final test case is Scribus, a desktop publishing system for Unix-like platforms [26]. The remaining three rows of data in Table 1 list relevant details of the test cases. The second row of the table lists the version number and the third row lists the number of C++ translation units. Finally, the fourth row lists the approximate number of thousands of lines of non-commented, non-preprocessed lines of code.
4. Results The experiments reported in this section were run on a workstation with an AMD Athlon64 3000+ processor, 1024 MB of PC3200 DDR RAM, and a 7200 RPM SATA hard drive formatted with version 3.6 of the ReiserFS filesystem, running the Slackware 10.1 operating system. The programs were compiled using gcc version 3.3.6. In Section 4.1 we describe the ten deployed, open source applications and libraries that serve as the test suite in our study. In Section 4.2 we investigate the time requirements and in Section 4.3 we investigate the space requirements of our system. Finally, in Section 4.4 we investigate the number of classes, class templates and instantiated class templates.
4.1
4.2
Time Requirements of Visualization
The data in Table 2 summarizes the time requirements of our visualization system. The columns list the ten test cases and the four rows list results for the three phases of class template diagram construction, with the last row listing total times. All data are wall-clock timings in seconds. The first row of Table 2, Instantiate API, lists timings for the first phase of our system: instantiation of the CppInfo API for each of the test cases, illustrated on the left of Figure 1. These timings include the time to parse the .cpp.tu.gxl.gz for the open source application, reconstruction of the GENERIC ASGs, transformation to the CppInfo API instances, and linking of the API instances. The second row of Table 2, Generate CTD GXL, lists timings for the second phase of our system, including construction of a class template diagram and timings to write the diagram in GXL format, as illustrated in the center of Figure 1. The third row of Table 2, Parse CTD GXL, Generate Dot, Parse Dot, Render, lists timings for the third and final phase of our system. These timings include reading and parsing the GXL generated in the previous phase, generating a Dot graph to obtain a 2D layout of the classes and parent class templates, reading and parsing the generated Dot graph and generation and rendering of the OpenGL 3D representation of our class template diagram. The final row of Table 2 summarizes timings for all three phases.
The test suite of applications and libraries
Table 1 lists the ten deployed open source applications and libraries, or test cases, that form the test suite that we use in our study, together with important statistics about each test case1 . The header of the table lists the names that we use to refer to each of the test cases: Doxygen, FOX, FluxBox, HippoDraw, Jikes, Keystone, Licq, Pixie, Scintilla, and Scribus. Doxygen is a documentation system for C++, C, and Java [30]. FOX is a toolkit to facilitate development of graphical user interfaces [29]. FluxBox is a lightweight X11 window manager built for speed and flexibility 1 Additional information about each test case is available in our online repository.
3
Phase 1 Phase 2
Phase 3
Test Case Instantiate API Generate CTD GXL Parse CTD GXL Generate Dot Parse Dot Render
Total
Doxygen 286.02 6.43 1.03 0.34 231.55 0.21 525.58
FOX 507.43 3.07 0.40 0.11 91.87 0.06 602.94
FluxBox 492.66 2.08 0.32 0.06 59.20 0.05 554.37
HippoDraw 749.93 1.77 0.28 0.09 49.51 0.04 801.62
Jikes 274.77 2.98 0.44 0.10 80.14 0.08 358.51
Keystone 241.85 0.50 0.09 0.03 17.80 0.01 260.28
Licq 92.46 1.18 0.20 0.04 38.75 0.03 132.66
Pixie 115.17 1.26 0.23 0.06 36.51 0.04 153.27
Scintilla 52.91 0.49 0.06 0.03 12.89 0.02 66.40
Scribus 754.62 1.84 0.24 0.06 44.11 0.03 800.90
Table 2. Time (s). The data in this table summarizes the time requirements of our visualization system. The columns list the ten test cases and the four rows list results for the three phases of class template diagram construction, with the last row listing total times. All data are wall-clock timings in seconds.
Test Case .cpp.tu.gxl.gz .ctd.gxl .dot
Doxygen 191 2.82 1.01
FOX 323 1.30 0.81
FluxBox 323 0.79 0.32
HippoDraw 486 0.78 0.46
Jikes 205 1.21 0.51
Keystone 201 0.25 0.15
Licq 71 0.60 0.35
Pixie 70 0.59 0.28
Scintilla 36 0.20 0.12
Scribus 450 0.69 0.41
Table 3. Size on disk (MB). The data in this table summarizes the space requirements of our visualization system. The columns list the ten test cases and the three rows list results for the three kinds of files in our system: the first row is the zipped GXL files, the second row is the class template diagram files in GXL format and the third row is the dot representation of the class template diagram.
4.3
5. Case Study
Space Requirements
The data in Table 3 summarizes the space requirements of our visualization system. The columns list the ten test cases and the three rows list results for the three kinds of files that are used in our system: the first row is the gzipped GXL files, the second row is the class template diagram files in GXL format and the third row is the size of the dot representation of the class template diagram. The largest files are for the HippoDraw application, which has the highest number of classes (see Table 1). Table 3 shows that the gzipped GXL representations of the ASG are orders of magnitude larger than the corresponding class template representations.
4.4
Our visualization research permits us to obtain information about the system that is not readily available from inspection of the source code alone. Figure 2 shows the visualizer tool interface. There are two slider bars that allow us to control the azimuth and the elevation. Horizontal movement, vertical movement, and zoom is controlled through keyboard input. The default view illustrates all classes in the system, illustrated as cubes, together with inheritance and template association relationships forming the edges that connect the cubes. We provide options that allow the user to view only the template classes in the system, including instantiations; there are check boxes that allow the user to hide the background and text. The area to the right of the controls in Figure 2 illustrate a class diagram of Pixie-1.5.2. The cubes aligned on the left side of the diagram lie on the Z-axis; These cubes represent template instantiations of the CArray < T > template class. There are other class template instantiations along the Z-axis further down along the X-axis, shown to the right of the figure; however, the majority of instantiations in this application are derived from the CArray < T > template class. This shows that a modification to CArray < T > will have a profound impact on the Pixie-1.5.2 system. Figure 3 shows a class diagram for Doxygen-1.4.4. and illustrates template instantiations of classes involved in inheritance relationships. The cubes shown along the Z-axis are instantiations of classes that inherit from
CTD Summary
The data in Table 4 summarizes the kinds of classes in the test cases. The columns list the ten test cases and the three rows list results for the three kinds of classes in the test cases: the first row is the number of classes, the second row is the number of class templates, and the third row is the number of instantiated classes derived from the class templates. Only three of the test cases contained ten or more class templates: Doxygen with 31, FluxBox with 11 and Pixie with 10 class templates. The number of template instantiations can be large; for example, Doxygen’s 31 class templates generated 311 instantiated classes and Jikes, with only 6 class templates, generated 120 instantiated classes. 4
Test Case ClassNonTemplate ClassTemplate ClassTemplateInstantiation Total
Doxygen 409 31 311 751
FOX 464 1 4 469
FluxBox 211 11 69 291
HippoDraw 248 1 9 258
Jikes 270 6 120 396
Keystone 77 4 14 95
Licq 225 0 0 225
Pixie 239 10 44 293
Scintilla 89 0 0 89
Scribus 211 0 0 211
Table 4. Class Type Summary. The data in this table summarizes the kinds of classes in the test cases. The columns list the ten test cases and the three rows list results: the first row is the number of classes, the second row is the number of class templates, and the third row is the number of instantiated classes derived from the class templates.
Figure 2. Pixie-1.5.2. This figure shows the visualizer tool interface and a class template diagram for the Pixie-1.5.2 test case. The two slider bars permit control of the azimuth and the elevation. Horizontal movement, vertical movement, and zoom is controlled through keyboard input.
Figure 3. Doxygen-1.4.4 This figure illustrates a 3D class template diagram for Doxygen.
visualization of code. Due to space and relevance, we do not review the work about visualization of data. However, there has been no reported work about visualization of class template diagrams. Eiglsperger et al. observed that previous approaches to class diagram layout employ a hierarchical approach, where all edges of the same type should point in the same direction [4]. For example, inheritance edges point upward in the diagram. They proposed a new approach using topologyshape-metrics as a basis for the layout. They showed that their layout incorporates flow information into the diagram and works well for all types of diagrams. However, they did not incorporate generics into their layout algorithm. Gutwenger et al. distinguish two kinds of relationships in class diagrams: (1) inheritance, and (2) association, including aggregation and composition [7]. They identified five anesthetic preferences for class diagrams that permit all directed edges of a component to follow the same direction.
CompAccept < T >; these inheritance relationships are illustrated by the edges running in the X direction; the base classes for CompAccept < T > are not shown in the figure. Nevertheless, the figure illustrates that a change to CompAccept < T > will have an impact on all of the instantiated classes running along the Z-axis. This information is not readily available at the source code level.
6. Related Work In this section, we review the literature that relates to our work. There are three categories of research about visualization of software applications: (1) research about class diagram layout, (2) research about visualization of code, and (3) research about visualization of data [12, 21]. We first review the research about class diagram layout, which complements our work, and we then review research about 5
Their orthogonal layout is compact with a small number of crossing edges. However, they do not incorporate generics into their layout. Malloy and Power exploit a molecular metaphor for 3D visualization of dynamic object relationships in Java applications [20]. They instrument Java bytecode to collect trace data, which is then analyzed and visualized in 3D using VRML. However, their approach does not accommodate Java generics. Lewerentz and Simon present a metrics based approach to software visualization that supports quality assessment of large object-oriented software systems written in C++ and Java [17]. Their system utilizes a combination of software metrics data and program structure information to form a virtual information space. Their approach does not include visualization of C++ class templates or Java generics.
[10] IBM Jikes Project. Jikes version 1.22. Available at http://jikes.sourceforge.net. [11] M. Jazayeri, R. Loos, and D. Musser, editors. Generic Programming: International Seminar, Dagstuhl Castle, Germany, 1998. Springer-Verlag, Germany, 2000. [12] J. A. Jones, A. Orso, and M. J. Harrold. Gammatella: Visualizing program-execution data for deployed software. Information Visualization, 3(3):173–188, 2004. [13] Keystone Project. Keystone version 0.2.3. Available at http://keystone.sourceforge.net. [14] P. Klint, R. L¨ammel, and C. Verhoef. Towards an engineering discipline for grammarware. 2005. [15] G. Knapen, B. Lague, M. Dagenais, and E. Merlo. Parsing C++ despite missing declarations. In 7th IWPC, Pittsburgh, USA, May 5-7 1999. [16] N. A. Kraft, B. A. Malloy, and J. F. Power. Toward an infrastructure to support interoperability in reverse engineering. In 12th WCRE, Pittsburgh, USA, Nov. 2005. [17] C. Lewerentz and F. Simon. Metrics-based 3d visualization of large object-oriented programs. In VISSOFT ’02, page 70, DC, USA, 2002. IEEE Computer Society. [18] Licq. Licq version 0.2.3. Available at http://www.licq.orq. [19] B. A. Malloy, T. H. Gibbs, and J. F. Power. Decorating tokens to facilitate recognition of ambiguous language constructs. SP&E, 33(1):19–39, 2003. [20] B. A. Malloy and J. F. Power. Using a molecular metaphor to facilitate comprehension of 3d object diagrams. In VL/HCC, pages 233–240, 2005. [21] A. Marcus, L. Feng, and J. I. Maletic. 3d representations for software visualization. In SOFTVIS, pages 27–36, 207–208, 2003. [22] Microsoft Corporation. C# language specification. Third Edition, 10 March 2006. [23] Pixie. Pixie version 1.5.2. Available at http://pixie.sourceforge.net. [24] J. F. Power and B. A. Malloy. Symbol table construction and name lookup in ISO C++. In 37th TOOLS, pages 57– 68, Sydney, Australia, Nov. 2000. [25] Scintilla. Scintilla version 1.66. Available at http://www.scintilla.org. [26] Scribus. Scribus version 1.2.3. Available at http://www.scribus.net. [27] J. G. Siek and A. Lumsdaine. Essential language support for generic programming. In PLDI ’05, pages 73–84, New York, NY, USA, June 2005. ACM Press. [28] Sun Microsystems Inc. Java language specification, third edition. Version 5, 10 March 2006. [29] J. van der Zijp. The FOX Toolkit Library version 1.4.6. Available at http://www.fox-toolkit.org. [30] D. van Heesch. Doxygen version 1.3.9.1. Available at http://stack.nl/ dimitri/doxygen. [31] D. Vandevoorde and N. M. Josuttis. C++ Templates: The Complete Guide. Addison Wesley, 2002. [32] T. L. Veldhuizen. Five compilation models for C++ templates. In First Workshop on C++ Template Programming, Erfurt, Germany, October 10 2000. [33] T. L. Veldhuizen and D. Gannon. Active libraries: Rethinking the roles of compilers and libraries. In Proceedings of the SIAM Workshop on Object Oriented Methods for Interoperable Scientific and Engineering Computing (OO’98). SIAM Press, 1998.
7. Concluding Remarks We have described our approach to 3D visualzation of class template diagrams for C++ applications. We evaluated our 3D visualization technique using ten deployed open source applications and provided information about the frequency and efficiency of generic programming in these applications. Our case study illustrated the type of information that can be extracted using our visualizer that cannot be obtained using previous class visualization techniques.
References [1] A. Alexandrescu. Modern C++ design: generic programming and design patterns applied. Addison-Wesley Longman Publishing, Boston, MA, USA, 2001. [2] G. Booch, J. Rumbaugh, and I. Jacobson. The UML User Guide. Addison-Wesley, 1999. [3] H. Eichelberger and J. W. v. Gudenberg. UML description of the STL. In First Workshop on C++ Template Programming, Erfurt, Germany, October 10 2000. [4] M. Eiglsperger, M. Kaufmann, and M. Siebenhaller. A topology-shape-metrics approach for the automatic layout of uml class diagrams. [5] Fluxbox Project. FluxBox version 0.9.12. Available at http://www.fluxbox.org. [6] R. Gl¨uck and M. R. Lowry, editors. Generative Programming and Component Engineering, 4th International Conference, 2005. Springer, 2005. [7] C. Gutwenger, M. J¨unger, J. Kupke, S. Leipert, and P. Mutzel. A new approach for visualizing UML class diagrams. In SoftVis ’03, pages 179–188, New York, NY, USA, 2003. ACM Press. [8] HippoDraw. Hippodraw version 1.15.8. Available at http://www.slac.stanford.edu/grp/ek/hippodraw/. [9] R. C. Holt, A. Walter, and A. Sch¨urr. GXL: Toward a standard exchange format. In WCRE, pages 162–171, Nov 2000.
6