3rd Reading April 20, 2006 16:56 WSPC/SPI-B368 Advances in Geosciences Vol. 5
ch11
3rd Reading April 20, 2006 16:56 WSPC/SPI-B368 Advances in Geosciences Vol. 5
ch11
BLUElink> OPERATIONAL OCEAN PREDICTION IN AUSTRALIA GARY B. BRASSINGTON∗,† , PETER R. OKE‡ and TIM PUGH∗ ∗Bureau of Meteorology Research Centre P.O. Box 1289K, Melbourne 3001, Australia †
[email protected] ‡CSIRO
Marine and Atmospheric Research Hobart 7000, Australia ‡
[email protected]
The Bureau of Meteorology is scheduled in 2007 to expand its oceanographic services to include operational mesoscale ocean forecasts. BLUElink> is a joint initiative of the Bureau of Meteorology, Commonwealth Scientific and Industrial Research Organisation and the Royal Australian Navy to develop this capability. The ocean model and data assimilation system have successfully completed an ocean reanalysis over the period 1992–2005 based on historical in situ and satellite altimetry observations and reanalyzed atmospheric fluxes. The model and assimilation components are being prepared with near real-time observations and atmospheric forecasts for operational trials.
1. Introduction Operational oceanography is a relatively new capability, which is following on from the on-going and successful implementation of the Global Ocean Observing System (GOOS). Operational oceanography, in this context, refers to the hindcast, nowcast and forecast of the three-dimensional ocean state (temperature, salinity and pressure) and currents for shortrange timescales out to one month. A pilot project called the Global Ocean Data Assimilation Experiment (GODAE)1 has set out a vision for supporting the development of data assimilation of GOOS into state of the art models of the global ocean circulation in near real-time (NRT). GODAE promotes the sharing of data, standardising of metrics for model intercomparisons and supporting common infrastructure, formats and protocols for data servicing. Several GODAE server nodes in both the USA2 and Europe3 now provide public domain access to NRT satellite and profile observational data. BLUElink> is an Australian government initiative to develop the Ocean Model Analysis and Prediction System (OceanMAPS) for operational implementation at the Bureau of Meteorology (Bureau). 87
3rd Reading April 20, 2006 16:56 WSPC/SPI-B368 Advances in Geosciences Vol. 5
ch11
G. B. Brassington, P. R. Oke and T. Pugh
88
2. Oceanographic Data Observational oceanography has seen a rapid expansion in earth observing instrumentation over the past two decades driven by the need to observe the climate system and conduct research into climate change science. The International Ocean Commission has implemented GOOS permanently. NASA, ESA and CNES have supported a number of remote sensing satellite programs including the Earth Observing System.4 Some of the oceanographic variables being remotely observed together with the instrumented satellites and launch dates are outlined in Table 1. In addition to satellite oceanography several in situ observational programmes have been undertaken including: Ship of Opportunity Program (SOOP) that deploy Expendable Bathy-Thermograph (XBT), Tropical Atmosphere Ocean (TAO) that maintains a network of moorings in the tropical Pacific and Argo, a program to deploy autonomous vertical profiling drifters. A significant number of these instruments contribute to the NRT ocean observing system, which are routinely distributed by the World Meteorological Organisation’s Global Telecommunications System (GTS) as well as internet servers. Accurate bathymetry is essential for the representation of ocean circulation and shelf current systems. BLUElink> has blended analyzed gridded products from Geoscience Australia including a 1 km resolution bathymetry dataset for the Australian region with global datasets from the US Navy. Ocean models are forced at the surface by atmospheric fluxes of momentum, heat and fresh water. Atmospheric forcing is available at the Bureau from Numerical Weather Prediction (NWP) systems run twice daily. The
Table 1. Earth observing satellites measuring ocean related variables that contribute to the near real-time global ocean observing system. Variables
Instruments
Launch
Sea surface temperature
AVHRR, AATSR, AMSR-E
. . . , 2000, 2002 2001 2001
Sea surface height
Topex-Poseidon, GFO Jason-1, ENVISAT
Sea surface salinity
Aquarius
2002
Wind stress
QuikSCAT
1999
1992 1998 2001 2002
3rd Reading April 20, 2006 16:56 WSPC/SPI-B368 Advances in Geosciences Vol. 5
BLUElink> Operational Ocean Prediction in Australia
ch11
89
Bureau supports the Global Assimilation and Prediction System5 (GASP) and the Limited Area Prediction System6 for the Australian region.
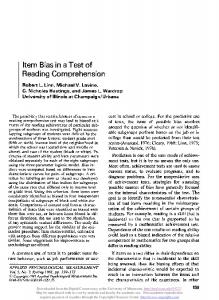
3. Operational Ocean Prediction System The Ocean Model Analysis and Prediction System (OceanMAPS) is based on the Ocean Forecast Australia Model (OFAM),7 the BLUElink> Ocean Data Assimilation System (BODAS),8 a data management system and enhanced surface winds from NWP and high-resolution SST products. The system is implemented at the Bureau/CSIRO High Performance Computing and Communications Centre (HPCCC) which is presently based on the NEC SX6 machine. 3.1. Ocean model development The Australian scientific community has a long and on-going relationship with Geophysical Fluid Dynamics Laboratory to adapt the Modular Ocean Model (MOM) software for Australian climate research applications. MOM Version49 is optimised for a scalable parallel architecture. This presents issues for performance of the software on alternative architectures such as the parallel vector NEC SX6 at the HPCCC. OFAM includes optimisation for the NEC SX6 with excellent results. The OFAM grid has been designed as a global model, to avoid complexities associated with open boundary conditions. The Australian region has 10 km horizontal resolution, which resolves mesoscale ocean variability. In order to minimise the costs of the model, the grid employs lower resolutions outside the Australian region as shown in Fig. 1, where the white dots
Fig. 1. Ocean Forecast Australia Model horizontal grid. Water cells are colored according the depth of bathymetry, every 10th grid point is shown as a white dot.
3rd Reading April 20, 2006 16:56 WSPC/SPI-B368 Advances in Geosciences Vol. 5
ch11
G. B. Brassington, P. R. Oke and T. Pugh
90
represent every 10th grid point. The vertical grid is comprised of 47 levels, with the top 20 levels at a resolution of 10 m. Each three-dimensional variable has dimension 1191 × 968 × 47 and a single snapshot is approximately 250 M bytes. A single snapshot of the five prognostic variables of the model is 1.2 Gbytes. The performance of the OFAM on the NEC SX6 has been measured during two ocean model only integrations (so called “spinup”) using ERA40.10 The first integration was performed using MOM4p0b, which included the leap-frog time integration scheme and neutral physics using a baroclinic timestep of 300 s. This was performed on 21 processors across three nodes sustaining 20.3 Gflops. The second integration was performed using MOM4p0d, which included a new time integration scheme without neutral physics using a baroclinic timestep of 600 s. This was performed on 42 processors across six nodes sustaining 31.8 Gflops demonstrating some problems in scalability of the MOM software. The usage values are summarised in Table 2. OFAM’s I/O requirements are outlined in Table 3 and include a complete ocean state specification either as initial conditions or a restart, O(5) Gbytes. 3.2. Data assimilation BODAS8 is a new software package developed to perform a multi-variate analysis based on statistics derived from the global ocean forecast system. The key feature of BODAS is the way it defines the background error covariances which is based on the stationary covariance of an ensemble Table 2.
Performance of OFAM (MOM4) on the NEC SX6.
Nodes Cpu’s (total) Memory (total) Cputime/model day Sustained flops
Spinup I
Spinup II
3 21 ∼86 GBytes 20 min 20.3 Gflops
6 42 ∼114 GBytes 11.5 min 31.8 Gflops
Table 3. Input files required for the Ocean Forecast Australia Model. Input files Grid specification Restart NWP surface fluxes SST analysis
Size ∼400 MBytes ∼5 GBytes ∼150 MBytes 23 MBytes
3rd Reading April 20, 2006 16:56 WSPC/SPI-B368 Advances in Geosciences Vol. 5
BLUElink> Operational Ocean Prediction in Australia
ch11
91
Fig. 2. Horizontal spatial correlations of sea surface height anomalies based on an ensemble of modelled states (a) Tasmania, (b) Indonesia (adapted from Ref. 8).
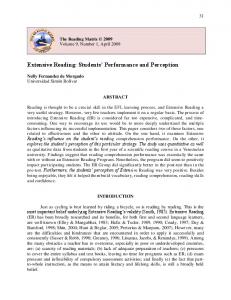
Fig. 3. BRAN surface temperature (10 m) in the Coral Sea for the January 6, 2000– 2002. The 29 degree isotherm is represented by the white contour. The 200 m isobath is represented by the black contour.
of intraseasonal anomalies derived from a 9-year spinup integration of the ocean model without data assimilation. An example of the spatial structure of the ensemble covariances is shown in Fig. 2 for a location, indicated by the star, situated off Indonesia with the immediate surroundings. This example appears to represent the covariability associated with an equatorial Kelvin wave and its coastal extension (the positive correlations); and a Rossby wave pair (the negative correlations near 80◦ E) associated with the equatorial wave guide of the Indian Ocean. 3.3. Ocean reanalysis OFAM and BODAS have been applied to construct an ocean reanalysis for the period 1992–2005. The BLUElink> ReANalysis (BRAN)7 uses delayed
3rd Reading April 20, 2006 16:56 WSPC/SPI-B368 Advances in Geosciences Vol. 5
92
ch11
G. B. Brassington, P. R. Oke and T. Pugh
mode observations including along track sea-level anomalies from altimetry (T/P, ERS, GFO, Jason, ENVISAT), coastal tide gauges, in-situ temperature and salinity profiles (WOCE, TAO, Argo, XBT) and analysed atmospheric forcing, ERA40.10 Assimilation is performed every three model days. BRAN represents the first eddy-resolving ocean analysis for the Australian region. Analyses show skill in surface currents as compared with surface drifter observations.8 An example of the analysed flow for sea surface temperature is shown in Fig. 3 for the Coral Sea. The three figures illustrate both the eddy scale variability as well as interannual variability for January 1, 2000–2002. The extensive warm intrusion shown in 2002 corresponds to a year of wide spread coral bleaching in the Great Barrier Reef. BODAS was parallelised into 40 zonal sections submitted as single processor jobs. BODAS uses a stationary set of background error covariance statistics, which is based on a 72 member ensemble of model anomalies, O(15) Gbytes. 3.4. Operational environment The Bureau’s operations branch has the central responsibility for issuing meteorological analyses and predictions and distributing this information to the community through a network of regional forecast centers. In addition to meteorological forecasts, the Bureau also produces a range of other services in climate, hydrology, and oceanography. Oceanographic services at present cover a modest range of operational products including, tides, sea surface and subsurface temperature analyses and wave forecasts. The implementation of a high-resolution three-dimensional ocean state analysis and forecast system represents a major upgrade in computational resource and servicing requirements. The high performance computational infrastructure that supports the operations branch is managed through the HPCCC. The core system, an NEC SX6, is accessed through an NQS based queue system that provides pre-emptive priority service to operational jobs while still providing services for research and development tasks performed by other sections of the Bureau and CSIRO. The SX6 is front-ended by dual NEC TX7 servers, each having 16 CPU and 16GB of memory. The TX7s provide global file system services for the SX6 nodes, and also scalar services for tasks associated with file transfers and data handling. Access to this common high-performance computing facility has been critical to the success of the BLUElink> project to date.
3rd Reading April 20, 2006 16:56 WSPC/SPI-B368 Advances in Geosciences Vol. 5
BLUElink> Operational Ocean Prediction in Australia
ch11
93
The SX6 includes high bandwidth, large scale storage and large shared memory per node that enable all of the data required for OceanMAPS to be stored for online operations. This structure minimises the interaction of the operational models with archive devices to post processing storage. The schedule for OceanMAPS is dependent on three inputs that are handled by the data management system, (a) NRT observations, (b) NWP surface fluxes, and (c) Sea surface temperature analyses. The system includes an analysis and forecast cycle that depends on the data management system for handling the distribution and servicing of products. The Bureau maintains communications with a variety of networks to support NRT observation retrievals and data distribution. The majority of ocean profile observations are obtained from the GTS. Satellite observations such as sea surface anomalies from JASON-1 are pushed from OCEANIDS and available approximately 5–7 hrs behind real-time. ENVISAT is obtained from ESA on a 3 day delay. Operational systems are designed to perform robustly to a regular schedule. The operational ocean system is planned to produce forecasts out to 7 days, twice per week. The prototype schedule includes: a symmetric analysis cycle for high-quality analyses, an asymmetric analysis cycle for forecast initial conditions and a forecast cycle. The symmetric analysis uses a symmetric observation window which is constrained by the time scale of one complete attimeter orbit (∼3 days behind real time) and is repeated daily using 3-day old analysed NWP fluxes. The asymmetric cycle uses an offcentred observation window and produces a nowcast and initial condition for the forecast. Both the analyses and forecasts depend on the availability of NWP fluxes and SST analyses. Both of these operational products have unique schedules. GASP is integrated twice daily at 0 UTC and 12 UTC while the analysis is performed every 6 hrs. SST is generated daily for the local region and weekly for the global domain. A forecast is then produced using NWP forecasts and fixed SST analyses (the boundary conditions of the NWP). The Bureau has recently implemented the Meteorological Archival and Retrieval System (MARS) to serve as the primary meteorological database. This system was developed by ECMWF and was designed for storage of NWP output. The system supports two file formats Gridded Binary (GRIB) and Binary Universal Form for the Representation of meteorological data (BUFR). Neither of these two formats are widely used or supported outside this community by other centres or software developers. The Bureau has
3rd Reading April 20, 2006 16:56 WSPC/SPI-B368 Advances in Geosciences Vol. 5
94
ch11
G. B. Brassington, P. R. Oke and T. Pugh
developed code to convert between file formats such as NetCDF and GRIB and BUFR. Data management and exchange in the BLUElink> project involves several emerging standards. This has involved significant development of new systems, including the integration of the back-end database with available OPeNDAP servers. The push to standardisation is often hard to justify in the course of a single project, and can seem like more risk than reward. The advantage of enabling these standards, however, rather than relying on technologies such as FTP, is that it enables data sharing in a highly automated fashion. Just as XML and machine-independent data standards are becoming increasingly popular in business, so scientific standards will become increasingly popular in institutions. OPeNDAP, an openly published data exchange specification, allows tighter integration between heterogeneous applications, ultimately reducing the effort of end users and application developers in accepting new data sources. Putting in the additional effort to use open technologies will encourage faster take-up across the community, allowing smaller projects to achieve high-level goals faster. OPeNDAP has the advantage of being highly scalable. Its ability to subselect data on the server side allows data providers to reduce bandwidth by sending only the data which is requested by the client. Highly flexible, OPeNDAP servers can be used to both aggregate external data sources into a single format, easing the task of integrating new data into existing applications, or as a universal publishing mechanism. The ability to abstract away the problem of data exchange is a powerful enabler of new technologies.
4. Conclusion The objective of BLUElink> is to produce the first operational forecasts of mesoscale ocean circulation for the Australian region. BLUElink> is halfway through the four-year contract period and will transition in focus from research and development to operational trials in 2006. The scale of the problem being undertaken is at the high-end of high performance computing and data management and will continue to pose interesting challenges to the Bureau. The development of this system has been constrained in its design to deliver the capability within the project period. There are numerous areas that have been identified for further development in a potential follow-on project and detailed analyses of the performance will offer additional insight. The scale of the analysis problem ensures that full use must
3rd Reading April 20, 2006 16:56 WSPC/SPI-B368 Advances in Geosciences Vol. 5
BLUElink> Operational Ocean Prediction in Australia
ch11
95
be made of the wider research community. Connectivity and cost-effective distribution of data to this community is a critical activity.
Acknowledgment This research is supported by the BLUElink project, Bureau of Meteorology, CSIRO and the Royal Australian Navy. The authors gratefully acknowledge the project leaders Andreas Schiller and Neville Smith and several other BLUElink team members for their valuable contributions. Atmospheric analyses were provided by ECMWF, satellite altimetry is provided by NASA, AVISO and NOAA. Bathymetry is derived from datasets from Geoscience Australia and the US Navy.
References 1. N. Smith and M. Lefebvre, International Symposium, Biarritz, October 15–17, (1997). 2. Naval Meteorology and Oceanography Command, (2005). 3. MERSEA/GMES, http://strand1.mersea.eu.org/ (2005). 4. A. McClung, http://eospso.gsfc.nasa.gov/, (2005). 5. R. Seaman, W. Bourke, P. Steinle, T. Hart, G. Embery, M. Naughton and L. Rikus, Aust. Met. Mag. 44 (1995) 1–18. 6. K. Puri, G. Dietachmayer, G. A. Mills, N. E. Davidson, R. A. Bowen and L. W. Logan, Aust. Met. Mag. 47 (1998) 203–233. 7. A. Schiller, P. R. Oke, G. B. Brassington, R. Fiedler, D. Griffin, J. Mansbridge, K. Ridgeway and N. R. Smith, Eddy-resolving Ocean Circulation in the Asian-Australian region inferred from an ocean reanalysis effort (in press). 8. P. R. Oke, A. Schiller, D. Griffin and G. B. Brassington, Ensemble data assimilation for an eddy-resolving ocean model of the Australian region, Q. J. R. Meteorol. Soc. (in press). 9. S. M. Griffies, M. J. Harrison, R. C. Pacanowski and A. Rosati, A Technical Guide to MOM4 GFDL Ocean Group Technical Report No. 5, NOAA/Geophysical Fluid Dynamics Laboratory Version prepared on December 23, 2003. 10. P. Kallberg, A. Simmons, S. Uppala and M. Fuentes, The ERA-40 archive. Reading, UK, European Centre for Medium-range Weather Forecasts (ECMWF), ECMWF Re-Analysis Project (ERA), 2004. 31p. ERA-40 Project Report Series, 17.