4326.0
2007
NATIONAL SURVEY OF MENTAL HEALTH AND WELLBEING: SUMMARY OF RESULTS EMBAR G O :
11.3 0 A M
(CAN B E R R A
TIME)
THUR S
AUSTR A L I A 23 OCT
2008
CON T E N T S page .. 2
.............................................. ............................................ Summary of Findings . . . . . . . . . . . . . . . . . . . . . . . . . . . . . . . . . . . . . . .
Notes
Introduction
4 7
TABLE S List of Tables
...........................................
26
ADDI T I O N A L INFOR M A T I O N
........................................ Appendices . . . . . . . . . . . . . . . . . . . . . . . . . . . . . . . . . . . . . . . . . . . . Technical Note . . . . . . . . . . . . . . . . . . . . . . . . . . . . . . . . . . . . . . . . . . Glossary . . . . . . . . . . . . . . . . . . . . . . . . . . . . . . . . . . . . . . . . . . . . . . Bibliography . . . . . . . . . . . . . . . . . . . . . . . . . . . . . . . . . . . . . . . . . . . Explanatory Notes
I N Q U I R I E S For further information about these and related statistics, contact the National Information and Referral Service on 1300 135 070.
w w w. a b s . g o v. a u
50 65 88 91 98
NO T E S
ABOU T THIS PUBL I C A T I O N
This publication presents a summary of results from the 2007 National Survey of Mental Health and Wellbeing, conducted by the Australian Bureau of Statistics (ABS) from August to December 2007. The survey collected information from approximately 8,800 Australians aged 16–85 years. The survey provides information on the prevalence of selected lifetime and 12-month mental disorders by three major disorder groups: Anxiety disorders (eg Social Phobia), Affective disorders (eg Depression) and Substance Use disorders (eg Alcohol Harmful Use). It also provides information on the level of impairment, the health services used for mental health problems, physical conditions, social networks and caregiving, as well as demographic and socio-economic characteristics. Mental health is one of Australia's National Health Priority Areas and funding for this survey was provided by the Australian Government Department of Health and Ageing. Information from the survey will contribute to research in the field of mental health and assist in the formulation of government policies and legislation.
INTE R P R E T A T I O N OF
The survey used the World Health Organization's (WHO) Composite International
RESU LT S
Diagnostic Interview (CIDI) for the diagnostic component of the survey. While the survey provides estimates on the prevalence of selected lifetime and 12-month mental disorders, the emphasis of this publication is on 12-month mental disorders.
RESPONSE RATES
As the response rate for this survey was lower than expected (60%), extensive non-response analyses were undertaken to assess the reliability of the survey estimates. As a result, adjustments were made to the weighting strategy. As non-response can vary across population characteristics, as well as across data items, users should exercise caution. See Reliability of Estimates in the Explanatory Notes.
COMPARISON WITH THE
The survey was run in 1997 as the National Survey of Mental Health and Wellbeing of
1997 SURVEY
Adults. Due to differences in how the data were collected, data from 1997 are not presented in this publication. See Appendix 2 for further information.
ACKN O W L E D G M E N T S
ABS publications draw extensively on information provided freely by individuals, businesses, governments and other organisations. Their continued cooperation is very much appreciated: without it, the wide range of statistics published by the ABS would not be available. Information received by the ABS is treated in strict confidence as required by the Census and Statistics Act 1905. The ABS would also like to acknowledge the extensive support and technical advice provided by Dr Tim Slade and Ms Amy Johnston from the University of New South Wales.
Ian Ewing Actin g Austr a l i a n Sta t i s t i c i a n
2
ABS • NAT I O N A L SUR V E Y OF MEN T A L HEA L T H AND WEL L B E I N G : SUMMA R Y OF RESU L T S • 432 6 . 0 • 200 7
ABBRE V I A T I O N S
ABS Australian Bureau of Statistics ANZSCO Australian and New Zealand Standard Classification of Occupations ANZSIC Australian and New Zealand Standard Industrial Classification AQoL Assessment of Quality of Life ASCED Australian Standard Classification of Education ASGC Australian Standard Geographical Classification BMI body mass index CAI computer assisted interviewing CD collection district CIDI Composite International Diagnostic Interview CURF confidentialised unit record file DoHA Australian Government Department of Health and Ageing DSM-IV Diagnostic and Statistical Manual of Mental Disorders, Fourth Edition GAD Generalised Anxiety Disorder GP General Medical Practitioner ICD-10 International Classification of Diseases 10th Revision kg kilogram m metre NHMRC National Health and Medical Research Council NRFUS non-response follow-up study OCD obsessive-compulsive disorder PTSD post-traumatic stress disorder RSE relative standard error SACC Standard Australian Classification of Countries SE standard error SEIFA Socio-Economic Indexes for Areas SMHWB National Survey of Mental Health and Wellbeing WHO World Health Organization WHODAS World Health Organization Disability Assessment Schedule WMH World Mental Health WMH–CIDI 3.0 World Mental Health Survey Initiative version of the World Health Organization's Composite International Diagnostic Interview, Version 3.0.
ABS • NAT I O N A L SUR V E Y OF MEN T A L HEA L T H AND WEL L B E I N G : SUMMA R Y OF RESU L T S • 432 6 . 0 • 200 7
3
INTR O D U C T I O N
INTR O DU C T I O N
Mental health is a state of emotional and social wellbeing. It influences how an individual copes with the normal stresses of life and whether he or she can achieve his or her potential. Mental health describes the capacity of individuals and groups to interact, inclusively and equitably with one another and with their environment, in ways that promote subjective wellbeing and optimise opportunities for development and use of mental abilities (Australian Health Ministers, 2003). The measurement of mental health is complex and is not simply the absence of mental illness. A mental illness is a clinically diagnosable disorder that significantly interferes with an individual's cognitive, emotional or social abilities (Australian Health Ministers, 2003). Mental illness encompasses short and longer term conditions, including Anxiety disorders (eg Agoraphobia), Affective or mood disorders (eg Depression) and Substance Use disorders (eg Alcohol Dependence). Depending on the disorder and its severity, people may require specialist management, treatment with medication and/or intermittent use of health care services. The 2007 National Survey of Mental Health and Wellbeing collected information on three major groups of mental disorders: Anxiety disorders; Affective disorders; and Substance Use disorders. This publication presents findings from the survey, with an emphasis on persons with a 12-month mental disorder, that is, persons with a lifetime mental disorder who experienced symptoms in the 12 months prior to the survey interview. The survey also collected information on the use of health services and medication for mental health problems, physical conditions, functioning and disability, social networks and caregiving, and a range of demographic and socio-economic characteristics.
BACKGROUND
Funding for the 2007 National Survey of Mental Health and Wellbeing (SMHWB) was provided by the Australian Government Department of Health and Ageing (DoHA). The survey was based on a widely-used international survey instrument, developed by the World Health Organization (WHO) for use by participants in the World Mental Health Survey Initiative. The Initiative is a global study aimed at monitoring mental and addictive disorders. It aims to collect accurate information about the prevalence of mental, substance use, and behavioural, disorders. It measures the severity of these disorders and helps to determine the burden on families, carers and the community. It also assesses who is treated, who remains untreated and the barriers to treatment. The survey has been run in 32 countries, representing all regions of the world. Most of the survey was based on the international survey modules; however, some modules, such as Health Service Utilisation, were tailored to fit the Australian context. The adapted modules were designed in consultation with subject matter experts from government and the research community. Where possible, adapted modules used existing ABS questions. A Survey Reference Group, comprising experts and key stakeholders in the field of mental health, provided the ABS with advice on survey content, including the most appropriate topics for collection, and associated concepts and definitions. They also provided advice on issues that arose during field tests and the most suitable survey outputs. Group members included representatives from government departments, universities, health research organisations, carers organisations and consumer groups.
4
ABS • NAT I O N A L SUR V E Y OF MEN T A L HEA L T H AND WEL L B E I N G : SUMMA R Y OF RESU L T S • 432 6 . 0 • 200 7
I N T R O D U C T I O N continued
OVERVIEW
The National Survey of Mental Health and Wellbeing (SMHWB) was conducted from August to December 2007 with a representative sample of people aged 16–85 years who lived in private dwellings across Australia. Broadly, it collected information about: !
lifetime and 12-month prevalence of selected mental disorders;
!
level of impairment for these disorders;
!
physical conditions;
!
health services used for mental health problems, such as consultations with health practitioners or visits to hospital;
!
social networks and caregiving; and
!
demographic and socio-economic characteristics.
A summary of the findings from the survey are presented in this publication through text, diagrams and tables. As this publication is a Summary of Results, not all of the information collected in the survey can be presented. For people who wish to undertake more detailed analysis of the survey data, special tabulations are available on request. Two confidentialised unit record files (CURFs) are planned for release in early 2009. See Products and Services in the Explanatory Notes. MEASURING MENTAL
Measuring mental health in the community through household surveys is a complex task
HEALTH
as mental disorders are usually determined through detailed clinical assessment. To estimate the prevalence of specific mental disorders, the 2007 National Survey of Mental Health and Wellbeing used the World Mental Health Survey Initiative version of the World Health Organization's Composite International Diagnostic Interview, version 3.0 (WMH–CIDI 3.0). The WMH–CIDI 3.0 was chosen because it: !
provides a fully structured diagnostic interview;
!
can be administered by lay interviewers;
!
is widely used in epidemiological surveys;
!
is supported by the World Health Organization (WHO); and
!
provides comparability with similar surveys conducted worldwide.
The WMH–CIDI 3.0 provides an assessment of mental disorders based on the definitions and criteria of two classification systems: the DIAGNOSTIC AND STATISTICAL MANUAL OF MENTAL DISORDERS, FOURTH EDITION (DSM–IV); and the WHO INTERNATIONAL CLASSIFICATION OF DISEASES, TENTH REVISION (ICD–10). Each classification system lists sets of criteria that are necessary for diagnosis. The criteria specify the nature and number of symptoms required; the level of distress or impairment required; and the exclusion of cases where symptoms can be directly attributed to general medical conditions, such as a physical injury, or to substances, such as alcohol. Data in this publication are presented using the ICD–10 classification system. More information on the WMH–CIDI 3.0 diagnostic assessment criteria according to the ICD–10 is provided in Appendix 1.
ABS • NAT I O N A L SUR V E Y OF MEN T A L HEA L T H AND WEL L B E I N G : SUMMA R Y OF RESU L T S • 432 6 . 0 • 200 7
5
I N T R O D U C T I O N continued
COMPARISON WITH THE
In 1997 the ABS conducted the first National Survey of Mental Health and Wellbeing of
1997 SURVEY
Adults. The survey provided information on the prevalence of selected 12-month mental disorders, the level of disability associated with those disorders, health services used, and perceived need for help with a mental health problem, for Australians aged 18 years and over. The survey was an initiative of, and was funded by, the then Commonwealth Department of Health and Family Services, as part of the National Mental Health Strategy. A key aim of the 1997 survey was to provide prevalence estimates for mental disorders in a 12 month time-frame. Therefore, diagnostic criteria were assessed solely on respondents' experiences in the 12 months prior to the survey interview. In comparison, the 2007 National Survey of Mental Health and Wellbeing was designed to provide lifetime prevalence estimates for mental disorders. Respondents aged 16–85 years were asked about experiences throughout their lifetime. In the 2007 survey 12-month diagnoses were based on lifetime diagnosis and the presence of symptoms of that disorder in the 12 months prior to the survey interview. The full diagnostic criteria were not assessed within the 12 month time-frame. Users should exercise caution when comparing data from the two surveys. More information on comparability is provided in the Explanatory Notes. A list of the broad differences between the two surveys is also provided in Appendix 2 and further information will be available in the National Survey of Mental Health and Wellbeing: Users' Guide (cat. no. 4327.0), planned for release on the ABS website in late 2008.
6
ABS • NAT I O N A L SUR V E Y OF MEN T A L HEA L T H AND WEL L B E I N G : SUMMA R Y OF RESU L T S • 432 6 . 0 • 200 7
SUMMA R Y OF FINDI N G S
PREV A L E N C E OF MEN T A L
The 2007 National Survey of Mental Health and Wellbeing (SMHWB) was designed to
DISO R D E R S
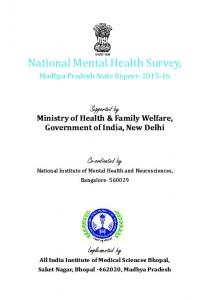
provide lifetime prevalence estimates for mental disorders. Respondents were asked about experiences throughout their lifetime. In this survey, 12-month diagnoses were derived based on lifetime diagnosis and the presence of symptoms of that disorder in the 12 months prior to the survey interview. Assessment of mental disorders presented in this publication are based on the definitions and criteria of the WORLD HEALTH ORGANIZATION'S (WHO) INTERNATIONAL CLASSIFICATION OF DISEASES, TENTH REVISION (ICD–10). Prevalence rates are presented with hierarchy rules applied (ie a person will not meet the criteria for particular disorders because the symptoms are believed to be accounted for by the presence of another disorder). Information on hierarchy rules is provided in the Explanatory Notes and Appendix 1. In this publication, Tables 1 and 2 provide an overview of the prevalence of mental disorders, with Table 1 focussing on people who had lifetime mental disorders and Table 2 focussing on the subset of people who had 12-month mental disorders. Of the 16 million Australians aged 16–85 years, almost half (45% or 7.3 million) had a lifetime mental disorder, ie a mental disorder at some point in their life. One in five (20% or 3.2 million) Australians had a 12-month mental disorder. There were also 4.1 million people who had experienced a lifetime mental disorder but did not have symptoms in the 12 months prior to the survey interview.
Total persons aged 16–85 years 16 015 300 (100%)
Any lifetime mental disorder(a)
No lifetime mental disorder
7 286 600 (45%)
8 728 700 (55%)
Any 12-month mental disorder(b)
No 12-month mental disorder
3 197 800 (20%)
4 088 800 (25%)
(a) Persons who met criteria for diagnosis of a lifetime mental disorder (with hierarchy). (b) Persons who met criteria for diagnosis of a lifetime mental disorder (with hierarchy) and had symptoms in the 12 months prior to interview.
ABS • NAT I O N A L SUR V E Y OF MEN T A L HEA L T H AND WEL L B E I N G : SUMMA R Y OF RESU L T S • 432 6 . 0 • 200 7
7
S U M M A R Y O F F I N D I N G S continued
PREVALENC E OF
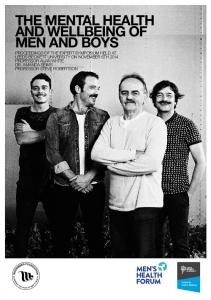
Prevalence of mental disorders is the proportion of people in a given population who
12-MONTH MENTAL
met the criteria for diagnosis of a mental disorder at a point in time. The diagram below
DISORDERS
shows the 12-month prevalence rates for each of the major disorder groups (Anxiety, Affective and Substance Use) and prevalence rates for each of the mental disorders within each group.
Any 12-month mental disorder(a)(b) (20%)
Anxiety disorders(b) (14.4%)
Affective disorders(b) (6.2%)
Panic Disorder (2.6%) Agoraphobia (2.8%) Social Phobia (4.7%) Generalised Anxiety Disorder (2.7%) Obsessive-Compulsive Disorder (1.9%) Post-Traumatic Stress Disorder (6.4%)
Depressive Episode(c) (4.1%) Dysthymia (1.3%) Bipolar Affective Disorder (1.8%)
Substance Use disorders(b) (5.1%) Alcohol Harmful Use (2.9%) Alcohol Dependence (1.4%) Drug Use Disorders(d) (1.4%)
(a) Persons who met criteria for diagnosis of a lifetime mental disorder (with hierarchy) and had symptoms in the 12 months prior to interview. (b) A person may have had more than one mental disorder. T he components when added may therefore not add to the total shown. (c) Includes Severe Depressive Episode, Moderate Depressive Episode, and Mild Depressive Episode. (d) Includes Harmful Use and Dependence.
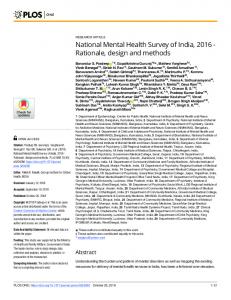
There were 3.2 million people who had a 12-month mental disorder. In total, 14.4% (2.3 million) of Australians aged 16–85 years had a 12-month Anxiety disorder, 6.2% (995,900) had a 12-month Affective disorder and 5.1% (819,800) had a 12-month Substance Use disorder. Women experienced higher rates of 12-month mental disorders than men (22% compared with 18%). Women experienced higher rates than men of Anxiety (18% and 11% respectively) and Affective disorders (7.1% and 5.3% respectively). However, men had twice the rate of Substance Use disorders (7.0% compared with 3.3% for women). 1. 12 - M O N T H ME N T A L DI S O R D E R S (a ) , by Ma j o r di s o r d e r gr o u p % 25
Males Females
20 15 10 5 0 Anxiety disorders
Affective disorders
Substance Use disorders
Any 12-month mental disorder
(a) Persons who met criteria for diagnosis of a lifetime mental disorder (with hierarchy) and had symptoms in the 12 months prior to interview. A person may have had more than one mental disorder.
8
ABS • NAT I O N A L SUR V E Y OF MEN T A L HEA L T H AND WEL L B E I N G : SUMMA R Y OF RESU L T S • 432 6 . 0 • 200 7
S U M M A R Y O F F I N D I N G S continued
PREVALENC E OF
The prevalence of 12-month mental disorders varies across age groups, with people in
12-MONTH MENTAL
younger age groups experiencing higher rates of disorder. More than a quarter (26%) of
DISORDERS continued
people aged 16–24 years and a similar proportion (25%) of people aged 25–34 years had a 12-month mental disorder compared with 5.9% of those aged 75–85 years old. 2. 12 - M O N T H ME N T A L DI S O R D E R S (a ) , by Ag e ( b ) % 30 25 20 15 10 5 0 16–24
25–34
35–44
45–54 55–64 Age group (years)
65–74
75–85
(a) Persons who met criteria for diagnosis of a lifetime mental disorder (with hierarchy) and had symptoms in the 12 months prior to interview. A person may have had more than one mental disorder. (b) Persons who had a 12-month mental disorder as a proportion of all persons in that same age group.
Among all age groups 12-month Anxiety disorders had the highest prevalence, with the highest rate in the 35–44 years age group (18%). People in younger age groups had higher prevalence of 12-month Substance Use disorders (ie the harmful use and/or dependence on alcohol and/or drugs). Of the 2.5 million people aged 16–24 years, 13% (323,500) had a 12-month Substance Use disorder. 3. 12 - M O N T H ME N T A L DI S O R D E R S (a ) , by Ma j o r di s o r d e r gr o u p an d ag e % 20
Anxiety disorders Affective disorders Substance Use disorders
15
10
5
0 16–24
25–34
35–44
45–54 55–64 Age group (years)
65–74
75–85
(a) Persons who met criteria for diagnosis of a lifetime mental disorder (with hierarchy) and had symptoms in the 12 months prior to interview. A person may have had more than one mental disorder.
Women aged 16–24 years had nearly twice the prevalence of 12-month Affective disorders compared with men in the same age group (8.4% and 4.3% respectively). Men aged 25–34 years had more than three times the prevalence of 12-month Substance Use disorders compared with women in the same age group (11.3% and 3.3% respectively). Women aged 25–34 years experienced almost twice the prevalence of 12-month Anxiety disorders, compared with men (21% and 12% respectively).
ABS • NAT I O N A L SUR V E Y OF MEN T A L HEA L T H AND WEL L B E I N G : SUMMA R Y OF RESU L T S • 432 6 . 0 • 200 7
9
S U M M A R Y O F F I N D I N G S continued
12-MONTH MENTAL
12-MO N T H ANX IE T Y DISO R D E R S
DISORDERS
Anxiety disorders generally involve feelings of tension, distress or nervousness. A person may avoid, or endure with dread, situations which cause these types of feelings. Anxiety disorders comprise: Panic Disorder, Agoraphobia, Social Phobia, Generalised Anxiety Disorder (GAD), Obsessive-Compulsive Disorder (OCD) and Post-Traumatic Stress Disorder (PTSD). Of people aged 16–85 years, 14.4% (2.3 million) had a 12-month Anxiety disorder. PTSD and Social Phobia were the most prevalent Anxiety disorders (6.4% and 4.7% respectively). Women experienced higher rates of PTSD than men (8.3% compared with 4.6% respectively) and also Social Phobia (5.7% compared with 3.8%). 4. 12 - M O N T H AN X I E T Y DI S O R D E R S (a ) Males Females
Panic Disorder Agoraphobia Social Phobia Generalised Anxiety Disorder Obsessive-Compulsive Disorder Post-Traumatic Stress Disorder 0
2.5
5.0 %
7.5
10.0
(a) Persons who met criteria for diagnosis of a lifetime mental disorder (with hierarchy) and had symptoms in the 12 months prior to interview. A person may have had more than one Anxiety disorder.
12-MO N T H AFFEC T I V E DISO R D E R S
Affective disorders involve mood disturbance, or change in affect. Most of these disorders tend to be recurrent and the onset of individual episodes can often be related to stressful events or situations. Affective disorders comprise: Depressive Episode, Dysthymia and Bipolar Affective Disorder. Of people aged 16–85 years, 6.2% (995,900) had a 12-month Affective disorder. Depressive Episode was the most prevalent Affective disorder (4.1%). Women experienced a higher rate of Depressive Episode than men (5.1% compared with 3.1%). 5. 12 - M O N T H AF F E C T I V E DI S O R D E R S (a ) Males Females
Depressive Episode(b)
Dysthymia
Bipolar Affective Disorder
0
2.5
5.0
7.5
% (a) Persons who met criteria for diagnosis of a lifetime mental disorder (with hierarchy) and had symptoms in the 12 months prior to interview. A person may have had more than one Affective disorder. (b) Includes Severe Depressive Episode, Moderate Depressive Episode, and Mild Depressive Episode.
10
ABS • NAT I O N A L SUR V E Y OF MEN T A L HEA L T H AND WEL L B E I N G : SUMMA R Y OF RESU L T S • 432 6 . 0 • 200 7
S U M M A R Y O F F I N D I N G S continued
12-MONTH MENTAL
12-MO N T H SUBST A N C E USE DISO R D E R S
DISORDERS continued
Substance Use disorders involve the harmful use and/or dependence on alcohol and/or drugs and comprise: Alcohol Harmful Use, Alcohol Dependence and Drug Use disorders. Harmful Use is the pattern of use of alcohol or drugs that is responsible for (or substantially contributes to) physical or psychological harm, including impaired judgement or dysfunctional behaviour. Dependence is a maladaptive pattern of use in which the use of alcohol or drugs takes on a much higher priority for a person than other behaviours that once had greater value. The central characteristic of Dependence is the strong, sometimes overpowering, desire to take the substance despite significant substance-related problems. Drug Use includes the use of illicit substances and the misuse of prescribed medicines. Four drug categories were included in this survey: !
sedatives, eg serepax, sleeping pills, valium
!
stimulants, eg amphetamines, speed
!
cannabinoids eg marijuana
!
opioids, eg heroin, methadone, opium.
Of people aged 16–85 years, 5.1% (819,800) had a 12-month Substance Use disorder. Alcohol Harmful Use was the most prevalent Substance Use disorder (2.9%). Men experienced higher rates of 12-month Substance Use disorders than women (7.0% and 3.3% respectively). They also had nearly twice the rate of Alcohol Harmful Use (3.8% of men and 2.1% of women). 6. 12 - M O N T H SU B S T A N C E US E DI S O R D E R S (a ) Males Females
Alcohol Harmful Use
Alcohol Dependence
Drug Use disorders(b)
0
2.5
5.0
7.5
% (a) Persons who met criteria for diagnosis of a lifetime mental disorder (with hierarchy) and had symptoms in the 12 months prior to interview. A person may have had more than one Substance Use disorder. (b) Includes Harmful Use and Dependence.
ABS • NAT I O N A L SUR V E Y OF MEN T A L HEA L T H AND WEL L B E I N G : SUMMA R Y OF RESU L T S • 432 6 . 0 • 200 7
11
S U M M A R Y O F F I N D I N G S continued
POPULATION
Mental health and mental illnesses are determined by multiple and interacting social,
CHARAC TERISTIC S
psychological, and biological factors, just as they generally are in health and illness (WHO, 2005). Mental health may be impacted by individual or societal factors, including economic disadvantage, poor housing, lack of social support and the level of access to, and use of, health services. A person's socio-economic circumstances (eg employment), may impact on their likelihood of developing a mental disorder. Studies have shown that people of lower socio-economic status have a higher prevalence of mental disorders, particularly Depression, and certain Anxiety disorders (Fryers et al, 2005). Mental illness may also impact on a person's employment, housing, social support, etc. Tables 4 and 5 explore the prevalence of 12-month mental disorders by selected household and population characteristics, including: family composition of household; household income; labour force status; level of highest non-school qualification; country of birth; and marital status. LIVIN G ARRAN G E M E N T S
Living arrangements give some indication of the level of social support that a person is able to access. People in some living arrangements are more likely to have a mental disorder than others. However, it should be noted that some observed differences may be due to the relationship between living arrangements and age. Of the 745,100 people aged 16–85 years living in a one parent family with children, more than a third (34%) had a 12-month mental disorder. In comparison, 14% of the 4.4 million people living in a couple only households had a 12-month mental disorder. People living in a one parent family with children had a higher prevalence of Anxiety disorders (26%) than other types of households, while people living in group households were more likely to have a Substance Use disorder (13%). 7. 12 - M O N T H ME N T A L DI S O R D E R S (a ) , by Fa m i l y co m p o s i t i o n of ho u s e h o l d Couple family with children One parent family with children Couple only Other one family household Multiple family household Lone person Group household 0
5
10
15
20 %
25
30
35
40
(a) Persons who met criteria for diagnosis of a lifetime mental disorder (with hierarchy) and had symptoms in the 12 months prior to interview. A person may have had more than one mental disorder.
12
ABS • NAT I O N A L SUR V E Y OF MEN T A L HEA L T H AND WEL L B E I N G : SUMMA R Y OF RESU L T S • 432 6 . 0 • 200 7
S U M M A R Y O F F I N D I N G S continued
POPULATION CHARAC TERISTIC S continued
L I V I N G A R R A N G E M E N T S continued
Marital status has also been shown to be related to a person's physical and mental health. People who had never been married experienced almost twice the prevalence of 12-month mental disorders compared with people who were married or living in a de facto relationship (28% and 15% respectively). However, this may be partly explained by the number of young people who have never been married, and their higher prevalence of 12-month Substance Use disorders. The prevalence of Substance Use disorders for people who had never been married was more than four times as high as the rate for people who were married or living in a de facto relationship (11.1% compared with 2.5% respectively). 8. 12 - M O N T H ME N T A L DI S O R D E R S (a ) , by Ma r i t a l st a t u s % 20
Married/de facto Separated/divorced/widowed Never married
15
10
5
0 Anxiety disorders
Affective disorders
Substance Use disorders
(a) Persons who met criteria for diagnosis of a lifetime mental disorder (with hierarchy) and had symptoms in the 12 months prior to interview. A person may have had more than one mental disorder.
LABOU R FORCE STAT U S
Education, employment and income are closely related socio-economic characteristics. People with higher educational attainment are more likely to be employed, and of employed people, are more likely to be in a higher skilled occupation (ABS, 2007). Economically disadvantaged people, such as those who are unemployed, are more vulnerable to mental illnesses, as they are more likely to experience insecurity, hopelessness, rapid social change, and risks to their physical health (WHO, 2005). People who have mental illness may also be more likely to fall into economic disadvantage. A person's ability to sustain themselves and to be a productive member of society, may impact on their mental health and wellbeing. Being unemployed may increase the likelihood of developing mental disorders (Fryers et al, 2005).
ABS • NAT I O N A L SUR V E Y OF MEN T A L HEA L T H AND WEL L B E I N G : SUMMA R Y OF RESU L T S • 432 6 . 0 • 200 7
13
S U M M A R Y O F F I N D I N G S continued
POPULATION CHARAC TERISTIC S continued
L A B O U R F O R C E S T A T U S continued
Of the 413,600 unemployed people, 29% had a 12-month mental disorder. In comparison, 20% of the 10.4 million people who were employed had a 12-month mental disorder. Unemployed people experienced almost twice the prevalence of Substance Use disorders than employed people (11.1% and 6.0% respectively) and almost three times the prevalence of Affective disorders (15.9% and 5.7% respectively). More than a third of unemployed women (34%) and more than a quarter of unemployed men (26%) had a 12-month mental disorder. Men who were not in the labour force had the lowest prevalence of 12-month mental disorders (14%). 9. 12 - M O N T H ME N T A L DI S O R D E R S (a ) , by La b o u r fo r c e st a t u s % 40
Males Females
30 20
10 0 Employed full-time
Employed part-time
Unemployed
Not in the labour force
(a) Persons who met criteria for diagnosis of a lifetime mental disorder (with hierarchy) and had symptoms in the 12 months prior to interview. A person may have had more than one mental disorder.
LIFE EXPER I E N C E S
People may be more or less likely to develop a mental disorder, depending on their life experiences. This survey collected information on a selection of life experiences, including homelessness and incarceration. Of the 484,400 people who reported ever being homeless, more than half (54%) had a 12-month mental disorder, which is almost three times the prevalence of people who reported they had never been homeless (19%). Of the people who reported ever being homeless, 39% had a 12-month Anxiety disorder, 28% had a 12-month Affective disorder and 18% had a 12-month Substance Use disorder. 10 . % 60
12 - M O N T H ME N T A L DI S O R D E R S (a ) , by Ho m e l e s s n e s s Has ever been homeless Has never been homeless
50 40 30 20 10 0 Anxiety disorders
Affective disorders
Substance Use disorders
Any 12-month mental disorder
(a) Persons who met criteria for diagnosis of a lifetime mental disorder (with hierarchy) and had symptoms in the 12 months prior to interview. A person may have had more than one mental disorder.
14
ABS • NAT I O N A L SUR V E Y OF MEN T A L HEA L T H AND WEL L B E I N G : SUMMA R Y OF RESU L T S • 432 6 . 0 • 200 7
S U M M A R Y O F F I N D I N G S continued
POPULATION CHARAC TERISTIC S continued
L I F E E X P E R I E N C E S continued
Of the 385,100 people who reported they had ever been incarcerated, 41% had a 12-month mental disorder, which is more than twice the prevalence of people who reported they had never been incarcerated (19%). People who reported they had ever been incarcerated experienced almost five times the prevalence of 12-month Substance Use disorders (23% compared with 4.7%), more than three times the prevalence of 12-month Affective disorders (19% compared with 5.9%), and almost twice the prevalence of 12-month Anxiety disorders (28% compared with 14.1%). 11 . % 50
12 - M O N T H ME N T A L DI S O R D E R S (a ) , by In c a r c e r a t i o n ( b ) Has ever been incarcerated Has never been incarcerated
40 30 20 10 0 Anxiety disorders
Affective disorders
Substance Use disorders
Any 12-month mental disorder
(a) Persons who met criteria for diagnosis of a lifetime mental disorder (with hierarchy) and had symptoms in the 12 months prior to interview. A person may have had more than one mental disorder. (b) Time spent in gaol, prison or a correctional facility.
CONTA C T WITH FAMI L Y AND FRIE N DS
Interaction with other people is vital to human development. Social relationships and networks can act as protective factors against the onset or recurrence of mental illness and enhance recovery from mental disorders (WHO, 2005). Tables 6 and 7 provide information on the social networks that people have access to and the frequency of contact with their family and friends. The prevalence of 12-month mental disorders was very similar for people who did and did not have contact with their family. Of the 15.9 million people who had contact with their family, one in five (20%) had a 12-month mental disorder. Of the 121,800 people who had no contact with their family or no family, just under a quarter (23%) had a 12-month mental disorder. However, the prevalence of 12-month mental disorders for people who did and did not have contact with their friends was quite different. Of the 15.7 million people who had contact with their friends, one in five (20%) had a 12-month mental disorder, but for the 352,500 who had no contact with friends or no friends, 38% had a 12-month mental disorder.
ABS • NAT I O N A L SUR V E Y OF MEN T A L HEA L T H AND WEL L B E I N G : SUMMA R Y OF RESU L T S • 432 6 . 0 • 200 7
15
S U M M A R Y O F F I N D I N G S continued
POPULATION CHARAC TERISTIC S continued
C O N T A C T W I T H F A M I L Y A N D F R I E N D S continued
Of the people who had contact with their family, those who had family members to rely on or family members to confide in were less likely to have a 12-month mental disorder. One in three people with no family members to rely on (33%) or confide in (33%) had a 12-month mental disorder, compared with around one in six people with three or more family members to rely on (17%) or confide in (15%). Of the people who had contact with their friends, those who had friends to rely on or friends to confide in were also less likely to have a 12-month mental disorder. Around a quarter (25% and 22% respectively) of the people with no friends to rely on or confide in had a 12-month mental disorder, compared with 18% each for the people with three or more friends to rely on or confide in.
SELEC TED PHYSICAL AND
SELEC T E D HEALT H RISK FACT O R S
MENTAL HEALTH
Certain health risk factors have an association with mental health problems or mental
CHARAC TERISTIC S
illness. A number of lifestyle or behavioural factors have been identified as positively and/or negatively impacting on health. These include: level of exercise (physical activity); overweight and obesity; tobacco use (smoking); alcohol consumption; and misuse of drugs (including the use of illicit drugs and/or the misuse of prescribed medicines). Table 8 provides information about each of these selected health risk factors. Health risks may also be indicated through information about other health and related characteristics, such as the presence of a long-term, or chronic condition. Table 9 provides information on physical conditions, level of psychological distress, suicidal behaviour, disability status, and number of days out of role. SMO KE R STAT U S
Smoking leads to a wide range of health problems, including cancer and cardiovascular disease. The relationship between smoking and mental illness is complex, as mental illness is also a risk factor for smoking (Access Economics, 2007). Of the 3.6 million people who identified as current smokers, almost a third (32%) had a 12-month mental disorder. Current smokers had twice the prevalence of 12-month mental disorders compared with people who had never smoked. Of the 8.1 million people who had never smoked, 16% had a 12-month mental disorder.
16
ABS • NAT I O N A L SUR V E Y OF MEN T A L HEA L T H AND WEL L B E I N G : SUMMA R Y OF RESU L T S • 432 6 . 0 • 200 7
S U M M A R Y O F F I N D I N G S continued
SELEC TED PHYSICAL AND MENTAL HEALTH CHARAC TERISTIC S continued
S M O K E R S T A T U S continued
Current smokers also experienced four times the prevalence of 12-month Substance Use disorders (12%), nearly three times the prevalence of 12-month Affective disorders (12%) and twice the prevalence of 12-month Anxiety disorders (22%) compared with people who had never smoked (3.1%, 4.5%, and 11.1% respectively). 12 . % 40
12 - M O N T H ME N T A L DI S O R D E R S (a ) , by Sm o k e r st a t u s Current smoker(b) Never smoked
30 20 10 0 Anxiety disorders
Affective disorders
Substance Use disorders
Any 12-month mental disorder(a)
(a) Persons who met criteria for diagnosis of a lifetime mental disorder (with hierarchy) and had symptoms in the 12 months prior to interview. A person may have more than one mental disorder. (b) Daily and other smoker.
ALCOH O L CONS U M P T I O N
Excessive alcohol consumption is a health risk factor that contributes to morbidity and mortality. Alcohol consumption may also interact with mental health in various ways, including: !
people who are diagnosed as having an Alcohol Dependence are more likely to suffer from other mental health problems; and
!
people with mental health problems are at particular risk of experiencing problems relating to alcohol (Department of Veteran's Affairs, 2004).
Of the 2.8 million people who reported that they drank nearly every day, more than one in five (21%) had a 12-month mental disorder. Slightly less (18%) of the 6 million people who reported that they drank less than once a month had a 12-month mental disorder. 13 . % 25
12 - M O N T H ME N T A L DI S O R D E R S (a ) , by Al c o h o l co n s u m p t i o n ( b ) Nearly every day Less than once a month(c)
20 15 10 5 0 Anxiety disorder
Affective disorder
Substance Use disorder
Any 12-month mental disorder(a)
(a) Persons who met criteria for diagnosis of a lifetime mental disorder (with hierarchy) and had symptoms in the 12 months prior to interview. A person may have had more than one mental disorder. (b) Frequency in the 12 months prior to interview. See Alcohol consumption in the Glossary. (c) Includes persons who did not drink in the 12 months prior to interview and those who have never had a drink.
ABS • NAT I O N A L SUR V E Y OF MEN T A L HEA L T H AND WEL L B E I N G : SUMMA R Y OF RESU L T S • 432 6 . 0 • 200 7
17
S U M M A R Y O F F I N D I N G S continued
SELEC TED PHYSICAL AND MENTAL HEALTH CHARAC TERISTIC S continued
A L C O H O L C O N S U M P T I O N continued
While there were only slight differences in the overall prevalence rates for these two groups, there were significant differences in the prevalence of 12-month Substance Use disorders. People who reported that they drank nearly every day had more than 10 times the prevalence of 12-month Substance Use disorders compared with people who reported that they drank less than once a month (10.5% and 1.0% respectively). MISU S E OF DRU G S
In this survey, the misuse of drugs refers to the use of illicit substances and/or the misuse of prescribed medicines. People must have misused the same drug more than five times in their lifetime before being asked about their use of drugs in the 12 months prior to the survey interview. Personal and social problems from drug misuse may be substantial and can interfere with personal relationships, employment and psychological health. The misuse of drugs may exacerbate the symptoms of mental illness. For example, Opioid Dependence is often accompanied by high rates of mental disorder, particularly Depression, Social Phobia and other Anxiety disorders. The existence of a mental disorder may also exacerbate drug misuse. For example, people with Anxiety disorders experience high rates of alcohol and drug problems (NCETA, 2004). Of the 183,900 people who misused drugs nearly every day in the 12 months prior to the survey interview, almost two-thirds (63%) had a 12-month mental disorder. Almost half (49%) of the people who misused drugs nearly every day had a 12-month Substance Use disorder, 38% had a 12-month Anxiety disorder, and 31% had a 12-month Affective disorder. 14 . % 70
12 - M O N T H ME N T A L DI S O R D E R S (a ) , by Mi s u s e of dr u g s ( b ) Nearly every day Has never misused drugs(c)
60 50 40 30 20 10 0 Anxiety disorder
Affective disorder
Substance Use disorder
Any 12-month mental disorder
(a) Persons who met criteria for diagnosis of a lifetime mental disorder (with hierarchy) and had symptoms in the 12 months prior to interview. A person may have had more than one mental disorder. (b) In the 12 months prior to interview. See Misuse of drugs in the Glossary. (c) Includes persons who have never used drugs and persons who may have used the same drug less than 5 times in their lifetime.
18
ABS • NAT I O N A L SUR V E Y OF MEN T A L HEA L T H AND WEL L B E I N G : SUMMA R Y OF RESU L T S • 432 6 . 0 • 200 7
S U M M A R Y O F F I N D I N G S continued
SELEC TED PHYSICAL AND
LEVEL OF PSY CH O L O G I C A L DIST R E S S (K10)
MENTAL HEALTH
The Kessler Psychological Distress Scale (K10) is a widely used indicator, which gives a
CHARAC TERISTIC S
simple measure of psychological distress. The K10 is based on 10 questions about a
continued
person's emotional state during the 30 days prior to the survey interview. Research has found a strong association between high scores on the K10 and the diagnosis of Anxiety and Affective disorders through the current WMH–CIDI (version 3.0). There is also a lesser, but still significant association between the K10 and other mental disorder categories, or the presence of any current mental disorder (Andrews & Slade, 2001). Of the 409,300 people who had a 'very high' K10 score, 80% had a 12-month mental disorder. More than half (57%) of the 1.1 million people who had a 'high' K10 score also had a 12-month mental disorder. In comparison, there were 11.4 million people who had a 'low' K10 score, of whom, 11% had a 12-month mental disorder. 15 . 12 - M O N T H ME N T A L DI S O R D E R S (a ) , by Le v e l of ps y c h o l o g i c a l di s t r e s s ( b ) % 90 75 60 45 30 15 0 Low
Moderate
High
Very high
(a) Persons who met criteria for diagnosis of a lifetime mental disorder (with hierarchy) and had symptoms in the 12 months prior to interview. A person may have had more than one mental disorder. (b) In the 30 days prior to interview. See Psychological distress in the Glossary.
SUICI D A L BEHAV I O U R
Suicide is the main cause of premature death among people with a mental illness. More than 10% of people with a mental illness die by suicide within the first 10 years of diagnosis (SANE, 2008). An attempt of suicide may also be a sign that a mental illness is developing. In this survey, people were asked about suicidal behaviour in their lifetime and in the 12 months prior to the survey interview (refer to Table 9). Of the 368,100 people who reported suicidal ideation in the 12 months prior to the survey interview (that is they had serious thoughts about committing suicide), almost three-quarters (72%) had a 12-month mental disorder.
ABS • NAT I O N A L SUR V E Y OF MEN T A L HEA L T H AND WEL L B E I N G : SUMMA R Y OF RESU L T S • 432 6 . 0 • 200 7
19
S U M M A R Y O F F I N D I N G S continued
SELEC TED PHYSICAL AND
DISAB I L I T Y STAT U S
MENTAL HEALTH
Disability can be described in a number of ways, including: an impairment in body
CHARAC TERISTIC S
structure or function; a limitation in activities (eg mobility and communication); or a
continued
restriction in participation (eg social interaction and work). These different aspects of disability can exist in varying degrees and combinations (AIHW, 2008). Disability status recognises the difficulties that a person may have experienced because of a long-term physical or mental health condition and the limitations, impairments or restrictions to their everyday activities. A long-term health condition, or chronic condition, is a health condition or disorder that has lasted, or is expected to last for six months or more. This survey assesses the nature and severity of specific activity limitations or restrictions to 'core activities', such as self-care, mobility and communication, and in schooling or employment, for people who reported they have a chronic condition. Disability status is calculated based on responses to questions from the standard ABS Short Disability Module. Responses are combined to create a scale measure which ranges from 'mild' to 'profound' core-activity limitation and also assesses whether there is a schooling and/or employment restriction. A profound or severe core-activity limitation means that the respondent always or sometimes needed personal assistance or supervision with their daily activities. Of the 481,700 people who had a profound or severe core-activity limitation, 43% had a 12-month mental disorder. People who had a profound or severe core-activity limitation had almost three times the prevalence of 12-month Anxiety disorders (33%) and five times the prevalence (20%) of 12-month Affective disorders compared with people who had no disability or no specific limitations or restrictions (11.6% and 4.2% respectively). 16 . % 50
12 - M O N T H ME N T A L DI S O R D E R S (a ) , by Di s a b i l i t y st a t u s Profound/severe(b) No disability
40 30 20 10 0 Anxiety disorders
Affective disorders
Substance Use disorders
Any 12-month mental disorder
(a) Persons who met criteria for diagnosis of a lifetime mental disorder (with hierarchy) and had symptoms in the 12 months prior to interview. A person may have more than one mental disorder. (b) Core-activity limitation. See Disability status in the Glossary.
20
ABS • NAT I O N A L SUR V E Y OF MEN T A L HEA L T H AND WEL L B E I N G : SUMMA R Y OF RESU L T S • 432 6 . 0 • 200 7
S U M M A R Y O F F I N D I N G S continued
C OMORBIDITY
Comorbidity is the co-occurrence of more than one disease and/or disorder in an individual. Mental disorders may co-occur for a variety of reasons, and Substance Use disorders frequently co-occur (CDHAC, 2001). A person with co-occurring diseases or disorders is likely to experience more severe and chronic medical, social and emotional problems than if they had a single disease or disorder. People with comorbid conditions are also more vulnerable to alcohol and drug relapses, and relapse of mental health problems. Higher numbers of disorders are associated with greater impairment, higher risk of suicidal behaviour and greater use of health services. In this publication, information is presented on both the comorbidity of mental disorder groups and physical conditions (Table 10), and the co-occurrence of more than one mental disorder with physical conditions (Table 11). As people with comorbid disorders generally require higher levels of support than people with only one disorder, Table 13 presents the number of 12-month mental disorders by services used for mental health problems. All comorbidity tables in this publication are presented without the WMH–CIDI 3.0 hierarchy rules applied. Presenting the 12-month mental disorders without hierarchy provides a more complete picture of the combinations of symptoms and disorders experienced by individuals. For more information on hierarchy rules see the Explanatory Notes and Appendix 1.
Total persons aged 16–85 years 16 015 300 (100%)
12-month mental disorders(a) or physical conditions(b)
Physical condition only
No 12-month mental disorder or physical condition
3 197 800 (20%)
6 152 500 (38%)
6 665 000 (42%)
One 12-month mental disorder only
Comorbidity of 12-month mental disorders only
813 000 (5.1%)
508 200 (3.2%) Tw o or more disorders from the same group(c) (1.4%) Tw o or more disorders from different groups(c) (1.8%)
Comorbidity of 12-month mental disorders and physical conditions 1 876 600 (11.7%) One disorder and physical condition (6.4%) Tw o or more disorders and physical condition (5.3%)
(a) Persons who met criteria for diagnosis of a lifetime mental disorder (without hierarchy) and had symptoms in the 12 months prior to interview. (b) A physical condition that a person had or received treatment for in the 12 months prior to interview. See Physical condition in the Glossary. (c) T hese categories are mutually exclusive.
ABS • NAT I O N A L SUR V E Y OF MEN T A L HEA L T H AND WEL L B E I N G : SUMMA R Y OF RESU L T S • 432 6 . 0 • 200 7
21
S U M M A R Y O F F I N D I N G S continued
COMORBIDITY continued
COMO R B I D I T Y OF MEN T A L DISO R D E R S AND PHY S I C A L CON D I T I O N S
Of the 16 million Australians aged 16–85 years, almost three in five (58%) had a 12-month mental disorder or physical condition: 8.2% (1.3 million) had mental disorders only and 11.7% (1.9 million) had both a mental disorder and a physical condition. The most common comorbidity was a combination of 12-month Anxiety disorders and physical conditions (6.0%). COMO R B I D I T Y OF MENT A L DISO R D E R S
There were 1.4 million (8.5%) people who had two or more 12-month mental disorders. Of Australians aged 16–85 years, 3.4% (548,100) had disorders from the same group (eg two Anxiety disorders) and 5.1% (812,300) had disorders from different groups (eg one Anxiety disorder and one Affective disorder). SERVIC ES USED FOR
Information on services used for mental health problems supports the development of
MENTAL HEALTH
policies and programs to assist people with mental disorders. Monitoring mental health
PROBLEMS
and mental illness within populations, both currently and over time, also provides information on the level and type of interventions that may be needed. This survey collected information on services used by respondents for mental health problems in their lifetime and in the 12 months prior to the survey interview. The types of services used varied and included: professional treatment of physical and emotional problems, such as visits to a general practitioner or psychologist; hospital admissions; and self-management strategies, such as using the Internet or going to a self-help group. Tables 12 and 13 provide information on professional consultations for mental health problems, focussing on the 12 months prior to the survey interview. Of Australians aged 16–85 years, 12% (1.9 million) accessed services for mental health problems in the 12 months prior to the survey interview. Of these, three in five (59%) people had a 12-month mental disorder, and one in five either met the criteria for lifetime diagnosis of a mental disorder but did not have symptoms in the 12 months prior to the survey interview (20%) or had no lifetime mental disorder (21%). People who were not diagnosed with a lifetime disorder may have consulted a health professional for a mental disorder that was not included in this survey or for some other type of mental health problem.
22
ABS • NAT I O N A L SUR V E Y OF MEN T A L HEA L T H AND WEL L B E I N G : SUMMA R Y OF RESU L T S • 432 6 . 0 • 200 7
S U M M A R Y O F F I N D I N G S continued
SERVIC ES USED FOR
Of the 3.2 million people with a 12-month mental disorder, more than a third (35%)
MENTAL HEALTH
accessed services for mental health problems. Women with a 12-month mental disorder
PROBLEMS continued
accessed services for mental health problems more than men (41% compared with 28%). Almost one in three (30%) women with a 12-month mental disorder visited a general practitioner, compared with just over one in six (18%) men. Women were also more likely to visit some other type of health professional, such as a complementary or alternative therapist, compared with men (8.0% and 4.7% respectively). 17 . 12 - M O N T H ME N T A L DI S O R D E R S (a ) , by Se r v i c e s us e d fo r me n t a l he a l t h pr o b l e m s ( b ) Males Females
General practitioner Psychiatrist Psychologist Other mental health professional(c) Other health professional(d) Any service used for mental health problems(e) 0
10
20
30
40
50
% (a) Persons who met criteria for diagnosis of a lifetime mental disorder (with hierarchy) and had symptoms in the 12 months prior to interview. A person may have more than one mental disorder. (b) In the 12 months prior to interview. See Services used for mental health problems in the Glossary. (c) Includes mental health nurse and other professionals providing specialist mental health services. (d) Includes medical specialist, other general specialist, complementary and alternative therapist. (e) A person may have used more than one service for mental health. The components when added may therefore not add to the total shown. Also includes hospital admissions.
SER VI C E USE AND COMO R B I D I T Y
People with comorbid disorders had greater use of health services. Table 13 in this publication presents the number of 12-month mental disorders without hierarchy and services used for mental health problems. People with one disorder only were less likely to use services for their mental health than those with two or more disorders (23% and 52% respectively). Of the 1.8 million people with one disorder only, those with a 12-month Affective disorder were much more likely to use health services, than those with an Anxiety or Substance Use disorder. Of the people who had a 12-month Affective disorder only, 45% used services for their mental health, with most of these (80%) seeing a General Medical Practitioner (GP).
ABS • NAT I O N A L SUR V E Y OF MEN T A L HEA L T H AND WEL L B E I N G : SUMMA R Y OF RESU L T S • 432 6 . 0 • 200 7
23
S U M M A R Y O F F I N D I N G S continued
SERVIC ES USED FOR MENTAL HEALTH PROBLEMS continued
S E R V I C E U S E A N D C O M O R B I D I T Y continued
People with two or more mental disorders (1.4 million) had a rate of service use more than twice that of people with one disorder only (52% and 23% respectively). People with two or more disorders from different groups had a higher rate of service use than people with two or more disorders from the same group (57% and 43% respectively). Again, people were more likely to see a GP than other types of health professional: 43% of people with two or more disorders from different groups and 35% of people with two or more disorders from the same group saw a GP. Almost a quarter (24%) of people with two or more disorders from different groups saw a Psychologist for their mental health. 18 . NU M B E R OF 12 - M O N T H ME N T A L DI S O R D E R S WI T H O U T HI E R A R C H Y (a ) , by Ty p e of se r v i c e us e d fo r me n t a l he a l t h pr o b l e m s General Practitioner Psychiatrist Psychologist
One Anxiety disorder only One Affective disorder only One Substance Use disorder only Two or more disorders from the same group(b) Two or more disorders from different groups(b)
0
10
20
30
40
50
% (a) Persons who met criteria for diagnosis of a lifetime mental disorder (without hierarchy) and had symptoms in the 12 months prior to interview. (b) These categories are mutually exclusive.
PERCEIVED NEED FOR
Whether people had a perceived need for help was assessed in relation to: information,
HELP
medication, counselling, social intervention, and skills training. Table 14 presents information on perceived needs for people who used services for mental health problems, and whether or not they had a 12-month mental disorder. Table 15 focuses on people who had a 12-month mental disorder who did not use services for mental health problems.
24
ABS • NAT I O N A L SUR V E Y OF MEN T A L HEA L T H AND WEL L B E I N G : SUMMA R Y OF RESU L T S • 432 6 . 0 • 200 7
S U M M A R Y O F F I N D I N G S continued
PERCEIVED NEED FOR
PERCE I V E D NEED FOR HELP FOR PEOP L E WHO USED SERV I C E S
HELP continued
Of people with a 12-month mental disorder who used services, just over a quarter (26%) did not have their need for counselling met or only had their need partially met. A slightly higher proportion, 29% did not have their need for information met or only had their need partially met. 12 - M O N T H ME N T A L DI S O R D E R S (a ) , by Pe r s o n s wh o us e d se r v i c e s fo r me n t a l he a l t h pr o b l e m s ( b ) — Pe r c e i v e d ne e d no t fu l l y me t ( c ) % 30
20
10
0 Information
Medication
Counselling
Social intervention(d)
Skills training(e)
(a) Persons who met criteria for diagnosis of a lifetime mental disorder (with hierarchy) and had symptoms in the 12 months prior to interview. A person may have more than one mental disorder. (b) In the 12 months prior to interview. See Services used for mental health problems in the Glossary. (c) Need partially met and need not met. (d) Includes help to sort out practical issues, such as money or housing, or help to meet people for support or company. (e) Includes help to improve ability to work, to care for self, or to use time effectively.
PERCE I V E D NEED FOR HELP FOR PEOP L E WHO DID NOT USE SERV I C E S
There were 2.1 million people with a 12-month mental disorder who did not use services for mental health problems but who perceived they had an unmet need. Of these, the highest unmet need was for counselling (10%). 12 - M O N T H ME N T A L DI S O R D E R S (a ) , by Pe r s o n s wh o di d no t us e se r v i c e s fo r me n t a l he a l t h pr o b l e m s ( b ) — Pe r c e i v e d ne e d no t me t % 15
10
5
0 Information
Medication
Counselling
Social intervention(c)
Skills training(d)
(a) Persons who met criteria for diagnosis of a lifetime mental disorder (with hierarchy) and had symptoms in the 12 months prior to interview. A person may have more than one mental disorder. (b) In the 12 months prior to interview. See Services used for mental health problems in the Glossary. (c) Includes help to sort out practical issues, such as money or housing, or help to meet people for support or company. (d) Includes help to improve ability to work, to care for self, or to use time effectively.
ABS • NAT I O N A L SUR V E Y OF MEN T A L HEA L T H AND WEL L B E I N G : SUMMA R Y OF RESU L T S • 432 6 . 0 • 200 7
25
LIST OF TABLE S
page SUMM A R Y TABLE S
27
3
................................ 12–month mental disorders . . . . . . . . . . . . . . . . . . . . . . . . . . . . . . . 12–month mental disorders, by Age group (years) . . . . . . . . . . . . . . . . .
4
12–month mental disorders, by Selected household characteristics
12–month mental disorders, by Selected population characteristics
31
6
12–month mental disorders, by Contact with family or friends
...... ...... .........
30
5
33
7
12–month mental disorders, by Frequency of contact with family or friends . . . . . . . . . . . . . . . . . . . . . . . . . . . . . . . . . . . . . . 12–month mental disorders, by Selected health risk characteristics
...... ......
34
8 9
12–month mental disorders, by Selected physical and mental health characteristics . . . . . . . . . . . . . . . . . . . . . . . . . . . . . . . . .
......
38
Comorbidity of 12–month mental disorders without hierachy and physical conditions . . . . . . . . . . . . . . . . . . . . . . . . . . . . .
.......
41
Comorbidity of 12–month mental disorders without hierachy and physical conditions, by Age group (years) . . . . . . . . . . . . . . .
.......
42
.........
44
1 2
Lifetime mental disorders
28 29
SELE C T E D CHAR A C T E R I S T I C S
10 11
35
SERV I C E S USED FOR MENT A L HEAL T H PROB L E M S
12
Mental disorders, by Services used for mental health problems
13
Number of 12–month mental disorders without hierarchy, by Persons who used services for mental health problems . . . . . . . . . . . . . .
14 15
26
Mental disorders, by Persons who used services for mental health problems – Perceived need for help . . . . . . . . . . . . . . . . . . .
.....
45
.......
46
12–month mental disorders, by Persons who did not use services for mental health problems – Perceived need for help . . . . . . . . . . .
ABS • NAT I O N A L SUR V E Y OF MEN T A L HEA L T H AND WEL L B E I N G : SUMMA R Y OF RESU L T S • 432 6 . 0 • 200 7
.....
49
1
LIF E T I M E ME N T A L DIS O R D E R S (a)
Males
Females
Persons
'000
%
'000
%
'000
%
364.3 328.5 669.8 348.1 180.4 681.8 1 624.2
4.6 4.1 8.4 4.4 2.3 8.6 20.4
467.8 633.7 1 034.8 592.7 260.6 1 277.5 2 580.8
5.8 7.9 12.8 7.3 3.2 15.8 32.0
832.2 962.2 1 704.6 940.8 441.1 1 959.2 4 205.0
5.2 6.0 10.6 5.9 2.8 12.2 26.3
697.0 115.8 238.3 972.1
8.8 1.5 3.0 12.2
1 168.1 195.1 219.9 1 433.3
14.5 2.4 2.7 17.8
1 865.1 310.8 458.2 2 405.3
11.6 1.9 2.9 15.0
2 237.8 413.5 814.5 2 816.7
28.1 5.2 10.2 35.4
788.8 194.7 390.7 1 143.5
9.8 2.4 4.8 14.2
3 026.6 608.2 1 205.2 3 960.3
18.9 3.8 7.5 24.7
Any lifetime mental disorder (a)(b ) No lifetime mental disorder (e)
3 822.0 4 127.8
48.1 51.9
3 464.6 4 600.9
43.0 57.0
7 286.6 8 728.7
45.5 54.5
Total persons aged 16–85 years
7 949.8
100.0
8 065.5
100.0
16 015.3
100.0
Lifetime mental disorders (a) Anxiety disorders Panic Disorder Agoraphobia Social Phobia Generalised Anxiety Disorder Obsessive-Compulsive Disorder Post-Traumatic Stress Disorder Any Anxiety disorder(b) Affective disorders Depressive Episode(c) Dysthymia Bipolar Affective Disorder Any Affective disorder (b) Substance Use disorders Alcohol Harmful Use Alcohol Dependence Drug Use disorders(d) Any Substance Use disorder(b)
(a) (b) (c) (d) (e)
Persons who met criteria for diagnosis of a lifetime mental disorder (with hierarchy). See paragraphs 30–31 of Explanatory Notes. A person may have more than one lifetime mental disorder. The components when added may therefore not add to the total shown. Includes Severe Depressive Episode, Moderate Depressive Episode, and Mild Depressive Episode. Includes Harmful Use and Dependence. Persons who did not meet criteria for diagnosis of a lifetime mental disorder. See paragraphs 30–31 of Explanatory Notes.
ABS • NAT I O N A L SUR V E Y OF MEN T A L HEA L T H AND WEL L B E I N G : SUMMA R Y OF RESU L T S • 432 6 . 0 • 200 7
27
2
12 - MO N T H ME N T A L DIS O R D E R S (a)
Males
Persons
'000
%
'000
%
'000
%
180.5 170.5 298.9 155.2 130.6 366.3 860.7
2.3 2.1 3.8 2.0 1.6 4.6 10.8
229.8 279.9 461.0 280.9 175.0 665.7 1 442.3
2.8 3.5 5.7 3.5 2.2 8.3 17.9
410.3 450.4 759.9 436.1 305.6 1 031.9 2 303.0
2.6 2.8 4.7 2.7 1.9 6.4 14.4
Affective disorders Depressive Episode(c) Dysthymia Bipolar Affective Disorder Any Affective disorder (b)
245.0 79.7 145.3 420.1
3.1 1.0 1.8 5.3
407.4 124.0 140.3 575.8
5.1 1.5 1.7 7.1
652.4 203.8 285.6 995.9
4.1 1.3 1.8 6.2
Substance Use disorders Alcohol Harmful Use Alcohol Dependence Drug Use disorders(d) Any Substance Use disorder(b)
300.8 174.9 165.7 556.4
3.8 2.2 2.1 7.0
169.3 55.3 65.7 263.5
2.1 0.7 0.8 3.3
470.1 230.2 231.4 819.8
2.9 1.4 1.4 5.1
Any 12-month mental disorder(a)(b ) No 12-month mental disorder(e)
1 400.1 6 549.7
17.6 82.4
1 797.7 6 267.8
22.3 77.7
3 197.8 12 817.5
20.0 80.0
Total persons aged 16–85 years
7 949.8
100.0
8 065.5
100.0
16 015.3
100.0
Any 12-month mental disorder(a) Anxiety disorders Panic Disorder Agoraphobia Social Phobia Generalised Anxiety Disorder Obsessive-Compulsive Disorder Post-Traumatic Stress Disorder Any Anxiety disorder(b)
(a) (b) (c) (d) (e)
28
Females
Persons who met criteria for diagnosis of a lifetime mental disorder (with hierarchy) and had symptoms in the 12 months prior to interview. See paragraphs 30–31 of Explanatory Notes. A person may have had more than one 12-month mental disorder. The components when added may therefore not add to the total shown. Includes Severe Depressive Episode, Moderate Depressive Episode, and Mild Depressive Episode. Includes Harmful Use and Dependence. Persons who did not meet criteria for diagnosis of a lifetime mental disorder and those who met criteria for diagnosis of a lifetime mental disorder (with hierarchy) but did not have symptoms in the 12 months prior to interview. See paragraphs 30–31 of Explanatory Notes.
ABS • NAT I O N A L SUR V E Y OF MEN T A L HEA L T H AND WEL L B E I N G : SUMMA R Y OF RESU L T S • 432 6 . 0 • 200 7
3
12 - MO N T H ME N T A L DIS O R D E R S (a) , by Ag e gro u p (y e a r s )
Affective disorders
Anxiety disorders '000
%
'000
Any 12-month mental disorder(a)(b )
Substance Use disorders %
'000
No 12-month mental disorder(c)
Total
%
'000
%
'000
%
'000
MALES 16–24 25–34 35–44 45–54 55–64 65–74 75–85
120.3 162.8 228.9 195.5 103.0 39.1 *11.0
9.3 11.5 14.9 13.9 8.9 5.6 *2.5
56.3 99.0 128.3 88.8 *30.1 np np
4.3 7.0 8.4 6.3 *2.6 np np
201.0 159.9 100.1 *62.0 *18.1 np np
15.5 11.3 6.5 *4.4 *1.6 np np
296.3 321.5 319.0 262.1 126.5 53.8 *20.9
22.8 22.8 20.8 18.6 10.9 7.7 *4.8
1 003.0 1 091.0 1 215.5 1 143.4 1 032.3 645.4 419.1
77.2 77.2 79.2 81.4 89.1 92.3 95.2
1 299.3 1 412.6 1 534.5 1 405.4 1 158.8 699.2 440.0
Total males aged 16–85 years
860.7
10.8
420.1
5.3
556.4
7.0
1 400.1
17.6
6 549.7
82.4
7 949.8
FEMAL ES 16–24 25–34 35–44 45–54 55–64 65–74 75–85 Total females aged 16–85 years
270.9 297.0 326.2 308.7 160.2 51.7 *27.6
21.7 21.2 21.2 21.2 13.8 7.0 *5.2
105.0 121.9 126.9 113.3 68.4 np np
8.4 8.7 8.3 7.8 5.9 np np
122.5 46.5 *39.6 *46.4 **7.4 np np
9.8 3.3 *2.6 *3.2 **0.6 np np
374.8 376.8 397.5 351.6 190.2 70.0 *36.8
30.1 26.9 25.9 24.2 16.3 9.5 *6.9
871.3 1 022.4 1 138.3 1 101.6 974.8 665.1 494.4
69.9 73.1 74.1 75.8 83.7 90.5 93.1
1 246.1 1 399.2 1 535.8 1 453.2 1 165.0 735.1 531.2
1 442.3
17.9
575.8
7.1
263.5
3.3
1 797.7
22.3
6 267.8
77.7
8 065.5
391.3 459.7 555.1 504.2 263.3 90.8 38.6
15.4 16.3 18.1 17.6 11.3 6.3 4.0
161.4 220.9 255.2 202.1 98.4 40.4 *17.5
6.3 7.9 8.3 7.1 4.2 2.8 *1.8
323.5 206.4 139.7 108.4 *25.5 *8.6 *7.7
12.7 7.3 4.6 3.8 *1.1 *0.6 *0.8
671.1 698.4 716.4 613.7 316.7 123.8 57.7
26.4 24.8 23.3 21.5 13.6 8.6 5.9
1 874.3 2 113.4 2 353.8 2 245.0 2 007.1 1 310.5 913.5
73.6 75.2 76.7 78.5 86.4 91.4 94.1
2 545.4 2 811.8 3 070.3 2 858.6 2 323.8 1 434.3 971.2
2 303.0
14.4
995.9
6.2
819.8
5.1
3 197.8
20.0
12 817.5
80.0
16 015.3
PER S O N S 16–24 25–34 35–44 45–54 55–64 65–74 75–85 Total persons aged 16–85 years
* ** np (a) (b) (c)
estimate has a relative standard error of 25% to 50% and should be used with caution estimate has a relative standard error greater than 50% and is considered too unreliable for general use not available for publication but included in totals where applicable, unless otherwise indicated Persons who met criteria for diagnosis of a lifetime mental disorder (with hierarchy) and had symptoms in the 12 months prior to interview. See paragraphs 30–31 of Explanatory Notes. A person may have had more than one mental disorder. The components when added may therefore not add to the total shown. Persons who did not meet criteria for diagnosis of a lifetime mental disorder and those who met criteria for diagnosis of a lifetime mental disorder (with hierarchy) but did not have symptoms in the 12 months prior to interview. See paragraphs 30–31 of Explanatory Notes.
.
ABS • NAT I O N A L SUR V E Y OF MEN T A L HEA L T H AND WEL L B E I N G : SUMMA R Y OF RESU L T S • 432 6 . 0 • 200 7
29
4
12 - MO N T H ME N T A L DIS O R D E R S (a) , by Se l e c t e d ho u s e h o l d ch a r a c t e r i s t i c s
Anxiety disorders
Affective disorders
Any 12-month mental disorder(a)(b )
Substance Use disorders
No 12-month mental disorder(c)
Total
'000
%
'000
%
'000
%
'000
%
'000
%
'000
Household income(d) 1st quintile 5th quintile
464.9 345.0
17.3 12.7
248.7 113.0
9.3 4.1
120.6 135.0
4.5 5.0
633.5 488.1
23.6 17.9
2 051.2 2 236.0
76.4 82.1
2 684.6 2 724.2
Index of disadvantage (e) 1st quintile 5th quintile
419.5 398.2
15.8 10.9
199.1 154.2
7.5 4.2
149.1 147.9
5.6 4.0
570.7 582.6
21.5 15.9
2 081.3 3 082.2
78.5 84.1
2 652.0 3 664.8
751.2
14.0
229.8
4.3
241.3
4.5
1 000.7
18.7
4 354.8
81.3
5 355.4
190.7 484.5 352.8
25.6 11.1 15.2
71.1 190.4 181.1
9.5 4.4 7.8
67.9 119.8 172.5
9.1 2.7 7.4
251.9 631.4 545.6
33.8 14.4 23.5
493.2 3 740.5 1 774.1
66.2 85.6 76.5
745.1 4 371.9 2 319.7
*73.8
*15.9
*53.4
*11.5
**13.1
**2.8
102.6
22.1
360.6
77.9
463.1
336.6 113.4
16.0 17.4
195.6 74.6
9.3 11.4
119.3 85.9
5.7 13.2
479.6 186.2
22.8 28.5
1 628.4 466.0
77.2 71.5
2 107.9 652.2
Area of usual residence State capital city Balance of state/territory
1 519.3 783.8
14.7 13.8
697.2 298.7
6.7 5.3
569.2 250.7
5.5 4.4
2 117.8 1 080.0
20.5 19.1
8 232.9 4 584.6
79.5 80.9
10 350.7 5 664.7
Section of state Major urban Other urban Balance of state (f)
1 553.6 454.8 294.6
14.6 13.3 14.9
686.4 207.6 101.9
6.5 6.1 5.1
586.0 164.8 69.1
5.5 4.8 3.5
2 160.0 658.1 379.7
20.4 19.2 19.2
8 452.9 2 762.7 1 601.8
79.6 80.8 80.8
10 613.0 3 420.8 1 981.6
Total persons aged 16–85 years
2 303.0
14.4
995.9
6.2
819.8
5.1
3 197.8
20.0
12 817.5
80.0
16 015.3
Family composition of household One family households Couple family with children One parent family with children Couple only Other one family households Multiple family households Non-family households Lone person household Group household
* ** (a)
(b)
30
estimate has a relative standard error of 25% to 50% and should be used with caution estimate has a relative standard error greater than 50% and is considered too unreliable for general use Persons who met criteria for diagnosis of a lifetime mental disorder (with hierarchy) and had symptoms in the 12 months prior to interview. See paragraphs 30–31 of Explanatory Notes. A person may have had more than one 12-month mental disorder. The components when added may therefore not add to the total shown.
(c)
(d) (e) (f)
Persons who did not meet criteria for diagnosis of a lifetime mental disorder and those who met criteria for diagnosis of a lifetime mental disorder (with hierarchy) but did not have symptoms in the 12 months prior to interview. See paragraphs 30–31 of Explanatory Notes. See Household income in the Glossary. See Index of disadvantage in the Glossary. Bounded locality and Rural balance. See Section of state in the Glossary.
ABS • NAT I O N A L SUR V E Y OF MEN T A L HEA L T H AND WEL L B E I N G : SUMMA R Y OF RESU L T S • 432 6 . 0 • 200 7
5
12 - MO N T H ME N T A L DIS O R D E R S (a) , by Se l e c t e d po p u l a t i o n ch a r a c t e r i s t i c s
Affective disorders
Anxiety disorders
Substance Use disorders
Any 12-month mental disorder(a)(b )
No 12-month mental disorder(c)
Total
'000
%
'000
%
'000
%
'000
%
'000
%
'000
Level of highest non-school qualification(d) Bachelor degree or above Advanced diploma/Diploma Certificate (e) No non-school qualification(f)
389.0 210.3 554.6 1 149.0
12.2 15.4 13.6 15.6
190.6 122.3 238.9 444.1
6.0 8.9 5.9 6.0
114.6 *61.9 268.1 375.3
3.6 *4.5 6.6 5.1
541.8 298.9 819.3 1 537.8
16.9 21.9 20.2 20.8
2 656.6 1 068.9 3 245.7 5 846.4
83.1 78.1 79.8 79.2
3 198.4 1 367.8 4 064.9 7 384.2
Labour force status Employed Full-time Part-time
1 485.4 930.5 554.9
14.2 13.4 15.7
595.6 379.5 216.1
5.7 5.5 6.1
624.1 418.5 205.6
6.0 6.0 5.8
2 117.1 1 336.4 780.7
20.3 19.3 22.1
8 330.6 5 585.1 2 745.5
79.7 80.7 77.9
10 447.8 6 921.5 3 526.3
72.2 745.4
17.5 14.5
65.7 334.7
15.9 6.5
46.1 149.7
11.1 2.9
121.4 959.3
29.4 18.6
292.1 4 194.7
70.6 81.4
413.6 5 154.0
194.7 308.6 163.2
13.6 14.6 11.1
79.9 113.2 84.7
5.6 5.3 5.8
*65.7 59.6 149.0
*4.6 2.8 10.1
266.7 394.3 309.7
18.7 18.6 21.1
1 161.8 1 725.1 1 160.1
81.3 81.4 78.9
1 428.5 2 119.3 1 469.8
181.6
18.8
58.9
6.1
61.3
6.3
217.5
22.5
748.5
77.5
965.9
255.7 169.3
15.9 16.6
105.7 *31.7
6.6 *3.1
74.9 91.2
4.7 9.0
352.4 211.8
22.0 20.8
1 250.7 806.7
78.0 79.2
1 603.2 1 018.5
*79.4 119.7 1 485.4
*12.8 10.6 14.2
*26.0 *91.9 595.6
*4.2 *8.1 5.7
*35.7 86.7 624.1
*5.7 7.7 6.0
118.7 233.0 2 117.1
19.1 20.6 20.3
503.5 899.5 8 330.6
80.9 79.4 79.7
622.2 1 132.5 10 447.8
1 277.9
14.4
487.5
5.5
562.6
6.3
1 824.2
20.5
7 071.0
79.5
8 895.1
109.6
11.9
42.0
4.6
*28.7
*3.1
148.9
16.2
770.0
83.8
918.9
624.7 177.7
17.4 10.8
338.2 *67.4
9.4 *4.1
156.3 *39.2
4.3 *2.4
831.8 242.5
23.1 14.8
2 766.6 1 400.6
76.9 85.2
3 598.4 1 643.1
Unemployed Not in the labour force Occupation Managers Professionals Technicians and Trades Workers Community and Personal Service Workers Clerical and Administrative Workers Sales Workers Machinery Operators and Drivers Labourers Total employed persons (g) Main source of personal income (h) Employee cash income Unincorporated business cash income Government cash pensions and allowances Other cash income (i)
* (a)
(b) (c)
estimate has a relative standard error of 25% to 50% and should be used with caution Persons who met criteria for diagnosis of a lifetime mental disorder (with hierarchy) andhad symptoms in the 12 months prior to interview. See paragraphs 30–31 of Explanatory Notes. A person may have had more than one 12-month mental disorder. The components when added may therefore not add to the total shown. Persons who did not meet criteria for diagnosis of a lifetime mental disorder and those who met criteria for diagnosis of a lifetime mental disorder (with hierarchy) but did not have symptoms in the 12 months prior to interview. See paragraphs 30–31 of Explanatory Notes.
(d)
(e) (f) (g)
(h) (i)
Non-school qualification refers to educational attainments other than those of pre-primary, primary or secondary education. For more information refer to the 'Australian Standard Classification of Education (ASCED) (cat. no. 1272.0)'. Includes 'Certificate I or II', 'Certificate III or IV', and 'Certificate not further defined'. Includes 'Level not determined'. Includes 'Inadequately described'. Occupation is classified by the Australian and New Zealand Standard Classification of Occupations (ANZSCO). See Occupation in the Gloassry. See Main source of personal income in the Glossary. Includes income from property, superannuation/annuities, transfers from private organisations or other households, and other non-specified sources.
ABS • NAT I O N A L SUR V E Y OF MEN T A L HEA L T H AND WEL L B E I N G : SUMMA R Y OF RESU L T S • 432 6 . 0 • 200 7
31
5
12 - MO N T H ME N T A L DIS O R D E R S (a) , by Se l e c t e d po p u l a t i o n ch a r a c t e r i s t i c s
Affective disorders
Anxiety disorders
Substance Use disorders
Any 12-month mental disorder(a)(b )
cont i n u e d
No 12-month mental disorder(c)
Total
'000
%
'000
%
'000
%
'000
%
'000
%
'000
Country of birth(d) Born in Australia Born overseas Arrived before 1986 Arrived 1986–1995 Arrived 1996–2007
1 798.5 504.5 305.3 86.5 112.7
15.4 11.6 13.4 11.3 8.7
772.7 223.2 124.5 34.0 64.7
6.6 5.1 5.4 4.4 5.0
700.2 119.6 *37.0 *43.3 *39.3
6.0 2.8 *1.6 *5.7 *3.0
2 541.9 655.9 360.6 134.1 161.2
21.8 15.1 15.8 17.5 12.5
9 129.5 3 688.0 1 924.7 630.7 1 132.6
78.2 84.9 84.2 82.5 87.5
11 671.4 4 344.0 2 285.4 764.8 1 293.8
Marital status Married/De facto Separated/Divorced/Widowed Never married
1 111.6 384.3 807.1
12.2 17.8 17.1
361.9 211.0 423.0
4.0 9.8 9.0
227.4 68.6 523.9
2.5 3.2 11.1
1 393.0 487.1 1 317.8
15.2 22.5 27.9
7 743.2 1 673.6 3 400.8
84.8 77.5 72.1
9 136.1 2 160.6 4 718.6
Sexual orientation Heterosexual Homosexual/Bisexual
2 210.5 92.5
14.1 31.5
939.7 56.2
6.0 19.2
793.4 *25.3
5.0 *8.6
3 075.2 121.5
19.6 41.4
12 640.8 171.8
80.4 58.6
15 716.0 293.3
Homelessness Has ever been homeless Has never been homeless
190.7 2 112.3
39.4 13.6
134.0 861.9
27.7 5.5
85.3 734.5
17.6 4.7
259.6 2 938.3
53.6 18.9
224.8 12 592.7
46.4 81.1
484.4 15 530.9
Incarceration Has ever been incarcerated (e) Has never been incarcerated
106.0 2 197.1
27.5 14.1
74.2 921.7
19.3 5.9
87.8 732.1
22.8 4.7
158.4 3 039.5
41.1 19.4
226.7 12 590.8
58.9 80.6
385.1 15 630.2
Service in the Australian defence forces Has ever served (f) Has never served
101.1 2 201.9
12.1 14.5
*49.7 946.3
*5.9 6.2
*25.6 794.3
*3.1 5.2
137.9 3 059.9
16.5 20.2
699.0 12 118.5
83.5 79.8
837.0 15 178.4
Total persons aged 16–85 years
2 303.0
14.4
995.9
6.2
819.8
5.1
3 197.8
20.0
12 817.5
80.0
16 015.3
* (a)
(b)
32
estimate has a relative standard error of 25% to 50% and should be used with caution Persons who met criteria for diagnosis of a lifetime mental disorder (with hierarchy) andhad symptoms in the 12 months prior to interview. See paragraphs 30–31 of Explanatory Notes. A person may have had more than one 12-month mental disorder. The components when added may therefore not add to the total shown.
(c)
(d) (e) (f)
Persons who did not meet criteria for diagnosis of a lifetime mental disorder and those who met criteria for diagnosis of a lifetime mental disorder (with hierarchy) but did not have symptoms in the 12 months prior to interview. See paragraphs 30–31 of Explanatory Notes. Country of birth is classified by the Standard Australian Classification of Countries (SACC). See Country of birth in the Glossary. Time spent in gaol, prison or correctional facility. Includes persons who had overseas qualifying service, serving and ex-serving Australian Defence Force members.
ABS • NAT I O N A L SUR V E Y OF MEN T A L HEA L T H AND WEL L B E I N G : SUMMA R Y OF RESU L T S • 432 6 . 0 • 200 7
6
12 - MO N T H ME N T A L DIS O R D E R S (a) , by Co n t a c t wi t h fam i l y or fri e n d s
Anxiety disorders
Affective disorders
Any 12-month mental disorder(a)(b )
Substance Use disorders
No 12-month mental disorder(c)
Total
'000
%
'000
%
'000
%
'000
%
'000
%
'000
No contact with or no family Contact with family members (d)
*21.5 2 281.5
*17.6 14.4
*17.0 978.9
*14.0 6.2
**4.1 815.8
**3.3 5.1
*27.7 3 170.1
*22.8 19.9
94.1 12 723.5
77.2 80.1
121.8 15 893.6
Number of family members to rely on 0 family members to rely on 1–2 family members to rely on 3 or more family members to rely on
216.4 870.3 1 194.8
25.6 18.2 11.6
145.6 363.9 469.4
17.2 7.6 4.6
*65.1 276.9 473.8
7.7 5.8 4.6
282.7 1 162.9 1 724.6
33.4 24.3 16.8
563.6 3 619.7 8 535.6
66.6 75.7 83.2
846.2 4 782.5 10 260.2
Family members to confide in 0 family members to confide in 1–2 family members to confide in 3 or more family members to confide in
296.0 1 213.1 772.4
26.4 17.2 10.0
186.8 505.2 286.9
16.7 7.2 3.7
91.5 394.4 329.8
8.2 5.6 4.3
372.7 1 642.5 1 154.9
33.2 23.3 15.0
749.0 5 419.3 6 552.7
66.8 76.7 85.0
1 121.7 7 061.8 7 707.6
No contact with or no friends Contact with friends(d)
111.7 2 191.3
31.7 14.0
*71.3 924.6
*20.2 5.9
**24.5 795.4
**6.9 5.1
135.4 3 062.4
38.4 19.6
217.1 12 600.4
61.6 80.4
352.5 15 662.8
Number of friends to rely on 0 friends to rely on 1–2 friends to rely on 3 or more friends to rely on
306.1 882.9 1 002.3
19.0 15.4 12.0
166.3 380.9 377.5
10.3 6.7 4.5
88.0 260.9 446.5
5.5 4.6 5.4
395.0 1 191.8 1 475.6
24.6 20.8 17.7
1 212.1 4 524.6 6 859.7
75.4 79.2 82.3
1 607.1 5 716.4 8 335.3
Number of friends to confide in 0 friends to confide in 1–2 friends to confide in 3 or more friends to confide in
298.1 1 049.7 842.4
16.7 15.1 12.2
168.4 391.4 364.8
9.4 5.6 5.3
87.6 310.1 397.7
4.9 4.5 5.7
396.7 1 402.3 1 262.2
22.2 20.2 18.2
1 389.0 5 542.7 5 658.9
77.8 79.8 81.8
1 785.7 6 945.0 6 921.1
Total persons aged 16–85 years (d)
2 303.0
14.4
995.9
6.2
819.8
5.1
3 197.8
20.0
12 817.5
80.0
16 015.3
* ** (a)
estimate has a relative standard error of 25% to 50% and should be used with caution estimate has a relative standard error greater than 50% and is considered too unreliable for general use Persons who met criteria for diagnosis of a lifetime mental disorder (with hierarchy) and had symptoms in the 12 months prior to interview. See paragraphs 30–31 of Explanatory Notes.
(b) (c)
(d)
A person may have had more than one 12-month mental disorder. The components when added may therefore not add to the total shown. Persons who did not meet criteria for diagnosis of a lifetime mental disorder and those who met criteria for diagnosis of a lifetime mental disorder (with hierarchy) but did not have symptoms in the 12 months prior to interview. See paragraphs 30–31 of Explanatory Notes. Includes 'not stated' how many family/friends a person can rely on/confide in.
ABS • NAT I O N A L SUR V E Y OF MEN T A L HEA L T H AND WEL L B E I N G : SUMMA R Y OF RESU L T S • 432 6 . 0 • 200 7
33
7
12 - MO N T H ME N T A L DIS O R D E R S (a) , by Fr e q u e n c y of co n t a c t wi t h fam i l y or fri e n d s
Anxiety disorders
Frequency of contact with family members Nearly every day At least once a week At least once a month Less than once a month No contact or no family Frequency of contact with friends Nearly every day At least once a week At least once a month Less than once a month No contact or no friends Total persons aged 16–85 years
* ** (a)
34
Affective disorders
Any 12-month mental disorder(a)(b )
Substance Use disorders
No 12-month mental disorder(c)
Total
'000
%
'000
%
'000
%
'000
%
'000
%
'000
1 405.3 622.6 182.9 70.8 *21.5
13.6 14.8 19.6 15.8 *17.6
545.2 283.0 *97.5 *53.2 *17.0
5.3 6.7 *10.5 *11.9 *14.0
536.6 197.3 58.5 *23.5 **4.1
5.2 4.7 6.3 *5.3 **3.3
1 978.0 841.0 236.1 114.9 *27.7
19.2 20.0 25.3 25.7 *22.8
8 334.2 3 361.3 695.5 332.4 94.1
80.8 80.0 74.7 74.3 77.2
10 312.3 4 202.4 931.6 447.3 121.8
920.3 856.3 253.0 161.7 111.7
13.5 12.5 18.1 28.1 31.7
340.9 371.1 139.2 *73.4 *71.3
5.0 5.4 9.9 12.7 *20.2
443.1 269.5 *48.3 *34.5 **24.5
6.5 3.9 *3.4 *6.0 **6.9
1 369.4 1 188.1 316.4 188.4 135.4
20.0 17.3 22.6 32.7 38.4
5 463.4 5 665.7 1 083.6 387.7 217.1
80.0 82.7 77.4 67.3 61.6
6 832.8 6 853.9 1 400.0 576.1 352.5
2 303.0
14.4
995.9
6.2
819.8
5.1
3 197.8
20.0
12 817.5
80.0
16 015.3
estimate has a relative standard error of 25% to 50% and should be used with caution estimate has a relative standard error greater than 50% and is considered too unreliable for general use Persons who met criteria for diagnosis of a lifetime mental disorder (with hierarchy) and had symptoms in the 12 months prior to interview. See paragraphs 30–31 of Explanatory Notes.
(b) (c)
A person may have had more than one 12-month mental disorder. The components when added may therefore not add to the total shown. Persons who did not meet criteria for diagnosis of a lifetime mental disorder and those who met criteria for diagnosis of a lifetime mental disorder (with hierarchy) but did not have symptoms in the 12 months prior to interview. See paragraphs 30–31 of Explanatory Notes.
ABS • NAT I O N A L SUR V E Y OF MEN T A L HEA L T H AND WEL L B E I N G : SUMMA R Y OF RESU L T S • 432 6 . 0 • 200 7
8
12 - MO N T H ME N T A L DIS O R D E R S (a) , by Se l e c t e d he a l t h ri s k ch a r a c t e r i s t i c s ( b )
Anxiety disorders '000
%
Affective disorders '000
Any 12-month mental disorder(a)(c )
Substance Use disorders %
No 12-month mental disorder(d)
Total
'000
%
'000
%
'000
%
'000
MALE S Level of exercise (e) Sedentary (f) Low Moderate/High
203.6 409.5 247.7
13.6 11.0 9.1
81.7 186.2 152.2
5.5 5.0 5.6
89.4 216.2 250.8
6.0 5.8 9.2
290.4 620.6 489.1
19.4 16.6 18.0
1 203.8 3 115.7 2 226.2
80.6 83.4 82.0
1 494.2 3 736.3 2 715.3
Body Mass Index(g) Underweight/Normal (h) Overweight Obese
327.0 333.1 191.1
11.2 9.7 12.7
184.5 135.4 98.0
6.3 4.0 6.5
272.1 221.3 50.2
9.3 6.5 3.3
588.4 509.5 277.7
20.2 14.9 18.5
2 323.5 2 915.3 1 226.6
79.8 85.1 81.5
2 911.9 3 424.8 1 504.3
Smoker status Current smoker (i) Ex-smoker Never smoked
302.0 268.0 290.7
15.2 11.4 8.0
208.5 80.4 131.3
10.5 3.4 3.6
296.1 79.0 181.3
14.9 3.4 5.0
552.9 352.3 494.9
27.8 15.0 13.7
1 438.2 1 993.1 3 118.4
72.2 85.0 86.3
1 991.1 2 345.4 3 613.3
Alcohol consumption(j) Nearly every day 3–4 days per week 1–2 days per week 1–3 days per month Less than once a month (k)
213.6 163.9 193.9 84.1 205.2
11.6 12.7 10.8 9.6 9.5
*123.2 *61.0 70.7 *50.8 114.3
6.7 *4.7 3.9 *5.8 5.3
219.8 101.2 170.4 *35.7 *29.4
12.0 7.9 9.5 *4.1 *1.4
373.1 262.5 350.1 129.5 284.9
20.3 20.4 19.4 14.9 13.2
1 461.7 1 023.0 1 450.1 742.1 1 872.8
79.7 79.6 80.6 85.1 86.8
1 834.8 1 285.5 1 800.2 871.6 2 157.7
Misuse of drugs(l) Nearly every day 3–4 days a week 1–2 days a week 1–3 days a month Less than once a month Have never misused drugs (m)
*43.9 *42.3 *20.8 36.7 50.4 666.6
35.3 *37.6 *20.6 27.1 12.3 9.4
*36.9 **7.9 *17.6 *17.2 *53.2 287.3
*29.7 **7.1 *17.4 *12.7 *13.0 4.1
59.4 *53.7 *38.5 *43.8 109.5 251.5
47.8 47.8 38.2 32.4 26.7 3.6
76.7 *75.2 50.9 65.3 161.5 970.4
61.8 66.9 50.5 48.3 39.3 13.7
47.5 *37.2 50.0 69.9 249.0 6 096.2
38.2 *33.1 49.5 51.7 60.7 86.3
124.2 112.4 100.8 135.3 410.5 7 066.6
Total males aged 16–85 years
860.7
10.8
420.1
5.3
556.4
7.0
1 400.1
17.6
6 549.7
82.4
7 949.8
* ** (a)
(b) (c) (d)
(e) (f)
estimate has a relative standard error of 25% to 50% and should be used with caution estimate has a relative standard error greater than 50% and is considered too unreliable for general use Persons who met criteria for diagnosis of a lifetime mental disorder (with hierarchy) and had symptoms in the 12 months prior to interview. See paragraphs 30–31 of Explanatory Notes. Health risk factors present in the 12 months prior to interview. See Health risk factors in the Glossary. A person may have had more than one 12-month mental disorder. The components when added may therefore not add to the total shown. Persons who did not meet criteria for diagnosis of a lifetime mental disorder and those who met criteria for diagnosis of a lifetime mental disorder (with hierarchy) but did not have symptoms in the 12 months prior to interview. See paragraphs 30–31 of Explanatory Notes. In the week prior to interview. Includes persons whose level of exercise was not stated. See Level of exercise in the Glossary. Includes persons who did no exercise.
(g) (h)
Total includes 'not stated'. There were insufficient respondents assessed as 'underweight' for them to be included as a separate category in this table. (i) Daily and other smoker. (j) Frequency of consumption in the 12 months prior to interview. Only persons who had at least 12 standard drinks in a year were asked about their consumption. (k) Includes persons who did not drink in the 12 months prior to interview and those who have never had a drink. (l) Misuse of drugs in the 12 months prior to interview. Refers to the use of illicit drugs and/or the misuse of prescription drugs. People must have misused the same drug more than 5 times in their lifetime. Only persons who had misused the same drug more than 5 times in their lifetime were asked about their consumption. See Misuse of drugs in the Glossary. (m) Includes persons who did not misuse drugs in the 12 months prior to interview, those who have never misused drugs, or those who have misused the same drug 5 times or less in their lifetime.
ABS • NAT I O N A L SUR V E Y OF MEN T A L HEA L T H AND WEL L B E I N G : SUMMA R Y OF RESU L T S • 432 6 . 0 • 200 7
35
8
12 - MO N T H ME N T A L DIS O R D E R S (a) , by Se l e c t e d he a l t h ri s k ch a r a c t e r i s t i c s ( b )
Anxiety disorders '000
%
Affective disorders '000
Any 12-month mental disorder(a)(c )
Substance Use disorders %
'000
No 12-month mental disorder(d)
cont i n u e d
Total
%
'000
%
'000
%
'000
FEMAL ES Level of exercise (e) Sedentary (f) Low Moderate/High
255.3 852.1 334.9
17.2 17.3 20.2
134.5 292.8 148.5
9.1 5.9 9.0
*35.0 164.2 64.3
*2.4 3.3 3.9
333.7 1 049.5 414.6
22.5 21.3 25.1
1 150.8 3 872.2 1 239.8
77.5 78.7 74.9
1 484.5 4 921.7 1 654.3
Body Mass Index(g) Underweight/Normal (h) Overweight Obese
704.8 351.9 359.5
17.1 17.4 20.9
272.7 156.1 129.1
6.6 7.7 7.5
183.5 49.1 *23.1
4.4 2.4 *1.3
905.7 440.5 406.7
22.0 21.7 23.7
3 218.9 1 587.3 1 311.2
78.0 78.3 76.3
4 124.6 2 027.7 1 717.9
Smoker status Current smoker (i) Ex-smoker Never smoked
468.2 357.3 616.9
29.7 18.2 13.6
223.3 119.3 233.2
14.2 6.1 5.1
143.6 *47.6 72.2
9.1 *2.4 1.6
603.7 420.4 773.6
38.3 21.4 17.1
971.9 1 541.4 3 754.5
61.7 78.6 82.9
1 575.7 1 961.7 4 528.1
Alcohol consumption(j) Nearly every day 3–4 days per week 1–2 days per week 1–3 days per month Less than once a month (k)
165.8 123.1 270.3 213.8 669.3
17.6 14.9 19.0 20.4 17.5
82.1 38.6 97.7 73.4 283.8
8.7 4.7 6.9 7.0 7.4
73.3 *50.9 81.8 *24.6 *32.8
7.8 *6.2 5.8 *2.3 *0.9
222.9 176.9 360.6 259.2 778.2
23.6 21.4 25.4 24.7 20.3
721.2 648.0 1 059.6 789.0 3 050.0
76.4 78.6 74.6 75.3 79.7
944.1 824.9 1 420.2 1 048.2 3 828.2
Misuse of drugs(l) Nearly every day 3–4 days a week 1–2 days a week 1–3 days a month Less than once a month Has never misused drugs (m)
*25.8 *10.0 *22.2 36.4 87.6 1 260.4
43.2 *36.1 *43.2 50.1 33.3 16.6
*20.1 *6.0 **20.4 *18.0 *34.3 477.1
*33.6 *21.6 *39.7 *24.7 13.0 6.3
*31.5 *16.2 *18.0 *21.3 *37.0 139.3
52.8 58.5 *35.1 *29.4 14.1 1.8
39.1 *19.9 *30.2 51.3 121.0 1 536.2
65.4 71.8 58.8 70.7 45.9 20.2
*20.7 *7.8 *21.2 *21.3 142.4 6 054.5
*34.6 *28.2 *41.2 29.3 54.1 79.8
59.7 *27.8 51.4 72.6 263.4 7 590.7
Total females aged 16–85 years
1 442.3
17.9
575.8
7.1
263.5
3.3
1 797.7
22.3
6 267.8
77.7
8 065.5
* ** (a)
(b) (c) (d)
(e) (f)
36
estimate has a relative standard error of 25% to 50% and should be used with caution estimate has a relative standard error greater than 50% and is considered too unreliable for general use Persons who met criteria for diagnosis of a lifetime mental disorder (with hierarchy) and had symptoms in the 12 months prior to interview. See paragraphs 30–31 of Explanatory Notes. Health risk factors present in the 12 months prior to interview. See Health risk factors in the Glossary. A person may have had more than one 12-month mental disorder. The components when added may therefore not add to the total shown. Persons who did not meet criteria for diagnosis of a lifetime mental disorder and those who met criteria for diagnosis of a lifetime mental disorder (with hierarchy) but did not have symptoms in the 12 months prior to interview. See paragraphs 30–31 of Explanatory Notes. In the week prior to interview. Includes persons whose level of exercise was not stated. See Level of exercise in the Glossary. Includes persons who did no exercise.
(g) (h)
Total includes 'not stated'. There were insufficient respondents assessed as 'underweight' for them to be included as a separate category in this table. (i) Daily and other smoker. (j) Frequency of consumption in the 12 months prior to interview. Only persons who had at least 12 standard drinks in a year were asked about their consumption. (k) Includes persons who did not drink in the 12 months prior to interview and those who have never had a drink. (l) Misuse of drugs in the 12 months prior to interview. Refers to the use of illicit drugs and/or the misuse of prescription drugs. People must have misused the same drug more than 5 times in their lifetime. Only persons who had misused the same drug more than 5 times in their lifetime were asked about their consumption. See Misuse of drugs in the Glossary. (m) Includes persons who did not misuse drugs in the 12 months prior to interview, those who have never misused drugs, or those who have misused the same drug 5 times or less in their lifetime.
ABS • NAT I O N A L SUR V E Y OF MEN T A L HEA L T H AND WEL L B E I N G : SUMMA R Y OF RESU L T S • 432 6 . 0 • 200 7
8
12 - MO N T H ME N T A L DIS O R D E R S (a) , by Se l e c t e d he a l t h ri s k ch a r a c t e r i s t i c s ( b )
Anxiety disorders '000
%
Affective disorders '000
Any 12-month mental disorder(a)(c )
Substance Use disorders %
'000
No 12-month mental disorder(d)
cont i n u e d
Total
%
'000
%
'000
%
'000
PER S O N S Level of exercise (e) Sedentary (f) Low Moderate/High
458.9 1 261.6 582.6
15.4 14.6 13.3
216.3 479.0 300.7
7.3 5.5 6.9
124.3 380.4 315.1
4.2 4.4 7.2
624.1 1 670.1 903.7
21.0 19.3 20.7
2 354.5 6 987.9 3 466.0
79.0 80.7 79.3
2 978.7 8 658.0 4 369.6
Body Mass Index(g) Underweight/Normal (h) Overweight Obese
1 031.8 685.0 550.6
14.7 12.6 17.1
457.3 291.5 227.1
6.5 5.3 7.0
455.6 270.5 73.3
6.5 5.0 2.3
1 494.1 950.0 684.4
21.2 17.4 21.2
5 542.4 4 502.6 2 537.8
78.8 82.6 78.8
7 036.5 5 452.6 3 222.2
Smoker status Current smoker (i) Ex-smoker Never smoked
770.1 625.3 907.6
21.6 14.5 11.1
431.8 199.6 364.5
12.1 4.6 4.5
439.7 126.6 253.5
12.3 2.9 3.1
1 156.6 772.7 1 268.5
32.4 17.9 15.6
2 410.1 3 534.5 6 872.9
67.6 82.1 84.4
3 566.8 4 307.2 8 141.4
Alcohol consumption(j) Nearly every day 3–4 days per week 1–2 days per week 1–3 days per month Less than once a month (k)
379.5 287.0 464.2 297.9 874.5
13.7 13.6 14.4 15.5 14.6
205.4 99.7 168.5 124.3 398.1
7.4 4.7 5.2 6.5 6.7
293.1 152.1 252.2 60.3 62.1
10.5 7.2 7.8 3.1 1.0
596.0 439.4 710.7 388.7 1 063.1
21.4 20.8 22.1 20.2 17.8
2 182.9 1 670.9 2 509.8 1 531.2 4 922.8
78.6 79.2 77.9 79.8 82.2
2 778.8 2 110.4 3 220.4 1 919.8 5 985.9
Misuse of drugs(l) Nearly every day 3–4 days a week 1–2 days a week 1–3 days a month Less than once a month Has never misused drugs (m)
69.7 *52.3 *43.0 73.1 138.0 1 927.0
37.9 *37.3 28.2 35.1 20.5 13.1
56.9 *14.0 *38.0 35.2 87.5 764.4
30.9 *10.0 *24.9 16.9 13.0 5.2
90.9 69.9 56.5 65.1 146.5 390.8
49.4 49.9 37.1 31.3 21.7 2.7
115.8 95.1 81.1 116.7 282.5 2 506.7
63.0 67.9 53.3 56.1 41.9 17.1
68.1 *45.0 71.1 91.2 391.4 12 150.6
37.0 *32.1 46.7 43.9 58.1 82.9
183.9 140.2 152.2 207.8 673.9 14 657.3
Total persons aged 16–85 years
2 303.0
14.4
995.9
6.2
819.8
5.1
3 197.8
20.0
12 817.5
80.0
16 015.3
* (a)
(b) (c) (d)
(e) (f) (g)
estimate has a relative standard error of 25% to 50% and should be used with caution Persons who met criteria for diagnosis of a lifetime mental disorder (with hierarchy) and had symptoms in the 12 months prior to interview. See paragraphs 30–31 of Explanatory Notes. Health risk factors present in the 12 months prior to interview. See Health risk factors in the Glossary. A person may have had more than one 12-month mental disorder. The components when added may therefore not add to the total shown. Persons who did not meet criteria for diagnosis of a lifetime mental disorder and those who met criteria for diagnosis of a lifetime mental disorder (with hierarchy) but did not have symptoms in the 12 months prior to interview. See paragraphs 30–31 of Explanatory Notes. In the week prior to interview. Includes persons whose level of exercise was not stated. See Level of exercise in the Glossary. Includes persons who did no exercise. Total includes 'not stated'.
(h)
There were insufficient respondents assessed as 'underweight' for them to be included as a separate category in this table. (i) Daily and other smoker. (j) Frequency of consumption in the 12 months prior to interview. Only persons who had at least 12 standard drinks in a year were asked about their consumption. (k) Includes persons who did not drink in the 12 months prior to interview and those who have never had a drink. (l) Misuse of drugs in the 12 months prior to interview. Refers to the use of illicit drugs and/or the misuse of prescription drugs. People must have misused the same drug more than 5 times in their lifetime. Only persons who had misused the same drug more than 5 times in their lifetime were asked about their consumption. See Misuse of drugs in the Glossary. (m) Includes persons who did not misuse drugs in the 12 months prior to interview, those who have never misused drugs, or those who have misused the same drug 5 times or less in their lifetime.
ABS • NAT I O N A L SUR V E Y OF MEN T A L HEA L T H AND WEL L B E I N G : SUMMA R Y OF RESU L T S • 432 6 . 0 • 200 7
37
9
12 - MO N T H ME N T A L DIS O R D E R S (a) , by Se l e c t e d ph y s i c a l an d men t a l he a l t h ch a r a c t e r i s t i c s
Anxiety disorders '000
%
Affective disorders '000
Any 12-month mental disorder(a)(b )
Substance Use disorders %
'000
No 12-month mental disorder(c)
Total
%
'000
%
'000
%
'000
MALES Physical condition(d) With physical condition Without physical condition
456.1 404.6
12.7 9.3
247.1 173.0
6.9 4.0
254.0 302.3
7.1 6.9
704.7 695.4
19.7 15.9
2 874.6 3 675.1
80.3 84.1
3 579.3 4 370.6
Level of psychological distress(e) Low Moderate High Very high
317.6 268.3 182.7 92.1
5.3 19.0 43.9 58.2
86.2 122.2 118.8 93.0
1.4 8.6 28.6 58.8
283.4 145.6 93.2 *34.2
4.8 10.3 22.4 *21.6
611.6 427.1 243.6 117.8
10.3 30.2 58.6 74.5
5 349.4 987.0 172.1 *40.3
89.7 69.8 41.4 25.5
5 961.1 1 414.1 415.7 158.1
Suicidal behaviour(f) Ideation (g) Plans Attempts No suicidal behaviours(h)
*70.9 *17.4 *13.8 788.8
48.3 51.8 *61.1 10.1
*63.0 *18.9 *13.0 352.2
42.9 56.3 *57.6 4.5
*51.1 *14.6 **12.0 504.8
34.8 *43.5 *53.1 6.5
97.2 *24.5 np 1 297.4
66.3 73.0 np 16.6
49.5 *9.0 np 6 500.2
33.7 *27.0 np 83.4
146.7 33.5 *22.6 7 797.6
*52.6 101.6
*27.3 20.8
*39.8 *33.3
*20.7 *6.8
*21.9 *32.6
*11.4 *6.7
*71.4 134.4
37.1 27.5
121.0 354.3
62.9 72.5
192.5 488.7
138.7
31.1
89.9
20.2
*45.6
*10.2
187.4
42.1
258.1
57.9
445.5
Disability status(i) Profound/Severe Moderate/Mild Schooling/Employment restriction only No disability/No specific limitations or restrictions
567.8
8.3
257.2
3.8
456.3
6.7
1 006.9
14.8
5 816.3
85.2
6 823.1
Days out of role (j) 0 days 1 to 7 days More than 7 days
439.9 239.7 179.7
7.5 15.9 30.2
195.1 108.4 116.6
3.3 7.2 19.6
362.4 106.6 87.4
6.2 7.1 14.7
829.7 340.7 228.3
14.2 22.6 38.4
5 006.0 1 167.9 365.8
85.8 77.4 61.6
5 835.7 1 508.6 594.1
Total males aged 16–85 years
860.7
10.8
420.1
5.3
556.4
7.0
1 400.1
17.6
6 549.7
82.4
7 949.8
* ** np (a)
(b) (c)
38
estimate has a relative standard error of 25% to 50% and should be used with caution estimate has a relative standard error greater than 50% and is considered too unreliable for general use not available for publication but included in totals where applicable, unless otherwise indicated Persons who met criteria for diagnosis of a lifetime mental disorder (with hierarchy) and had symptoms in the 12 months prior to interview. See paragraphs 30–31 of Explanatory Notes. A persons may have had more than one 12-month mental disorder. The components when added may therefore not add to the total shown. Persons who did not meet criteria for diagnosis of a lifetime mental disorder and those who met criteria for a diagnosis of a lifetime mental disorder (with hierarchy) but did not have symptoms in the 12 months prior to interview. See paragraphs 30–31 of Explanatory Notes.
(d) (e)
(f)
(g) (h) (i) (j)
A physical condition that a person had or received treatment for in the 12 months prior to interview. See Physical condition in the Glossary. As measured by the Kessler Psychological Distress Scale (K10), from which a score of 10 to 50 is produced. Total includes 'not stated'. See Psychological distress in the Glossary. Suicidal behaviour in the 12 months prior to interview. A person may have suicidal ideations, plans or attempts, therefore the components when added may not add to the total shown. Refers to the presence of serious thoughts about committing suicide. Includes 'not stated'. See Disability status in the Glossary. Persons who were unable to carry out or had to cut down on their usual activities in the 30 days prior to interview. Total includes 'not stated'. See Days out of role in the Glossary.
ABS • NAT I O N A L SUR V E Y OF MEN T A L HEA L T H AND WEL L B E I N G : SUMMA R Y OF RESU L T S • 432 6 . 0 • 200 7
9
12 - MO N T H ME N T A L DIS O R D E R S (a) , by Se l e c t e d ph y s i c a l an d men t a l he a l t h ch a r a c t e r i s t i c s
cont i n u e d
Affective disorders
Anxiety disorders '000
%
'000
Any 12-month mental disorder(a)(b )
Substance Use disorders %
'000
No 12-month mental disorder(c)
Total
%
'000
%
'000
%
'000
FEMAL ES Physical condition(d) With physical condition Without physical condition
966.2 476.1
21.7 13.2
394.8 181.0
8.9 5.0
149.6 113.9
3.4 3.1
1 171.9 625.8
26.3 17.3
3 277.9 2 989.9
73.7 82.7
4 449.8 3 615.7
Level of psychological distress(e) Low Moderate High Very high
495.4 456.0 308.2 182.8
9.1 26.6 45.2 72.8
105.8 163.1 179.2 127.7
2.0 9.5 26.3 50.8
114.9 73.0 50.2 *25.4
2.1 4.3 7.4 *10.1
633.3 573.4 383.3 207.8
11.7 33.5 56.2 82.7
4 786.8 1 138.4 298.5 *43.4
88.3 66.5 43.8 *17.3
5 420.1 1 711.8 681.8 251.1
133.1 *37.2 *33.7 1 304.2
60.1 64.8 78.9 16.6
104.0 *41.2 *29.8 470.7
47.0 71.7 69.9 6.0
37.8 *14.2 *13.2 225.6
17.1 *24.8 *31.0 2.9
166.6 46.0 np 1 626.1
75.3 80.1 np 20.7
54.7 *11.4 np 6 210.4
24.7 *19.9 np 79.3
221.3 57.5 42.7 7 836.5
107.3 164.0
37.1 28.0
56.8 96.1
19.6 16.4
**11.1 *14.9
**3.8 *2.5
135.4 211.2
46.8 36.0
153.8 375.0
53.2 64.0
289.3 586.2
160.9
36.0
107.5
24.0
*41.2
*9.2
200.1
44.7
247.2
55.3
447.4
1 010.2
15.0
315.3
4.7
196.3
2.9
1 251.0
18.6
5 491.7
81.4
6 742.7
645.1 519.2 278.0
12.0 26.5 37.7
215.5 182.8 177.4
4.0 9.3 24.0
125.2 102.3 *36.0
2.3 5.2 *4.9
819.1 647.7 330.9
15.3 33.1 44.8
4 548.7 1 308.8 407.4
84.7 66.9 55.2
5 367.8 1 956.5 738.2
1 442.3
17.9
575.8
7.1
263.5
3.3
1 797.7
22.3
6 267.8
77.7
8 065.5
Suicidal behaviour(f) Ideation (g) Plans Attempts No suicidal behaviours(h) Disability status(i) Profound/Severe Moderate/Mild Schooling/Employment restriction only No disability/No specific limitations or restrictions Days out of role (j) 0 days 1 to 7 days More than 7 days Total females aged 16–85 years
* ** np (a)
(b) (c)
estimate has a relative standard error of 25% to 50% and should be used with caution estimate has a relative standard error greater than 50% and is considered too unreliable for general use not available for publication but included in totals where applicable, unless otherwise indicated Persons who met criteria for diagnosis of a lifetime mental disorder (with hierarchy) and had symptoms in the 12 months prior to interview. See paragraphs 30–31 of Explanatory Notes. A persons may have had more than one 12-month mental disorder. The components when added may therefore not add to the total shown. Persons who did not meet criteria for diagnosis of a lifetime mental disorder and those who met criteria for a diagnosis of a lifetime mental disorder (with hierarchy) but did not have symptoms in the 12 months prior to interview. See paragraphs 30–31 of Explanatory Notes.
(d) (e)
(f)
(g) (h) (i) (j)
A physical condition that a person had or received treatment for in the 12 months prior to interview. See Physical condition in the Glossary. As measured by the Kessler Psychological Distress Scale (K10), from which a score of 10 to 50 is produced. Total includes 'not stated'. See Psychological distress in the Glossary. Suicidal behaviour in the 12 months prior to interview. A person may have suicidal ideations, plans or attempts, therefore the components when added may not add to the total shown. Refers to the presence of serious thoughts about committing suicide. Includes 'not stated'. See Disability status in the Glossary. Persons who were unable to carry out or had to cut down on their usual activities in the 30 days prior to interview. Total includes 'not stated'. See Days out of role in the Glossary.
ABS • NAT I O N A L SUR V E Y OF MEN T A L HEA L T H AND WEL L B E I N G : SUMMA R Y OF RESU L T S • 432 6 . 0 • 200 7
39
9
12 - MO N T H ME N T A L DIS O R D E R S (a) , by Se l e c t e d ph y s i c a l an d men t a l he a l t h ch a r a c t e r i s t i c s
cont i n u e d
Affective disorders
Anxiety disorders '000
%
'000
Any 12-month mental disorder(a)(b )
Substance Use disorders %
'000
No 12-month mental disorder(c)
Total
%
'000
%
'000
%
'000
PER S O N S Physical condition(d) With physical condition Without physical condition Level of psychological distress(e) Low Moderate High Very high Suicidal behaviour(f) Ideation (g) Plans Attempts No suicidal behaviours(h)
1 422.4 880.7
17.7 11.0
641.9 354.0
8.0 4.4
403.6 416.2
5.0 5.2
1 876.6 1 321.2
23.4 16.5
6 152.5 6 665.0
76.6 83.5
8 029.1 7 986.2
813.0 724.3 490.8 274.9
7.1 23.2 44.7 67.2
192.0 285.2 298.0 220.7
1.7 9.1 27.2 53.9
398.3 218.6 143.3 *59.6
3.5 7.0 13.1 *14.6
1 245.0 1 000.4 626.8 325.6
10.9 32.0 57.1 79.6
10 136.2 2 125.5 470.6 83.7
89.1 68.0 42.9 20.4
11 381.2 3 125.9 1 097.5 409.3
204.0 54.6 47.5 2 093.0
55.4 60.0 72.7 13.4
167.0 60.1 *42.9 822.9
45.4 66.0 65.7 5.3
88.9 *28.8 *25.2 730.4
24.2 31.7 *38.6 4.7
263.8 70.5 61.5 2 923.5
71.7 77.5 94.2 18.7
104.2 *20.5 **3.8 12 710.6
28.3 *22.5 **5.8 81.3
368.1 91.0 65.3 15 634.1
159.9 265.6
33.2 24.7
96.5 129.4
20.0 12.0
*33.0 *47.5
*6.8 *4.4
206.9 345.6
42.9 32.1
274.9 729.3
57.1 67.9
481.7 1 074.9
Disability status(i) Profound/Severe Moderate/Mild Schooling/Employment restriction only No disability/No specific limitations or restrictions
299.6
33.6
197.4
22.1
86.8
9.7
387.5
43.4
505.3
56.6
892.9
1 578.0
11.6
572.5
4.2
652.6
4.8
2 257.9
16.6
11 307.9
83.4
13 565.8
Days out of role (j) 0 days 1 to 7 days More than 7 days
1 085.1 758.9 457.7
9.7 21.9 34.4
410.7 291.2 294.0
3.7 8.4 22.1
487.6 208.9 123.4
4.4 6.0 9.3
1 648.9 988.5 559.1
14.7 28.5 42.0
9 554.7 2 476.7 773.2
85.3 71.5 58.0
11 203.6 3 465.2 1 332.3
Total persons aged 16–85 years
2 303.0
14.4
995.9
6.2
819.8
5.1
3 197.8
20.0
12 817.5
80.0
16 015.3
* ** (a)
(b) (c)
40
estimate has a relative standard error of 25% to 50% and should be used with caution estimate has a relative standard error greater than 50% and is considered too unreliable for general use Persons who met criteria for diagnosis of a lifetime mental disorder (with hierarchy) and had symptoms in the 12 months prior to interview. See paragraphs 30–31 of Explanatory Notes. A persons may have had more than one 12-month mental disorder. The components when added may therefore not add to the total shown. Persons who did not meet criteria for diagnosis of a lifetime mental disorder and those who met criteria for a diagnosis of a lifetime mental disorder (with hierarchy) but did not have symptoms in the 12 months prior to interview. See paragraphs 30–31 of Explanatory Notes.
(d) (e)
(f)
(g) (h) (i) (j)
A physical condition that a person had or received treatment for in the 12 months prior to interview. See Physical condition in the Glossary. As measured by the Kessler Psychological Distress Scale (K10), from which a score of 10 to 50 is produced. Total includes 'not stated'. See Psychological distress in the Glossary. Suicidal behaviour in the 12 months prior to interview. A person may have suicidal ideations, plans or attempts, therefore the components when added may not add to the total shown. Refers to the presence of serious thoughts about committing suicide. Includes 'not stated'. See Disability status in the Glossary. Persons who were unable to carry out or had to cut down on their usual activities in the 30 days prior to interview. Total includes 'not stated'. See Days out of role in the Glossary.
ABS • NAT I O N A L SUR V E Y OF MEN T A L HEA L T H AND WEL L B E I N G : SUMMA R Y OF RESU L T S • 432 6 . 0 • 200 7
10
CO M O R B I D I T Y OF 12 - MO N T H ME N T A L DIS O R D E R S WIT H O U T HIE R A R C H Y (a) , AN D PH Y S I C A L CO N D I T I O N S ( b )
Males
Females
Persons
'000
%
'000
%
'000
%
252.0 *62.4 219.8 *78.7 50.7 **8.7 *23.2 695.4
3.2 *0.8 2.8 *1.0 0.6 **0.1 *0.3 8.7
345.5 68.4 81.3 98.1 *16.7 — *15.8 625.8
4.3 0.8 1.0 1.2 *0.2 — *0.2 7.8
597.4 130.8 301.1 176.8 67.4 **8.7 *39.0 1 321.2
3.7 0.8 1.9 1.1 0.4 **0.1 *0.2 8.2
2 874.6
36.2
3 277.9
40.6
6 152.5
38.4
284.1 87.5 122.2 79.0 *49.6 *38.8 *43.4 704.7
3.6 1.1 1.5 1.0 *0.6 *0.5 *0.5 8.9
673.3 131.7 57.3 217.3 *46.4 *16.6 *29.2 1 171.9
8.3 1.6 0.7 2.7 *0.6 *0.2 *0.4 14.5
957.5 219.2 179.6 296.3 96.0 *55.5 72.6 1 876.6
6.0 1.4 1.1 1.9 0.6 *0.3 0.5 11.7
No mental disorder or physical condition
3 675.1
46.2
2 989.9
37.1
6 665.0
41.6
Total persons aged 16–85 years
7 949.8
100.0
8 065.5
100.0
16 015.3
100.0
Mental disorders only Anxiety only Affective only Substance Use only Anxiety and Affective only Anxiety and Substance Use only Affective and Substance Use only Anxiety, Affective and Substance Use only Total mental disorders only Physical only Mental disorders and physical conditions Anxiety and Physical only Affective and Physical only Substance Use and Physical only Anxiety, Affective and Physical only Anxiety, Substance Use and Physical only Affective, Substance Use and Physical only Anxiety, Affective, Substance Use and Physical Total mental disorders and physical conditions
* ** —
estimate has a relative standard error of 25% to 50% and should be used with caution estimate has a relative standard error greater than 50% and is considered too unreliable for general use nil or rounded to zero (including null cells)
(a)
(b)
Persons who met criteria for diagnosis of a lifetime mental disorder (without hierarchy) and had symptoms in the 12 months prior to interview. See paragraphs 30–31 of Explanatory Notes. A physical condition that a person had or received treatment for in the 12 months prior to interview. See Physical condition in the Glossary.
ABS • NAT I O N A L SUR V E Y OF MEN T A L HEA L T H AND WEL L B E I N G : SUMMA R Y OF RESU L T S • 432 6 . 0 • 200 7
41
11
CO M O R B I D I T Y OF 12 - MO N T H ME N T A L DIS O R D E R S WIT H O U T HIE R A R C H Y (a) , AN D PH Y S I C A L CO N D I T I O N S ( b ) — by Ag e gro u p (ye a r s )
16–24
Mental disorders only One disorder Two or more disorders Two or more disorders from the same group (c) Two or more disorders from different groups(c) Total mental disorders only
25–34
35–44
45–54
55–64
'000
%
'000
%
'000
%
'000
%
'000
%
267.4 161.9 72.6 89.4
10.5 6.4 2.9 3.5
223.0 122.6 *66.9 55.7
7.9 4.4 *2.4 2.0
155.6 118.9 *38.1 80.8
5.1 3.9 *1.2 2.6
118.5 *79.4 **29.0 *50.5
4.1 *2.8 **1.0 *1.8
35.2 *17.0 np np
1.5 *0.7 np np
429.3
16.9
345.6
12.3
274.6
8.9
198.0
6.9
52.1
2.2
Physical conditions only
398.9
15.7
686.0
24.4
889.5
29.0
1 153.8
40.4
1 328.3
57.2
Mental disorders and physical conditions One disorder and physical conditions Two or more disorders and physical conditions Total mental disorders and physical conditions
126.7 115.1 241.8
5.0 4.5 9.5
162.2 190.5 352.8
5.8 6.8 12.5
260.1 181.8 441.9
8.5 5.9 14.4
231.3 184.4 415.7
8.1 6.5 14.5
125.2 139.3 264.6
5.4 6.0 11.4
1 427.5
50.8
1 464.3
47.7
1 091.1
38.2
678.8
29.2
3 070.3 100.0
2 858.6
100.0
No 12-month mental disorder or physical condition(d)
1 475.4
58.0
Total persons aged 16–85 years
2 545.4
100.0
* ** np (a)
42
estimate has a relative standard error of 25% to 50% and should be used with caution estimate has a relative standard error greater than 50% and is considered too unreliable for general use not available for publication but included in totals where applicable, unless otherwise indicated Persons who met criteria for diagnosis of a lifetime mental disorder (without hierarchy) and had symptoms in the 12 months prior to interview. See paragraphs 30–31 of Explanatory Notes.
2 811.8 100.0
(b) (c) (d)
2 323.8 100.0
A physical condition that a person had or received treatment for in the 12 months prior to interview. See Physical condition in the Glossary. These categories are mutually exclusive. Persons who did not meet criteria for diagnosis of a lifetime mental disorder and those who met criteria for diagnosis of a lifetime mental disorder (without hierarchy) but did not have symptoms in the 12 months prior to interview. See paragraphs 30–31 of Explanatory Notes.
ABS • NAT I O N A L SUR V E Y OF MEN T A L HEA L T H AND WEL L B E I N G : SUMMA R Y OF RESU L T S • 432 6 . 0 • 200 7
11
CO M O R B I D I T Y OF 12 - MO N T H ME N T A L DIS O R D E R S WIT H O U T HIE R A R C H Y (a) , AN D PH Y S I C A L CO N D I T I O N S ( b ) — by Ag e gro u p (ye a r s )
65–85
Mental disorders only One disorder Two or more disorders Two or more disorders from the same group (c) Two or more disorders from different groups(c) Total mental disorders only Physical conditions only Mental disorders and physical conditions One disorder and physical conditions Two or more disorders and physical conditions Total mental disorders and physical conditions No 12-month mental disorder or physical condition(d) Total persons aged 16–85 years
* np (a)
(b) (c) (d)
cont i n u e d
Total
'000
%
'000
*13.3 *8.3 np np
*0.6 *0.3 np np
813.0 508.2 216.3 292.0
*21.6
*0.9
1 321.2
1 696.0
70.5
6 152.5
118.9 41.0 159.9
4.9 1.7 6.6
1 024.4 852.2 1 876.6
528.0
21.9
6 665.0
2 405.5
100.0
16 015.3
estimate has a relative standard error of 25% to 50% and should be used with caution not available for publication but included in totals where applicable, unless otherwise indicated Persons who met criteria for diagnosis of a lifetime mental disorder (without hierarchy) and had symptoms in the 12 months prior to interview. See paragraphs 30–31 of Explanatory Notes. A physical condition that a person had or received treatment for in the 12 months prior to interview. See Physical condition in the Glossary. These categories are mutually exclusive. Persons who did not meet criteria for diagnosis of a lifetime mental disorder and those who met criteria for diagnosis of a lifetime mental disorder (without hierarchy) but did not have symptoms in the 12 months prior to interview. See paragraphs 30–31 of Explanatory Notes.
ABS • NAT I O N A L SUR V E Y OF MEN T A L HEA L T H AND WEL L B E I N G : SUMMA R Y OF RESU L T S • 432 6 . 0 • 200 7
43
12
ME N T A L DIS O R D E R S , by Ser v i c e s us e d fo r men t a l hea l t h pr o b l e m s ( a )
Lifetime mental disorder with 12-month symptoms(b) '000
Lifetime mental disorder with no 12-month symptoms(c) %
No lifetime mental disorder(d)
Total
'000
%
'000
%
'000
%
MALE S Services used for mental health problems (a) General Practitioner Psychiatrist Psychologist Other mental health professional (e) Other health professional(f)
252.3 *104.4 182.9 96.5 *66.5
18.0 7.5 13.1 6.9 *4.7
114.5 *26.8 43.4 **13.3 *34.5
4.7 *1.1 1.8 **0.5 *1.4
*98.6 *24.3 *24.6 **16.2 *21.4
*2.4 *0.6 *0.6 **0.4 *0.5
465.3 155.5 250.8 126.0 122.4
5.9 2.0 3.2 1.6 1.5
Services used for mental health problems (g) No services used for mental health problems (h)
385.4 1 014.8
27.5 72.5
170.5 2 251.4
7.0 93.0
144.1 3 983.7
3.5 96.5
699.9 7 249.9
8.8 91.2
Total males aged 16–85 years
1 400.1
100.0
2 421.9
100.0
4 127.8
100.0
7 949.8
100.0
FEMAL ES Services used for mental health problems (a) General Practitioner Psychiatrist Psychologist Other mental health professional (e) Other health professional(f)
537.8 149.5 238.0 150.7 143.8
29.9 8.3 13.2 8.4 8.0
137.2 *32.2 31.8 48.5 *53.1
8.2 *1.9 1.9 2.9 *3.2
149.2 *30.0 44.9 *30.9 65.7
3.2 *0.7 1.0 *0.7 1.4
824.2 211.7 314.7 230.0 262.7
10.2 2.6 3.9 2.9 3.3
Services used for mental health problems (g) No services used for mental health problems (h)
731.0 1 066.7
40.7 59.3
205.3 1 461.6
12.3 87.7
264.5 4 336.3
5.7 94.3
1 200.9 6 864.6
14.9 85.1
Total females aged 16–85 years
1 797.7
100.0
1 666.9
100.0
4 600.9
100.0
8 065.5
100.0
PER S O N S Services used for rmental health problems (a) General Practitioner Psychiatrist Psychologist Other mental health professional (e) Other health professional(f)
790.0 253.9 420.9 247.2 210.3
24.7 7.9 13.2 7.7 6.6
251.7 59.0 75.2 61.8 87.6
6.2 1.4 1.8 1.5 2.1
247.8 54.3 69.5 *47.1 87.1
2.8 0.6 0.8 *0.5 1.0
1 289.5 367.2 565.6 356.1 385.0
8.1 2.3 3.5 2.2 2.4
Services used for mental health problems (g) No services used for mental health problems (h)
1 116.4 2 081.5
34.9 65.1
375.8 3 713.0
9.2 90.8
408.6 8 320.1
4.7 95.3
1 900.8 14 114.5
11.9 88.1
Total persons aged 16–85 years
3 197.8
100.0
4 088.8
100.0
8 728.7
100.0
16 015.3
100.0
* ** (a) (b)
(c)
44
estimate has a relative standard error of 25% to 50% and should be used with caution estimate has a relative standard error greater than 50% and is considered too unreliable for general use In the 12 months prior to interview. See Services used for mental health problems in the Glossary. Persons who met criteria for diagnosis of a lifetime mental disorder (with hierarchy) and had symptoms in the 12 months prior to interview. See paragraphs 30–31 of Explanatory Notes. Persons who met criteria for diagnosis of a lifetime mental disorder (with hierarchy) and did not have symptoms in the 12 months prior to interview. See paragraphs 30–31 of Explanatory Notes.
(d) (e) (f)
(g)
(h)
Persons who did not meet criteria for diagnosis of a lifetime mental disorder. See paragraphs 30–31 of Explanatory Notes. Other mental health professional includes: mental health nurse and other professional providing specialist mental health services. Other health professional includes: medical specialist, other professional providing general services and complementary and alternative therapist. A person may have used more than one service for mental health. The components when added may therefore not add to the total shown. Also includes hospital admissions. Includes 'not stated'.
ABS • NAT I O N A L SUR V E Y OF MEN T A L HEA L T H AND WEL L B E I N G : SUMMA R Y OF RESU L T S • 432 6 . 0 • 200 7
13
NU M B E R OF 12 - MO N T H ME N T A L DIS O R D E R S WIT H O U T HIE R A R C H Y (a ) , by Per s o n s wh o us e d ser v i c e s fo r men t a l hea l t h pro b l e m s ( b )
General Practitioner
Psychiatrist
Psychologist
Total who used services for mental health problems(d)
Other(c)
No services used for mental health problems(e)
Total persons
%
%
%
%
%
%
'000
One disorder Anxiety disorder Affective disorder Substance Use disorder Total
11.5 35.9 *6.0 13.8
*3.3 *4.5 **2.1 *3.2
6.2 16.4 **4.7 7.3
6.8 *12.2 *4.3 7.1
21.2 44.8 *11.1 22.5
78.8 55.2 88.9 77.5
1 203.7 261.4 372.3 1 837.4
Two or more disorders Two or more disorders from the same group (f) Two or more disorders from different groups(f) Total
34.8 42.5 39.4
*14.0 14.5 14.3
17.1 23.7 21.0
14.2 23.9 19.9
43.4 57.2 51.7
56.6 42.8 48.3
548.1 812.3 1 360.4
Any 12-month mental disorder(a) No 12-month mental disorder(g)
24.7 3.9
7.9 0.9
13.2 1.1
12.5 2.1
34.9 6.1
65.1 93.9
3 197.8 12 817.5
8.1
2.3
3.5
4.2
11.9
88.1
16 015.3
Total persons aged 16–85 years
* ** (a)
(b) (c)
estimate has a relative standard error of 25% to 50% and should be used with caution estimate has a relative standard error greater than 50% and is considered too unreliable for general use Persons who met criteria for diagnosis of a lifetime mental disorder (without hierarchy) and had symptoms in the 12 months prior to interview. See paragraphs 30–31 of Explanatory Notes. In the 12 months prior to interview. See Services used for mental health problems in the Glossary. Other includes consultations with: mental health nurse, social worker, counsellor, medical specialist, and complementary and alternative therapist.
(d)
(e) (f) (g)
A person may have used more than one service for mental health. Therefore, the components when added may not equal the total shown. Also includes hospital admissions. Includes 'not stated'. These categories are mutually exclusive. Persons who did not meet criteria for diagnosis of a lifetime mental disorder and those who met criteria for diagnosis of a lifetime mental disorder (without hierarchy) but did not have symptoms in the 12 months prior to interview. See paragraphs 30–31 of Explanatory Notes.
ABS • NAT I O N A L SUR V E Y OF MEN T A L HEA L T H AND WEL L B E I N G : SUMMA R Y OF RESU L T S • 432 6 . 0 • 200 7
45
14
ME N T A L DIS O R D E R S , by Per s o n s wh o us e d ser v i c e s fo r men t a l hea l t h pro b l e m s ( a ) — Per c e i v e d nee d fo r hel p
Any 12-month mental disorder(b) '000
%
No 12-month mental disorder(c)
Total
'000
%
'000
%
MALE S Information No need Need fully met Need partially met Need not met
105.2 151.2 *64.3 *64.7
27.3 39.2 16.7 16.8
193.1 85.9 *19.2 *16.3
61.4 27.3 *6.1 *5.2
298.3 237.1 83.5 81.0
42.6 33.9 11.9 11.6
Medication No need Need fully met Need partially met Need not met
132.2 219.3 np np
34.3 56.9 np np
*144.8 149.8 np np
46.0 47.6 np np
276.9 369.0 *36.3 *13.7
39.6 52.7 *5.2 *2.0
Counselling No need Need fully met Need partially met Need not met
*54.5 231.2 *69.0 *30.6
14.1 60.0 *17.9 *7.9
154.5 111.8 *33.7 *13.8
49.1 35.5 *10.7 *4.4
209.0 343.0 102.7 44.4
29.9 49.0 14.7 6.3
Social intervention (d) No need Need fully met Need partially met Need not met
219.3 *58.7 *20.0 *87.4
56.9 *15.2 *5.2 22.7
274.2 *12.8 **9.7 *17.1
87.2 *4.1 **3.1 *5.4
493.5 71.5 *29.7 *104.5
70.5 10.2 *4.2 14.9
Skills training(e) No need Need fully met Need partially met Need not met
240.9 68.4 *19.5 *55.5
62.5 17.7 *5.1 *14.4
246.7 *42.0 **7.6 *17.4
78.4 *13.4 **2.4 *5.5
487.6 110.4 *27.1 *72.9
69.7 15.8 *3.9 *10.4
Total males aged 16–85 years(f)
385.4
100.0
314.6
100.0
699.9
100.0
* ** np (a) (b) (c)
(d) (e) (f)
46
estimate has a relative standard error of 25% to 50% and should be used with caution estimate has a relative standard error greater than 50% and is considered too unreliable for general use not available for publication but included in totals where applicable, unless otherwise indicated In the 12 months prior to interview. See Services used for mental health problems in the Glossary. Persons who met criteria for diagnosis of a lifetime mental disorder (with hierarchy) and had symptoms in the 12 months prior to interview. See paragraphs 30–31 of Explanatory Notes. Persons who did not meet criteria for diagnosis of a lifetime mental disorder and those who met criteria for diagnosis of a lifetime mental disorder (with hierarchy) but did not have symptoms in the 12 months prior to interview. See paragraphs 30–31 of Explanatory Notes. Includes help to sort out practical issues, such as housing or money problems, or help to meet people for support or company. Includes help to improve ability to work, to care for self, or to use time effectively. Total includes 'not stated'.
ABS • NAT I O N A L SUR V E Y OF MEN T A L HEA L T H AND WEL L B E I N G : SUMMA R Y OF RESU L T S • 432 6 . 0 • 200 7
14
ME N T A L DIS O R D E R S , by Per s o n s wh o us e d ser v i c e s fo r men t a l hea l t h pro b l e m s ( a ) — Per c e i v e d nee d fo r hel p
Any 12-month mental disorder(b) '000
%
cont i n u e d
No 12-month mental disorder(c)
Total
'000
%
'000
%
FEMAL ES Information No need Need fully met Need partially met Need not met
276.4 263.9 90.7 98.9
37.8 36.1 12.4 13.5
268.9 127.7 *29.1 42.2
57.2 27.2 *6.2 9.0
545.3 391.6 119.7 141.1
45.4 32.6 10.0 11.7
Medication No need Need fully met Need partially met Need not met
227.3 434.1 np np
31.1 59.4 np np
204.5 234.4 np np
43.5 49.9 np np
431.8 668.5 81.3 *17.7
36.0 55.7 6.8 *1.5
Counselling No need Need fully met Need partially met Need not met
159.2 384.6 113.2 74.0
21.8 52.6 15.5 10.1
116.8 272.9 41.9 *38.4
24.9 58.1 8.9 8.2
276.0 657.5 155.1 112.4
23.0 54.8 12.9 9.4
Social intervention (d) No need Need fully met Need partially met Need not met
513.0 61.2 23.3 132.7
70.2 8.4 3.2 18.1
371.0 *35.8 **15.1 47.9
79.0 *7.6 **3.2 10.2
884.0 97.1 *38.5 180.5
73.6 8.1 *3.2 15.0
Skills training(e) No need Need fully met Need partially met Need not met
516.0 89.0 *43.9 81.2
70.6 12.2 *6.0 11.1
367.3 *57.0 *7.4 *37.4
78.2 *12.1 *1.6 *8.0
883.4 146.0 *51.2 118.6
73.6 12.2 *4.3 9.9
Total females aged 16–85 years(f)
731.0
100.0
469.9
100.0
1 200.9
100.0
* ** np (a) (b) (c)
(d) (e) (f)
estimate has a relative standard error of 25% to 50% and should be used with caution estimate has a relative standard error greater than 50% and is considered too unreliable for general use not available for publication but included in totals where applicable, unless otherwise indicated In the 12 months prior to interview. See Services used for mental health problems in the Glossary. Persons who met criteria for diagnosis of a lifetime mental disorder (with hierarchy) and had symptoms in the 12 months prior to interview. See paragraphs 30–31 of Explanatory Notes. Persons who did not meet criteria for diagnosis of a lifetime mental disorder and those who met criteria for diagnosis of a lifetime mental disorder (with hierarchy) but did not have symptoms in the 12 months prior to interview. See paragraphs 30–31 of Explanatory Notes. Includes help to sort out practical issues, such as housing or money problems, or help to meet people for support or company. Includes help to improve ability to work, to care for self, or to use time effectively. Total includes 'not stated'.
ABS • NAT I O N A L SUR V E Y OF MEN T A L HEA L T H AND WEL L B E I N G : SUMMA R Y OF RESU L T S • 432 6 . 0 • 200 7
47
14
ME N T A L DIS O R D E R S , by Per s o n s wh o us e d ser v i c e s fo r men t a l hea l t h pro b l e m s ( a ) — Per c e i v e d nee d fo r hel p
Any 12-month mental disorder(b) '000
%
cont i n u e d
No 12-month mental disorder(c)
Total
'000
%
'000
%
PER SO N S Information No need Need fully met Need partially met Need not met
381.6 415.1 155.0 163.6
34.2 37.2 13.9 14.7
462.0 213.6 *48.3 58.5
58.9 27.2 *6.2 7.5
843.6 628.7 203.2 222.1
44.4 33.1 10.7 11.7
Medication No need Need fully met Need partially met Need not met
359.5 653.4 81.5 *18.6
32.2 58.5 7.3 *1.7
349.2 384.2 *36.1 *12.8
44.5 49.0 4.6 *1.6
708.7 1 037.5 117.6 *31.4
37.3 54.6 6.2 *1.7
Counselling No need Need fully met Need partially met Need not met
213.7 615.8 182.2 104.6
19.1 55.2 16.3 9.4
271.3 384.6 75.6 52.1
34.6 49.0 9.6 6.6
485.0 1 000.5 257.8 156.8
25.5 52.6 13.6 8.2
Social intervention (d) No need Need fully met Need partially met Need not met
732.2 120.0 43.3 220.1
65.6 10.7 3.9 19.7
645.3 *48.6 **24.8 65.0
82.3 *6.2 **3.2 8.3
1 377.5 168.5 *68.1 285.0
72.5 8.9 *3.6 15.0
Skills training(e) No need Need fully met Need partially met Need not met
756.9 157.4 *63.4 136.7
67.8 14.1 *5.7 12.2
614.1 *99.0 *15.0 54.8
78.3 12.6 *1.9 7.0
1 371.0 256.4 78.4 191.5
72.1 13.5 4.1 10.1
1 116.4
100.0
784.4
100.0
1 900.8
100.0
Total persons aged 16–85 years (f)
* ** (a) (b) (c)
(d) (e) (f)
48
estimate has a relative standard error of 25% to 50% and should be used with caution estimate has a relative standard error greater than 50% and is considered too unreliable for general use In the 12 months prior to interview. See Services used for mental health problems in the Glossary. Persons who met criteria for diagnosis of a lifetime mental disorder (with hierarchy) and had symptoms in the 12 months prior to interview. See paragraphs 30–31 of Explanatory Notes. Persons who did not meet criteria for diagnosis of a lifetime mental disorder and those who met criteria for diagnosis of a lifetime mental disorder (with hierarchy) but did not have symptoms in the 12 months prior to interview. See paragraphs 30–31 of Explanatory Notes. Includes help to sort out practical issues, such as housing or money problems, or help to meet people for support or company. Includes help to improve ability to work, to care for self, or to use time effectively. Total includes 'not stated'.
ABS • NAT I O N A L SUR V E Y OF MEN T A L HEA L T H AND WEL L B E I N G : SUMMA R Y OF RESU L T S • 432 6 . 0 • 200 7
15
12 - MO N T H ME N T A L DIS O R D E R S (a) , by Pe r s o n s wh o di d no t us e ser v i c e s fo r men t a l hea l t h pro b l e m s ( b ) — Per c e i v e d nee d fo r hel p
Males
Females
Persons
'000
%
'000
%
'000
%
Information No need Need not met
967.5 *47.2
95.3 *4.7
997.2 *69.5
93.5 *6.5
1 964.7 116.7
94.4 5.6
Medication No need Need not met
984.6 *30.1
97.0 *3.0
1 053.2 *13.5
98.7 *1.3
2 037.8 43.6
97.9 2.1
Counselling No need Need not met
939.9 74.9
92.6 7.4
928.0 138.7
87.0 13.0
1 867.9 213.6
89.7 10.3
Social intervention (c) No need Need not met
951.2 *63.6
93.7 *6.3
1 011.1 55.6
94.8 5.2
1 962.3 119.2
94.3 5.7
Skills training(d) No need Need not met
972.2 *42.6
95.8 *4.2
1 034.0 *32.7
96.9 *3.1
2 006.1 75.3
96.4 3.6
1 014.8
100.0
1 066.7
100.0
2 081.5
100.0
Total persons aged 16–85 years
* (a) (b) (c) (d)
estimate has a relative standard error of 25% to 50% and should be used with caution Persons who met criteria for diagnosis of a lifetime mental disorder (with hierarchy) and had symptoms in the 12 months prior to interview. See paragraphs 30–31 of Explanatory Notes. In the 12 months prior to interview. See Services used for mental health problems in the Glossary. Includes help to sort out practical issues, such as housing or money problems, or help to meet people for support or company. Includes help to improve ability to work, to care for self, or to use time effectively.
ABS • NAT I O N A L SUR V E Y OF MEN T A L HEA L T H AND WEL L B E I N G : SUMMA R Y OF RESU L T S • 432 6 . 0 • 200 7
49
EXPLA N A T O R Y NOTES
INTR ODU C TI ON
1 This publication presents a summary of results from the National Survey of Mental Health and Wellbeing (SMHWB), which was conducted throughout Australia from August to December 2007. This is the second mental health and wellbeing survey, with the previous survey conducted in 1997. Funding for this survey was provided by the Australian Government Department of Health and Ageing (DoHA). 2 The survey was based on a widely-used international survey instrument, developed by the World Health Organization (WHO) for use by participants in the World Mental Health Survey Initiative. The Initiative is a global study aimed at monitoring mental and addictive disorders. It aims to collect accurate information about the prevalence of mental, substance use and behavioural disorders. It measures the severity of these disorders and helps to determine the burden on families, carers and the community. It also assesses who is treated, who remains untreated and the barriers to treatment. The survey has been run in 32 countries, representing all regions of the world. 3 The survey used the World Mental Health Survey Initiative version of the World Health Organization's Composite International Diagnostic Interview, version 3.0 (WMH–CIDI 3.0). While most of the survey was based on the international survey modules, some modules, such as Health Service Utilisation, have been tailored to fit the Australian context. The adapted modules have been designed in consultation with subject matter experts from academic institutions and staff from the Mental Health Reform Branch of DoHA. Where possible, adapted modules used existing ABS questions. Extensive testing was conducted by the ABS to ensure that the survey would collect objective and high quality data. 4 Due to the high level of sensitivity of the survey's content, this survey was conducted on a voluntary basis. 5 ! ! ! !
! !
The 2007 SMHWB collected information about: lifetime and 12-month prevalence of selected mental disorders; level of impairment for these disorders; physical conditions; health services used for mental health problems, such as consultations with health practitioners or visits to hospital; social networks and caregiving; and demographic and socio-economic characteristics.
6 A full list of the data items from the 2007 SMHWB will be available in the National Survey of Mental Health and Wellbeing: Users' Guide (cat. no. 4327.0), planned for release on the ABS website in late 2008. The Users' Guide will also assist with evaluation and interpretation of the survey results. SCO P E AND COV E R A G E OF THE SURV EY
50
7 The scope of the survey is people aged 16–85 years, who were usual residents of private dwellings in Australia, excluding very remote areas. Private dwellings are houses, flats, home units and any other structures used as private places of residence at the time of the survey. People usually resident in non-private dwellings, such as hotels, motels, hostels, hospitals, nursing homes, and short-stay caravan parks were not in scope. Usual residents are those who usually live in a particular dwelling and regard it as their own or main home.
ABS • NAT I O N A L SUR V E Y OF MEN T A L HEA L T H AND WEL L B E I N G : SUMMA R Y OF RESU L T S • 432 6 . 0 • 200 7
E X P L A N A T O R Y N O T E S continued
SCO P E AND COV E R A G E OF
8
T H E S U R V E Y continued
! !
9 !
!
!
Scope inclusions: Members of the Australian permanent defence forces; and Overseas visitors who have been working or studying in Australia for the 12 months or more prior to the survey interview, or intended to do so. Scope exclusions: Non-Australian diplomats, non-Australian diplomatic staff and non-Australian members of their household; Members of non-Australian defence forces stationed in Australia and their dependents; and Overseas visitors (except for those mentioned in paragraph 8).
10 Proxy and foreign language interviews were not conducted. Therefore, people who were unable to answer for themselves were not included in the survey coverage but are represented in statistical outputs through inclusion in population benchmarks used for weighting. 11 The projected Australian adult resident population aged 16 years and over, as at 31 October 2007 (excluding people living in non-private dwellings and very remote areas of Australia), was 16,213,900, of which, 16,015,300 were aged 16–85 years. 12 Population benchmarks are projections of the most recently released quarterly Estimated Resident Population (ERP) data, in this case, 30 June 2007. For information on the methodology used to produce the ERP see Australian Demographic Statistics Quarterly (cat. no. 3101.0). To create the population benchmarks for the 2007 SMHWB, the most recently released quarterly ERP estimates were projected forward two quarters past the period for which they were required. The projection was based on the historical pattern of each population component - births, deaths, interstate migration and overseas migration. By projecting two quarters past that needed for the current population benchmarks, demographic changes are smoothed in, thereby making them less noticeable in the population benchmarks. SAMPLE DESIGN
13 The 2007 SMHWB was designed to provide reliable estimates at the national level. The survey was not designed to provide state/territory level data, however, some data may be available (on request) for the states with larger populations, eg New South Wales. Users should exercise caution when using estimates at this level due to high sampling errors. RSEs for all estimates in this publication are available free-of-charge on the ABS website , released in spreadsheet format as an attachment to this publication. As a guide, the population and RSE estimates for Table 2 have also been included in the Technical Note. 14 Dwellings included in the survey in each state and territory were selected at random using a stratified, multistage area sample. This sample included only private dwellings from the geographic areas covered by the survey. Sample was allocated to states and territories roughly in proportion to their respective population size. The expected number of fully-responding households was 11,000. 15 To improve the reliability of estimates for younger (16–24 years) and older (65–85 years) persons, these age groups were given a higher chance of selection in the household person selection process. That is, if you were a household member within the younger or older age group, you were more likely to be selected for interview than other household members. 16 There were 17,352 private dwellings initially selected for the survey. This sample was expected to deliver the desired fully-responding sample, based on an expected response rate of 75% and sample loss. The sample was reduced to 14,805 dwellings due to the loss of households with no residents in scope for the survey and where dwellings proved to be vacant, under construction or derelict.
ABS • NAT I O N A L SUR V E Y OF MEN T A L HEA L T H AND WEL L B E I N G : SUMMA R Y OF RESU L T S • 432 6 . 0 • 200 7
51
E X P L A N A T O R Y N O T E S continued
S A M P L E D E S I G N continued
17 Of the eligible dwellings selected, there were 8,841 fully-responding households, representing a 60% response rate at the national level. Interviews took, on average, around 90 minutes to complete. 18 Some survey respondents provided most of the required information, but were unable or unwilling to provide a response to certain data items. The records for these persons were retained in the sample and the missing values were recorded as 'don't know' or 'not stated'. No attempt was made to deduce or impute for these missing values. 19 Due to the lower than expected response rate, the ABS undertook extensive non-response analyses as part of the validation and estimation process. A Non-Response Follow-Up Study (NRFUS) was conducted from January to February 2008. The aim of the NRFUS was to provide a qualitative assessment of the likelihood of non-response bias associated with the 2007 SMHWB estimates. 20 The Non-Response Follow-Up Study (NRFUS) consisted of a sample of non-respondents from the 2007 SMHWB in Sydney and Perth and was based on reduced survey content. It had a response rate of 39%, yielding information on 151 non-respondents. Further information on the non-response analyses is provided in paragraphs 63–72.
DAT A COL L E C T I O N
21 A group of ABS officers were trained in the use of the Composite International Diagnostic Interview (CIDI) by staff from the CIDI Training and Reference Center, University of Michigan. These officers then provided training to experienced ABS interviewers, as part of a comprehensive four-day training program, which also included sensitivity training and field procedures. 22 Trained ABS interviewers conducted personal interviews at selected private dwellings from August to December 2007. Interviews were conducted using a Computer-Assisted Interviewing (CAI) questionnaire. CAI involves the use of a notebook computer to record, store, manipulate and transmit the data collected during interviews. 23 One person in the household, aged 18 years or over, was selected to provide basic information, such as age and sex, for all household members. This person, or an elected household spokesperson, also answered some financial and housing items, such as income and tenure, on behalf of other household members. 24 Once basic details had been recorded for all in-scope household members, one person aged 16–85 years was randomly selected to complete a personal interview. Younger and older persons were given a higher chance of selection. See paragraph 15 and paragraph 50 for more information.
SURVEY CONTENT
25 Broadly, the 2007 SMHWB collected information on: selected mental disorders; the use of health services and medication for mental health problems; physical conditions; disability; social networks and caregiving; demographic; and socio-economic characteristics. 26 A Survey Reference Group, comprising experts and key stakeholders in the field of mental health, provided the ABS with advice on the survey content, including the most appropriate topics for collection, and associated concepts and definitions. They also provided advice on issues that arose during field tests and the most suitable survey outputs. Group members included representatives from government departments, universities, health research organisations, carers organisations and consumer groups.
52
ABS • NAT I O N A L SUR V E Y OF MEN T A L HEA L T H AND WEL L B E I N G : SUMMA R Y OF RESU L T S • 432 6 . 0 • 200 7
E X P L A N A T O R Y N O T E S continued
SELECTED MENTAL
27 The 2007 SMHWB collected information on selected mental disorders, which were considered to have the highest rates of prevalence in the population and that were able to be identified in an interviewer based household survey. These mental disorders were: ! Anxiety disorders ! Panic Disorder ! Agoraphobia ! Social Phobia ! Generalised Anxiety Disorder (GAD) ! Obsessive-Compulsive Disorder (OCD) ! Post-Traumatic Stress Disorder (PTSD) ! Affective (mood) disorders ! Depressive Episode ! Dysthymia ! Bipolar Affective Disorder ! Substance Use disorders ! Alcohol Harmful Use ! Alcohol Dependence ! Drug Use Disorders
DISORDERS
COMPOSITE INTERNATIO NAL DIAGNOSTIC INTERVIEW (CIDI)
28 Measuring mental health in the community through household surveys is complex, as mental disorders are usually determined through detailed clinical assessment. To estimate the prevalence of specific mental disorders, the 2007 National Survey of Mental Health and Wellbeing used the World Mental Health Survey Initiative version of the World Health Organization's Composite International Diagnostic Interview, version 3.0 (WMH–CIDI 3.0). The WMH–CIDI 3.0 was chosen because it: ! provides a fully structured diagnostic interview; ! can be administered by lay interviewers; ! is widely used in epidemiological surveys; ! is supported by the World Health Organization (WHO); and ! provides comparability with similar surveys conducted worldwide. 29 The WMH–CIDI 3.0 provides an assessment of mental disorders based on the definitions and criteria of two classification systems: the DIAGNOSTIC AND STATISTICAL MANUAL OF MENTAL DISORDERS, FOURTH EDITION (DSM–IV); and the WHO INTERNATIONAL CLASSIFICATION OF DISEASES, TENTH REVISION (ICD–10). Each classification system lists sets of criteria that are necessary for diagnosis. The criteria specify the nature and number of symptoms required; the level of distress or impairment required; and the exclusion of cases where symptoms can be directly attributed to general medical conditions, such as a physical injury, or to substances, such as alcohol. 30 The 2007 SMHWB was designed to provide lifetime prevalence estimates for mental disorders. Respondents were asked about experiences throughout their lifetime. In this survey, 12-month diagnoses were derived based on lifetime diagnosis and the presence of symptoms of that disorder in the 12 months prior to the survey interview. The full diagnostic criteria were not assessed within the 12 month time-frame. This differs from the 1997 survey where diagnostic criteria were assessed solely on respondents' experiences in the 12 months prior to the survey interview. More information on the comparison between the 1997 and 2007 surveys is provided in Appendix 2. 31 Diagnostic algorithms are specified in accordance with the DSM–IV and ICD–10 classification systems. As not all modules contained in the WMH–CIDI 3.0 were operationalised for the 2007 SMHWB, it was necessary to tailor the diagnostic algorithms to fit the Australian context. Data in this publication are presented using the ICD–10 classification system. Prevalence rates are presented with hierarchy rules applied, for more information see paragraphs 34–37. More information on the WMH–CIDI 3.0 diagnostic assessment criteria according to the ICD–10 is provided in Appendix 1.
ABS • NAT I O N A L SUR V E Y OF MEN T A L HEA L T H AND WEL L B E I N G : SUMMA R Y OF RESU L T S • 432 6 . 0 • 200 7
53
E X P L A N A T O R Y N O T E S continued
COMPOSITE INTERNATIO NAL DIAGNOSTIC INTERVIEW (CIDI) continued
32 A screener was introduced to the WMH–CIDI 3.0 to try to alleviate the effects of learned responses, such as providing a particular response to avoid further questions. The module included a series of introductory questions about the respondent's general health, followed by diagnostic screening questions for the primary disorders assessed in the survey, eg Depressive Episode. This screening method has been shown to increase the accuracy of diagnostic assessments, by reducing the effects of learned responses due to respondent fatigue. Other non-core disorders, such as Obsessive-Compulsive Disorder (OCD), were screened at the beginning of the individual module. 33 ! !
!
!
HIERARCHY RULES
The WMH–CIDI 3.0 was also used to collect information on: the onset of symptoms and mental disorders; the courses of mental disorders, that is, the varying degrees to which the symptoms of mental disorders present themselves, including: episodic (eg depression), clusters of attacks (eg panic disorder), and fairly persistent dispositions (eg phobias); the impact of mental disorders on home management, work life, relationships and social life; and treatment seeking and access to helpful treatment.
34 The classification system for some of the ICD–10 disorders contain diagnostic exclusion rules so that a person, despite having symptoms that meet diagnostic criteria, will not meet criteria for particular disorders because the symptoms are believed to be accounted for by the presence of another disorder. In these cases, one disorder takes precedence over another. These exclusion rules are built into the diagnostic algorithms. 35 The developers of WMH–CIDI 3.0 established two versions of the diagnoses in the algorithms for a number of the mental disorders: a 'with hierarchy' version and a 'without hierarchy' version. The 'with hierarchy' version specifies the full diagnostic criteria consistent with the ICD–10 classification system (ie the exclusion criteria are enforced). The 'without hierarchy' version applies all diagnostic criteria except the criteria specifying the hierarchical relationship with other disorders. More information on the WMH–CIDI 3.0 diagnostic assessment criteria according to the ICD–10 is provided in Appendix 1. 36 One example of a disorder specified with and without hierarchy is Alcohol Harmful Use. ICD–10 states that in order for diagnostic criteria for Harmful Use to be met, criteria cannot be met for Dependence on the same substance during the same time period. Therefore, the ‘with hierarchy’ version of Alcohol Harmful Use will exclude cases where Alcohol Dependence has been established for the same time period. The ‘without hierarchy’ version includes all cases of Alcohol Harmful Use regardless of coexisting Alcohol Dependence. Note that a person can meet criteria for Alcohol Dependence and the hierarchical version of Alcohol Harmful Use if there is no overlap in time between the two disorders. 37 Throughout this publication, the ICD–10 prevalence rates are presented with the hierarchy rules applied, except for the comorbidity data, which are presented without hierarchy. The ICD–10 disorders specified with and without hierarchy in this publication are: Generalised Anxiety Disorder; Hypomania; Mild, Moderate and Severe Depressive Episode; Dysthymia; and the Harmful Use of Alcohol, Cannabis, Sedatives, Stimulants and Opioids.
54
ABS • NAT I O N A L SUR V E Y OF MEN T A L HEA L T H AND WEL L B E I N G : SUMMA R Y OF RESU L T S • 432 6 . 0 • 200 7
E X P L A N A T O R Y N O T E S continued
COMORBIDITY
38 Comorbidity is the co-occurrence of more than one disease and/or disorder in an individual. Mental disorders may co-occur for a variety of reasons, and Substance Use disorders frequently co-occur (CDHAC, 2001). A person with co-occurring diseases or disorders is likely to experience more severe and chronic medical, social and emotional problems than if they had a single disease or disorder. People with comorbid conditions are also more vulnerable to alcohol and drug relapses, and relapse of mental health problems. Higher numbers of disorders are also associated with greater impairment, higher risk of suicidal behaviour and greater use of health services. 39 In this publication, information is presented on both the comorbidity of mental disorder groups and physical conditions (Table 10), and the co-occurrence of more than one mental disorder with physical conditions (Table 11). As people with comorbid disorders generally require higher levels of support than people with only one disorder, Table 13 presents the number of 12-month mental disorders by services used for mental health problems. 40 All comorbidity tables in this publication are presented without the WMH–CIDI 3.0 hierarchy rules applied to provide a more complete picture of the combinations of symptoms and disorders experienced by individuals. For more information on hierarchy rules see paragraphs 34–37 and Appendix 1.
CHRONIC CONDITIO NS
41 Questions regarding chronic conditions have been adapted from a module in the WMH–CIDI 3.0, to enable some cross-country comparisons of physical conditions. The resulting module comprised: a checklist of the National Health Priority Area physical conditions, such as asthma, heart condition and diabetes and the presence of a restricted set of physical conditions only if they had lasted for six months or more (for a complete list refer to Physical conditions in the Glossary). The module also included: questions on whether the conditions occurred in the 12 months prior to the survey interview and the age of onset of these conditions; a standard set of ABS questions on role impairment (ABS disability module); and questions to determine hypochondriasis/somatisation. 42 Respondents were asked a series of questions relating to health risk factors, specifically those related to lifestyle behaviours. The 2007 SMHWB collected information on smoking, level of exercise, and self-reported height and weight measurements to calculate a Body Mass Index (BMI). This was the first time that questions on physical activity and body mass were included in the SMHWB.
THE KESSLER PSYCHOLOG ICAL DISTRESS SCALE (K10)
FUNCTIONING
43 The Kessler Psychological Distress Scale (K10) is a widely used screening instrument, which gives a simple measure of psychological distress. It is not a diagnostic tool, but is an indicator of psychological distress. The K10 is based on a person's emotional state during the 30 days prior to the survey interview. Respondents were asked a series of 10 questions and for each item, they provided a five-level response scale, based on the amount of time they reported experiencing the particular problem. The response scale of '1 to 5' corresponds to a scale that ranges from 'none of the time' to 'all of the time'. Scores for the 10 questions are put together, with a minimum possible score of 10 and a maximum possible score of 50. Low scores indicate low levels of psychological distress and high scores indicate high levels of psychological distress. 44 A series of measures were used to determine the extent to which health problems affected the respondent's life and activities during the 30 days prior to the survey. This module included questions from the World Health Organization's Disability Assessment Schedule (WHODAS) and the (Australian) Assessment of Quality of Life (AQoL) instrument. Two questions on 30–day functioning ('Days out of role'), from the 1997 SMHWB were also included in this module.
ABS • NAT I O N A L SUR V E Y OF MEN T A L HEA L T H AND WEL L B E I N G : SUMMA R Y OF RESU L T S • 432 6 . 0 • 200 7
55
E X P L A N A T O R Y N O T E S continued
HEALTH SERVICE UTILISATION
45 Respondents were asked about their health service utilisation for mental health problems and/or physical conditions. Health service utilisation covered admissions to hospital and consultations with a range of health professionals. Respondents were also asked about the number and length of admissions to hospital; the number of consultations with health professionals for mental health problems; and the method of payment for consultations. 46 Further information on the survey modules will be available in the National Survey of Mental Health and Wellbeing: Users' Guide (cat. no. 4327.0), planned for release on the ABS website in late 2008.
DAT A PRO C E S S I N G
47 A combination of clerical and computer-based systems were used to process data from the 2007 SMHWB. The content of the data file was checked to identify unusual values which may have significantly altered estimates and also to assess illogical relationships not previously identified by edits. Where necessary, the ABS sought the advice of subject matter experts from academic institutions in order to determine the appropriate treatment. 48 The survey contained a number of open-ended questions, for which there were no predetermined responses. These responses were office coded. Some of the open-ended questions formed part of the assessment to determine whether a respondent met the criteria for diagnosis of a mental health disorder. These open-ended questions were designed to probe causes of a particular episode or symptom. Responses were then used to eliminate cases where there was a clear physical cause. As part of the processing procedures set out for the WMH–CIDI 3.0, responses provided to the open-ended questions are required to be interpreted by a suitably qualified person. The technical assistance for coding of the open-ended diagnostic-related questions for the 2007 SMHWB was provided by the University of New South Wales. Further information on data processing will be available in the National Survey of Mental Health and Wellbeing: Users' Guide (cat. no. 4327.0), planned for release on the ABS website in late 2008.
WEIG H T I N G , BENC H M A R K I N G AND ESTI M A TI ON WEIGHTING
49 Weighting is the process of adjusting results from a sample survey to infer results for the total in-scope population. To do this, a 'weight' is allocated to each sample unit corresponding to the level at which population statistics are produced, eg household and person level. The weight can be considered an indication of how many population units are represented by the sample unit. For the 2007 SMHWB, separate person and household weights were developed. SELE C T I O N WEIG H T S
50 The first step in calculating weights for each person or household is to assign an initial weight, which is equal to the inverse of the probability of being selected in the survey. For the 2007 SMHWB, due to the length of the interview, only one in-scope person was selected per household. Thus the initial person weight was derived from the initial household weight according to the total number of in-scope persons in the household and the differential probability of selection by age used to obtain more younger (16–24 years) and older (65–85 years) persons in the sample.
56
ABS • NAT I O N A L SUR V E Y OF MEN T A L HEA L T H AND WEL L B E I N G : SUMMA R Y OF RESU L T S • 432 6 . 0 • 200 7
E X P L A N A T O R Y N O T E S continued
WEIGHTING continued
51 Apart from the 8,841 fully-responding households, basic information was obtained from the survey's household form for an additional 1,476 households and their occupants. This information was provided by a household member aged 18 years or over. In the case of these 1,476 households, the selected person did not complete the main questionnaire (eg they were unavailable or refused to participate). The information provided by these additional 1,476 households was analysed to determine if an adjustment to initial selection weights could be made as a means of correcting for non-response. However, no explicit adjustment was made to the weighting due to the negligible impact on survey estimates.
BENCHMARKING
52 The person and household weights were separately calibrated to independent estimates of the population of interest, referred to as 'benchmarks'. Weights calibrated against population benchmarks ensure that the survey estimates conform to the independently estimated distributions of the population rather than to the distribution within the sample itself. Calibration to population benchmarks helps to compensate for over- or under-enumeration of particular categories which may occur due to either the random nature of sampling or non-response. This process can reduce the sampling error of estimates and may reduce the level of non-response bias. 53 A standard approach in ABS household surveys is to calibrate to population benchmarks by state, part of state, age and sex. In terms of the effectiveness of 'correcting' for potential non-response bias, it is assumed that the characteristics being measured by the survey for the responding population are similar to the non-responding population within weighting classes, as determined by the benchmarking strategy. Where this assumption does not hold, biased estimates may result. 54 Given the relatively low response rate for the 2007 SMHWB, extensive analysis was done to ascertain whether further benchmark variables, in addition to geography, age, and sex, should be incorporated into the weighting strategy. Analysis showed that the standard weighting approach did not adequately compensate for differential undercoverage in the 2007 SMHWB sample for variables such as educational attainment, household composition, and labour force status, when compared to other ABS surveys and the 2006 Census of Population and Housing. As these variables were considered to have possible association with mental health characteristics, additional benchmarks were incorporated into the weighting strategy. 55 Initial person weights were simultaneously calibrated to the following population benchmarks: ! state by part of state by age by sex; and ! state by household composition; and ! state by educational attainment; and ! state by labour force status. 56 The state by part of state by age and sex benchmarks were obtained from demographic projections of the resident population, aged 16–85 years who were living in private dwellings, excluding very remote areas of Australia, at 31 October 2007. The projected resident population was based on the 2006 Census of Population and Housing using 30 June 2007 as the latest available Estimated Resident Population base. Therefore, the SMHWB estimates do not (and are not intended to) match estimates for the total Australian resident population (which include persons and households living in non-private dwellings, such as hotels and boarding houses, and in very remote parts of Australia) obtained from other sources.
ABS • NAT I O N A L SUR V E Y OF MEN T A L HEA L T H AND WEL L B E I N G : SUMMA R Y OF RESU L T S • 432 6 . 0 • 200 7
57
E X P L A N A T O R Y N O T E S continued
BENCHMARKING continued
57 The remaining benchmarks were obtained from other ABS survey data. These benchmarks are considered 'pseudo-benchmarks' as they are not demographic counts and they have a non-negligible level of sample error associated with them. The 2007 Survey of Education and Work (persons aged 16–64 years) was used to provide a pseudo-benchmark for educational attainment. The monthly Labour Force Survey (September to December 2007) provided the pseudo-benchmark for labour force status, as well as the resident population living in households by household composition. The pseudo-benchmarks were aligned to the projected resident population aged 16–85 years, who were living in private dwellings in each state and territory, excluding very remote areas of Australia, at 31 October 2007. The pseudo-benchmark of household composition was also aligned to the projected household composition population counts of households. The sample error associated with these pseudo-benchmarks was incorporated into the standard error estimation. 58 Household weights were derived by separately calibrating initial household selection weights to the projected household composition population counts of households containing persons aged 16–85 years, who were living in private dwellings in each state and territory, excluding very remote areas of Australia, at 31 October 2007.
ESTIMATIO N
59 Estimates of counts of persons are obtained by summing person weights of persons with the characteristic of interest. Similarly, household estimates are produced using household level weights. The majority of estimates contained in this publication are based on benchmarked person weights. 60 Further information on weighting, benchmarking and estimation will be available in the National Survey of Mental Health and Wellbeing: Users' Guide (cat. no. 4327.0), planned for release on the ABS website in late 2008.
REL I A B I L I T Y OF EST I M A T E S
SAMPLING ERROR
58
61 All sample surveys are subject to error which can be broadly categorised as either sampling error or non-sampling error. Sampling error occurs because only a small proportion of the total population is used to produce estimates that represent the whole population. Sampling error can be reliably measured as it is calculated based on the scientific methods used to design surveys. Non-sampling error may occur in any data collection, whether it is based on a sample or a full count (eg Census). Non-sampling error may occur at any stage throughout the survey process. For example, persons selected for the survey may not respond (non-response); survey questions may not be clearly understood by the respondent; responses may be incorrectly recorded by interviewers; or there may be errors in coding or processing survey data. 62 Sampling error is the expected random difference that could occur between the published estimates, derived from using a sample of persons, and the value that would have been produced if all persons in scope of the survey had been enumerated. A measure of the sampling error for a given sample estimate is provided by the standard error, which may be expressed as a percentage of the estimate (relative standard error). For more information refer to the Technical Note. In this publication estimates with relative standard errors (RSEs) of 25% to 50% are preceded by an asterisk (eg *3.4) to indicate that the estimate should be used with caution. Estimates with RSEs over 50% are indicated by a double asterisk (eg **0.6) and should be considered unreliable for most purposes.
ABS • NAT I O N A L SUR V E Y OF MEN T A L HEA L T H AND WEL L B E I N G : SUMMA R Y OF RESU L T S • 432 6 . 0 • 200 7
E X P L A N A T O R Y N O T E S continued
NON-RESPO NSE AND NON-SAMPL ING ERROR
63 Non-response may occur when people cannot or will not cooperate, or cannot be contacted. Unit and item non-response by persons/households selected in the survey can affect both sampling and non-sampling error. The loss of information on persons and/or households (unit non-response) and on particular questions (item non-response) reduces the effective sample and increases sampling error. 64 Non-response can also introduce non-sampling error by creating a biased sample. The magnitude of any non-response bias depends upon the level of non-response and the extent of the difference between the characteristics of those people who responded to the survey and those who did not within population subgroups as determined by the weighting strategy. See paragraphs 49–58. 65 To reduce the level and impact of non-response, the following methods were adopted in this survey: ! face-to-face interviews with respondents; ! follow-up of respondents if there was initially no response; ! ensuring the weighted file is representative of the population by aligning the estimates with population benchmarks; ! use of pseudo-benchmarks for educational attainment, labour force status and household composition; and ! a Non-Response Follow-Up Study (NRFUS) was conducted to gain qualitative assessment of possible bias. 66 Every effort was made to minimise other non-sampling error by careful design and testing of questionnaires, intensive training of interviewers, and extensive editing and quality control procedures at all stages of data processing. 67 An advantage of the Computer-Assisted Interview (CAI) used for this survey is that it potentially reduces non-sampling errors by enabling edits to be applied as the data are being collected. These edits allow the interviewer to query respondents and resolve issues during the interview. Sequencing of questions is also automated so that respondents are asked only relevant questions and only in the appropriate sequence, eliminating interviewer sequencing errors. 68 Of the eligible dwellings selected in the 2007 SMHWB, 5,851 (40%) did not respond fully or adequately. Reflecting the sensitive topic for the survey, the average expected interview length (of around 90 minutes) combined with the voluntary nature of the survey, almost two-thirds (61%) of these dwellings were full refusals. Household details were provided by more than a quarter (27%) of these dwellings, but then the selected person did not complete the main questionnaire. The remainder of these dwellings (12%) provided partial or incomplete information. As the level of non-response for this survey was significant, extensive non-response analyses to assess the reliability of the survey estimates were undertaken.
ABS • NAT I O N A L SUR V E Y OF MEN T A L HEA L T H AND WEL L B E I N G : SUMMA R Y OF RESU L T S • 432 6 . 0 • 200 7
59
E X P L A N A T O R Y N O T E S continued
NON-RESPO NSE AND NON-SAMPL ING ERROR continued
69 A purposive small sample/short-form intensive Non-Response Follow-Up Study (NRFUS) was developed for use with non-respondents in Sydney and Perth. The NRFUS was conducted from January to February 2008 and achieved a response rate of 39%. It used a short-form questionnaire containing demographic questions and the Kessler Psychological Distress Scale (K10). The short-form approach used for the NRFUS precluded the use of the full diagnostic assessment modules. As a minor proxy of the mental health questions, the K10 was included for qualitative assessment against the 2007 SMHWB. The aim of the NRFUS was to provide a qualitative assessment of the likelihood of non-response bias. Respondents to the NRFUS were compared to people who responded fully to the 2007 SMHWB by a number of demographic variables, such as age, sex and marital status. The analysis undertaken suggests that there may be differences in the direction and magnitude of potential non-response bias between various geographical, age and sex domains that the weighting strategy does not correct for. The magnitude of potential non-response bias appears to be small at the aggregate level. The results of the study suggest there is possible underestimation in the prevalence of mental health conditions in Perth, for men, and for young persons. However, given the small size and purposive nature of the NRFUS sample, the results of the study were not explicitly incorporated into the 2007 SMHWB weighting strategy. 70 Analysis was also undertaken to compare the characteristics of respondents to the 2007 SMHWB with a number of ABS collections, including: the 2006 Census of Population and Housing, 2004–05 National Health Survey, 2007 Survey of Education and Work and the monthly Labour Force Survey, to ascertain data consistency. From this analysis, it was determined that some of the demographic and socio-economic characteristics from the initial weighted data did not align with other ABS estimates. These additional (or 'pseudo') benchmarks were used to adjust for differential undercoverage of educational attainment, labour force status and household composition. See paragraphs 52–58. 71 Categorisation of interviewer remarks from the NRFUS and the 2007 SMHWB indicated that the majority of persons who refused stated that they were 'too busy' or 'not interested' in participating in the survey. 72 Further details of the non-response analysis will be available in the National Survey of Mental Health and Wellbeing: Users' Guide (cat. no. 4327.0), planned for release on the ABS website in late 2008.
60
SEAS O N A L EFFE C T S
73 The estimates in this publication are based on information collected from August to December 2007, and due to seasonal effects they may not be fully representative of other time periods in the year. Therefore, the results could have differed if the survey had been conducted over the whole year or in a different part of the year.
INTER P R E T A T I O N OF RES U L T S
74 Care has been taken to ensure that the results of this survey are as accurate as possible. All interviews were conducted by trained ABS officers. Extensive reference material was developed for use and intensive training was provided to interviewers. There remain, however, other factors which may have affected the reliability of results, and for which no specific adjustments can be made. The following factors should be considered when interpreting these estimates: ! Information recorded in this survey is 'as reported' by respondents, and therefore may differ from information available from other sources or collected using different methodologies. Responses may be affected by imperfect recall or individual interpretation of survey questions. ! Some respondents may have provided responses that they felt were expected, rather than those that accurately reflected their own situation. Every effort has been made to minimise such bias through the development and use of culturally appropriate survey methodology.
ABS • NAT I O N A L SUR V E Y OF MEN T A L HEA L T H AND WEL L B E I N G : SUMMA R Y OF RESU L T S • 432 6 . 0 • 200 7
E X P L A N A T O R Y N O T E S continued
INTER P R E T A T I O N OF RES U L T S continued
75 For a number of survey data items, some respondents were unwilling or unable to provide the required information. Where responses for a particular data item were missing for a person or household they were recorded in a 'not known' or 'not stated' category for that data item. These 'not known' or 'not stated' categories are not explicitly shown in the publication tables, but have been included in the totals. Publication tables presenting proportions have included any 'not known' or 'not stated' categories in the calculation of these proportions. 76 The employment component of this survey is based on a reduced set of questions from the ABS monthly Labour Force Survey. 77 In terms of physical conditions, reported information was not medically verified, and was not necessarily based on diagnoses by a medical practitioner. 78 In terms of mental disorders, the WMH–CIDI 3.0 makes diagnoses against specific criteria. It has no facility for subjective interpretation. Therefore, it cannot always replicate diagnoses made by a health professional. Symptoms which have a considerable effect on people are likely to be better reported than those which have little effect. 79 The results of previous surveys on alcohol and illegal drug consumption suggest a tendency for respondents to under-report actual consumption levels. 80 The primary focus of the diagnostic modules is on the assessment of a lifetime mental disorder. This is based on the time when the respondent had the most symptoms or the worst period of this type. Where a number of symptoms have been endorsed across a lifetime, the respondent is asked about the presence of symptoms in the 12 months prior to the survey interview. To be included in the 12-month prevalence rates in the 2007 SMHWB, people must have met the criteria for lifetime diagnosis and had symptoms in the 12 months prior to interview. This differs from the 1997 SMHWB, where the diagnostic criteria were assessed solely on respondents' experiences in the 12 months prior to the survey interview. 81 The inclusion of lifetime diagnosis in the 2007 SMHWB may have led to higher prevalence of 12-month mental disorders compared to the 1997 survey. In the 2007 survey, people may have met the criteria for lifetime diagnosis and had symptoms in the 12 months prior to interview. However, they may not have met full diagnostic criteria within the 12-month time-frame, as was required in the 1997 survey. A number of other issues also need to be considered when comparing prevalence rates between the two surveys. For more information on comparability see paragraphs 85–95. 82 The exclusion of residents in special dwellings (eg hotels, boarding houses and institutions) and homeless people will have affected the results. It is therefore likely that the survey underestimates the prevalence of mental disorders in the Australian population. 83 Due to the higher than expected non-response rate, extensive analysis has been conducted to measure the reliability of the survey estimates. The Non-Response Follow-Up Survey (NRFUS) provided some qualitative analysis on the possible differing characteristics of fully-responding and non-responding persons. As non-response bias can impact on population characteristics, as well as across data items, users should exercise caution. More information on non-response is provided in paragraphs 63–72. 84 More information on interpreting the survey will be available in the National Survey of Mental Health and Wellbeing: Users' Guide (cat. no. 4327.0), planned for release on the ABS website in late 2008.
ABS • NAT I O N A L SUR V E Y OF MEN T A L HEA L T H AND WEL L B E I N G : SUMMA R Y OF RESU L T S • 432 6 . 0 • 200 7
61
E X P L A N A T O R Y N O T E S continued
COM P A R A B I L I T Y WIT H THE 1997 SURV E Y
85 In 1997 the ABS conducted the National Survey of Mental Health and Wellbeing of Adults. The survey provided information on the prevalence of selected 12-month mental disorders, the level of disability associated with those disorders, health services used, and perceived need for help with a mental health problem for Australians aged 18 years and over. The survey was an initiative of, and was funded by, the then Commonwealth Department of Health and Family Services, as part of the National Mental Health Strategy. A key aim of the 1997 survey was to provide prevalence estimates for mental disorders in a 12 month time-frame. Therefore, diagnostic criteria were assessed solely on respondents' experiences in the 12 months prior to the survey interview. 86 The 2007 survey was designed to provide lifetime prevalence estimates for mental disorders. Respondents were asked about experiences throughout their lifetime. In the 2007 survey, 12-month diagnoses were derived based on lifetime diagnosis and the presence of symptoms of that disorder in the 12 months prior to the survey interview. The full diagnostic criteria were not assessed within the 12 month time-frame. Users should exercise caution when comparing data from the two surveys. 87 The diagnoses of mental disorders for the 2007 SMHWB are based on the WMH–CIDI 3.0, while the 1997 SMHWB diagnoses were based on an earlier version of the CIDI (version 2.1). Apart from the differences in time-frames, the WMH–CIDI 3.0 differs from earlier versions as it has a number of expanded modules, incorporates changes to diagnostic algorithms and sequencing, and utilises a diagnostic 'screener'. For example, the number of questions asked about scenarios which may have triggered a Post-Traumatic Stress Disorder (PTSD) has increased substantially, from 10 questions in 1997 to 28 questions in 2007. Additionally, in 1997 respondents were excluded if they said their extremely stressful or upsetting event was only related to bereavement, chronic illness, business loss, marital or family conflict, a book, movie or television show. A summary of the differences between the two surveys is provided in Appendix 2. The WMH–CIDI 3.0 diagnostic assessment criteria according to the ICD–10 for the 2007 SMHWB are provided in Appendix 1. For more information on the WMH–CIDI 3.0 visit the World Mental Health website . 88 In this survey publication, the ICD–10 prevalence rates are presented with the hierarchy rules applied, except for the comorbidity data, which are presented without hierarchy. This varies from how the comorbidity data was presented in the 1997. All data in the 1997 survey publication were presented with the hierarchy rules applied. For more information on hierarchy rules and comorbidity see paragraphs 34–40. 89 Both surveys collected information from persons in private dwellings throughout Australia. The 2007 SMHWB collected information from people aged 16–85 years, while the 1997 SMHWB collected information on people aged 18 years and over. For more information on scope and sample design refer to paragraphs 7–20. 90 The enumeration period of each survey differs, which may impact on data comparisons. The 2007 SMHWB was undertaken from August to December, while the 1997 survey was undertaken from May to August. See seasonal effects in paragraph 73. 91 The classification of several demographic and socio-economic characteristics used in the 2007 SMHWB differ to those used in 1997, including: education, occupation, languages spoken and geography. Industry of employment was collected for the first time in 2007. See classifications in paragraphs 96–102.
62
ABS • NAT I O N A L SUR V E Y OF MEN T A L HEA L T H AND WEL L B E I N G : SUMMA R Y OF RESU L T S • 432 6 . 0 • 200 7
E X P L A N A T O R Y N O T E S continued
COM P A R A B I L I T Y WIT H THE 1 9 9 7 S U R V E Y continued
92 Several of the scales and measures used to estimate disability and functioning in the 2007 SMHWB differ from those used in 1997. The 2007 survey includes a standard set of ABS questions on role impairment (ABS Short Disability Module), the World Health Organization Disability Assessment Schedule (WHODAS) and the Australian Assessment of Quality of Life (AQoL). In comparison, the 1997 survey collected information on disability and functioning using the Brief Disability Questionnaire, the Short–Form 12 and the General Health Questionnaire (GHQ–12). Both surveys contained questions on physical health, health related risk factors and 'days out of role'. However, the positioning of questions within each survey and the wording of questions varies. Information on physical activity and body mass were collected for the first time in 2007. The 2007 survey included a small number of questions on hypochondriasis and somatisation, whereas the 1997 survey assessed somatic disorder, neurasthenia, and the personality characteristic neuroticism (Eysenck Personality Questionnaire). Both surveys included the Kessler Psychological Distress Scale (K10). 93 As information on medications, social networks, caregiving, sexual orientation, homelessness and incarceration was collected for the first time in 2007 there are no data from the 1997 survey for comparison. 94 Standardisation is a technique used when comparing estimates for populations which have different structures. The 1997 SMHWB publication included data that had been age standardised. This technique was not administered in 2007, as age standardisation is no longer considered appropriate where there is a complex relationship between the variable of interest and age for the comparison populations. 95 A list of the differences between the data items collected in the two surveys is provided in Appendix 2. Further detailed information will be available in the National Survey of Mental Health and Wellbeing: Users' Guide (cat. no. 4327.0), planned for release on the ABS website in late 2008.
CLAS S I F I CA TI ON S
96 Country of birth data were classified according to the STANDARD AUSTRALIAN CLASSIFICATION OF COUNTRIES (SACC), 1998 (cat. no. 1269.0). 97 Educational attainment data were classified according to AUSTRALIAN STANDARD CLASSIFICATION OF EDUCATION (ASCED), 2001 (cat. no. 1272.0). 98 Geography data were classified according to the AUSTRALIAN STANDARD GEOGRAPHICAL CLASSIFICATION (ASGC), JULY 2007 (cat. no. 1216.0). 99 Languages spoken were coded utilising the AUSTRALIAN STANDARD CLASSIFICATION OF LANGUAGES (ASCL), 2005–06 (cat. no. 1267.0). 100 Industry data were classified to the AUSTRALIAN AND NEW ZEALAND STANDARD INDUSTRIAL CLASSIFICATION (ANZSIC), 2006 (cat. no. 1292.0). 101 Occupation data were classified to the AUSTRALIAN AND NEW ZEALAND STANDARD CLASSIFICATION OF OCCUPATIONS (ANZSCO), FIRST EDITION, 2006 (cat. no. 1220.0). 102 Pharmaceutical medications reported by respondents were classified by generic type. The classification used was developed by the ABS for the National Health Survey and is based on the World Health Organization's (WHO) ANATOMICAL THERAPEUTIC CHEMICAL CLASSIFICATION and the framework underlying the listing of medications in the AUSTRALIAN MEDICINES HANDBOOK.
ABS • NAT I O N A L SUR V E Y OF MEN T A L HEA L T H AND WEL L B E I N G : SUMMA R Y OF RESU L T S • 432 6 . 0 • 200 7
63
E X P L A N A T O R Y N O T E S continued
PROD UCT S AND SERVICES
103 For users who wish to undertake more detailed analysis of the survey data, two confidentialised unit record files (CURFs) are expected to be available in early 2009. A Basic CURF will be available on CD–ROM, while an Expanded CURF (containing more detailed information than the Basic CURF) will be accessible through the ABS Remote Access Data Laboratory (RADL) system. Further information about these files, including how they can be obtained, and conditions of use, will be available on the ABS website . 104 !
!
!
Summary of the products to be released: National Survey of Mental Health and Wellbeing: Users’ Guide, 2007 (cat. no. 4327.0) Microdata: National Survey of Mental Health and Wellbeing, Basic and Expanded Confidentialised Unit Record Files, 2007 (cat. no. 4326.0.30.001) Technical Manual: National Survey of Mental Health and Wellbeing, Confidentialised Unit Record Files (cat. no. 4329.0)
105 Special tabulations are available on request. Subject to confidentiality and sampling variability constraints, tabulations can be produced from the survey to meet individual requirements. These can be provided in electronic or printed form. A list of data items from this survey will be available in the National Survey of Mental Health and Wellbeing: Users' Guide (cat. no. 4327.0) planned for release on the ABS website in late 2008. 106 Further information about the survey and associated products can also be obtained through the National Information and Referral Service, whose contact details are listed at the end of this publication. ACKN OWL E D G M E N T S
107 ABS publications draw extensively on information provided freely by individuals, businesses, governments and other organisations. Their continued cooperation is very much appreciated: without it, the wide range of statistics published by the ABS would not be available. Information received by the ABS is treated in strict confidence as required by the Census and Statistics Act 1905. 108 The ABS would like to acknowledge the extensive support provided by Dr Tim Slade and Ms Amy Johnston from the University of New South Wales, whose expertise in this subject matter area greatly assisted in the development and dissemination of this survey.
REL A T E D PUB L I C A T I O N S
64
109 Current publications and other products released by the ABS are available on the ABS website . ABS publications which may be of interest are: ! Mental Health in Australia: A snapshot, 2004–05 (cat. no. 4824.0.55.001) ! Health of Children in Australia: A snapshot, 2004–05 (cat. no. 4829.0.55.001) ! National Health Survey, Summary of Results, Australia, 2004–05 (cat. no. 4364.0) ! National Health Survey, Users' Guide – Electronic Publication, 2004–05 (cat. no. 4363.0.55.001) ! Information paper: National Health Survey – Confidentialised Unit Record Files, 2004–05 (cat. no. 4324.0) ! Private Health Insurance: A snapshot, 2004–05 (cat. no. 4815.0.55.001) ! Overweight and Obesity in Adults, Australia, 2004–05 (cat. no. 4719.0) ! Health Risk Factors, Australia, 2001 (cat. no. 4812.0) ! National Health Survey: Mental Health, Australia, 2001 (cat. no. 4811.0) ! National Health Survey: Injuries, Australia, 2001 (cat. no. 4384.0) ! Work-Related Injuries, Australia, 2005–06 (cat. no. 6324.0)
ABS • NAT I O N A L SUR V E Y OF MEN T A L HEA L T H AND WEL L B E I N G : SUMMA R Y OF RESU L T S • 432 6 . 0 • 200 7
AP P E N D I X 1 ICD– 1 0 DIAG N O S E S
OVER V I E W
This Appendix presents descriptions of the diagnostic algorithms devised for the World Mental Health Survey Initiative version of the World Health Organization's Composite International Diagnostic Interview, version 3.0 (WMH–CIDI 3.0). Diagnostic algorithms are specified in accordance with the DIAGNOSTIC AND STATISTICAL MANUAL OF MENTAL DISORDERS, FOURTH EDITION (DSM–IV) and the WHO INTERNATIONAL CLASSIFICATION OF DISEASES, TENTH REVISION (ICD–10) classification systems. As not all modules contained in the WMH–CIDI 3.0 were operationalised for the 2007 SMWHB, it was necessary to tailor the diagnostic algorithms to fit the Australian context. Throughout this publication, mental disorder diagnosis is presented according to the ICD–10 criteria. Detailed information on the diagnosis of mental disorders according to the DSM–IV criteria will be available in the National Survey of Mental Health and Wellbeing, Users' Guide, 2007 (cat. no. 4327.0) planned for release on the ABS website in late 2008 .
ASSES S M E N T OF DIAG N O S T I C CRITER I A
HIER A R C H Y RULE S
Diagnostic criteria usually involve specification of the following: ! the nature, number and combination of symptoms required ! the level of distress or impairment required ! exclusion of a diagnosis due to symptoms being directly attributed to a general medical condition or substance use ! exclusion of a diagnosis where the criteria are met for a related disorder (eg Generalised Anxiety Disorder cannot be diagnosed where criteria are met for Obsessive-Compulsive Disorder). The classification system for some of the ICD–10 disorders contain diagnostic exclusion rules so that a person, despite having symptoms that meet diagnostic criteria, will not meet criteria for particular disorders because the symptoms are believed to be accounted for by the presence of another disorder. In these cases, one disorder takes precedence over another. These exclusion rules are built into the diagnostic algorithms. The developers of WMH–CIDI 3.0 established two versions of the diagnoses in the algorithms for a number of the mental disorders: a 'with hierarchy' version and a 'without hierarchy' version. The 'with hierarchy' version specifies the full diagnostic criteria consistent with the ICD–10 classification system (ie the exclusion criteria are enforced). The 'without hierarchy' version applies all diagnostic criteria except the criterion specifying the hierarchical relationship with other disorders. One example of a disorder specified with and without hierarchy is Alcohol Harmful Use. ICD–10 states that in order for diagnostic criteria for Harmful Use to be met, criteria cannot be met for Dependence on the same substance during the same time period. Therefore, the ‘with hierarchy’ version of Alcohol Harmful Use will exclude cases where Alcohol Dependence has been established for the same time period. The ‘without hierarchy’ version includes all cases of Alcohol Harmful Use regardless of coexisting Alcohol Dependence. Note that a person can meet criteria for Alcohol Dependence and the hierarchical version of Alcohol Harmful Use if there is no overlap in time between the two disorders. Throughout this publication, the ICD–10 prevalence rates are presented with the hierarchy rules applied. The comorbidity data are presented without hierarchy, so as to provide a more complete picture of the combinations of symptoms and disorders experienced by individuals. The ICD–10 disorders specified with and without hierarchy are: Generalised Anxiety Disorder; Hypomania; Mild, Moderate and Severe Depressive Episode; Dysthymia; and the Harmful Use of Alcohol, Cannabis, Sedatives, Stimulants and Opioids.
ABS • NAT I O N A L SUR V E Y OF MEN T A L HEA L T H AND WEL L B E I N G : SUMMA R Y OF RESU L T S • 432 6 . 0 • 200 7
65
A P P E N D I X 1 I C D – 1 0 D I A G N O S E S continued
MENTAL DISOR D E R S ANXIETY DISORDER S
Anxiety disorders generally involve feelings of tension, distress or nervousness. A person may avoid, or endure with dread, situations which cause these types of feelings. The disorders within this group assessed in this survey are: Panic Disorder, Agoraphobia, Social Phobia, Generalised Anxiety Disorder (GAD), Obsessive-Compulsive Disorder (OCD) and Post-Traumatic Stress Disorder (PTSD). PAN I C DIS O R D E R
A panic attack is a discrete episode of intense fear or discomfort that starts abruptly and reaches a peak within a few minutes and lasts at least some minutes. At least four symptoms must be present from the list below, one of which must be from the first four: ! pounding heart ! sweating ! trembling or shaking ! dry mouth ! difficulty breathing ! feeling of choking ! chest pain or discomfort ! nausea or abdominal distress ! dizziness or light-headed ! feelings of unreality or depersonalisation ! fear of passing out or losing control ! fear of dying, ! hot flushes or cold chills ! numbness or tingling sensations The essential feature of Panic Disorder is recurrent attacks of severe anxiety (panic), which are not restricted to any particular situation or set of circumstances (ie do not occur in the presence of a phobia, or in situations of danger) and are therefore unpredictable. AGO R A P H O B I A
Characterised by marked and consistently manifest fear in, or avoidance of, at least two of the following situations: ! crowds ! public places (ie using public transport; standing in a line in a public place; being in a department store, shopping centre, or supermarket; being in a movie theatre auditorium, lecture hall, or church; being in a restaurant or any other public place) ! travelling alone (ie travelling alone or being alone away from home) ! travelling away from home At least two of the following anxiety symptoms must have been present together with the feared situation and one of these symptoms must be from the first four listed: ! pounding heart ! sweating ! trembling or shaking ! dry mouth ! difficulty breathing ! feeling of choking ! chest pain or discomfort ! nausea or abdominal distress ! feeling dizzy or light-headed ! feelings of unreality or depersonalisation ! fear of passing out, or losing control ! fear of dying, ! hot flushes or cold chills
66
ABS • NAT I O N A L SUR V E Y OF MEN T A L HEA L T H AND WEL L B E I N G : SUMMA R Y OF RESU L T S • 432 6 . 0 • 200 7
A P P E N D I X 1 I C D – 1 0 D I A G N O S E S continued
ANXIETY DISORDER S continued
!
numbness or tingling sensations
The person also experiences significant emotional distress due to the avoidance or the anxiety symptoms and recognises that these are excessive or unreasonable. SOCI A L PHOB I A
Characterised by fear and/or avoidance of one or more social or performance situations such as: ! meeting new people ! talking to people in authority ! speaking up in a meeting or class ! going to social gatherings ! performing in front of an audience ! taking an important exam ! working while someone watches ! entering a room when others are present ! talking with people who they don't know very well ! disagreeing with people ! writing or eating or drinking while someone watches ! using a public bathroom ! dating ! social or performance situation The presence of Social Phobia is also characterised by: ! The fear of either being the focus of attention or of behaving in a way that will be embarrassing or humiliating; or the avoidance of either being the focus of attention, or of situations where there is fear of behaving in an embarrassing or humiliating way. ! At least two anxiety symptoms (from the list in Agoraphobia above) must be present in the feared situation at some time since the onset of the disorder, together with at least one of the following: blushing or shaking; nausea or fear of vomiting; or the urgency or fear of losing control of bowels or bladder. ! Significant distress caused by the symptoms or by the avoidance and the person recognises that these are excessive or unreasonable. GEN E R A L I S E D ANX I E T Y DIS O R D E R
Characterised by a period of at least six months with tension, worry and apprehension about everyday events and problems. The disorder is not due to a physical disorder or substance use. At least four of the following symptoms must be present, with at least one of the first four: ! pounding heart ! sweating ! trembling or shaking ! dry mouth ! difficulty breathing ! feeling of choking ! chest pain ! nausea, stomach pain or discomfort ! dizziness ! feelings of unreality or depersonalisation ! fear of losing control or passing out ! fear of dying ! hot flushes or cold chills ! numbness or tingling sensations ! muscle tension or aches and pains
ABS • NAT I O N A L SUR V E Y OF MEN T A L HEA L T H AND WEL L B E I N G : SUMMA R Y OF RESU L T S • 432 6 . 0 • 200 7
67
A P P E N D I X 1 I C D – 1 0 D I A G N O S E S continued
ANXIETY DISORDER S continued
! ! ! ! ! ! !
restlessness feeling on edge a sensation of a lump in the throat exaggerated response to minor surprises difficulty concentrating irritability trouble in getting to sleep because of worry
Hierarchy rules have been applied to Generalised Anxiety Disorder. To meet criteria for the 'with hierarchy' version: - the Generalised Anxiety Disorder does not occur exclusively within the duration of Panic Disorder; and - the Generalised Anxiety Disorder is not exclusively associated with social and performance situations (ie Social Phobia); and - the Generalised Anxiety Disorder does not occur exclusively within the duration of (and is not exclusively associated with) obsessions and compulsions (ie Obsessive-Compulsive Disorder). The original exclusion rules from the ICD–10 also consider the presence of other phobic disorders and hypochondriacal disorder. As the 2007 SMHWB did not collect information for Specific Phobia or Hypochondriacal Disorder, the Generalised Anxiety Disorder prevalence may include some persons with these disorders. OBS E S S I V E - C O M P U L S I V E DIS O R D E R
Either obsessions or compulsions (or both) are present on most days for at least two weeks. Obsessions (thoughts, ideas or images) and compulsions (acts) share the following features, all of which must be present: ! repetitive and unpleasant, and at least one obsession or compulsion is acknowledged as excessive or unreasonable; ! the person tries to resist them, and at least one obsession or compulsion that is unsuccessfully resisted must be present; and ! the person derives no pleasure from the obsessive thought or compulsive act; ! the obsessions or compulsions cause distress or interfere with the person's social or individual functioning; ! the respondent considers that the obsessions and compulsions do not occur exclusively within episodes of depression (ie this is based on self report by the respondent, not according to diagnosis made by the CIDI). POS T - T R A U M A T I C STR E S S DIS O R D E R
Characterised by symptoms experienced within six months of exposure to an extremely traumatic event which would be likely to cause pervasive distress in almost anyone. In order to be assessed for this disorder, the respondent had to have reported experiencing at least one of the following traumatic events: ! direct combat experience in a war ! a war or ongoing terror as a peacekeeper ! a war as an unarmed civilian ! living in a place with ongoing terror ! ever being a refugee ! being kidnapped or held captive ! being exposed to a toxic substance ! a life-threatening car accident ! a life threatening accident ! a fire, flood or other natural disaster ! a man-made disaster or bomb explosion ! a life-threatening illness
68
ABS • NAT I O N A L SUR V E Y OF MEN T A L HEA L T H AND WEL L B E I N G : SUMMA R Y OF RESU L T S • 432 6 . 0 • 200 7
A P P E N D I X 1 I C D – 1 0 D I A G N O S E S continued
ANXIETY DISORDER S continued
! ! ! ! ! ! ! ! ! ! ! ! ! ! ! ! !
being beaten as a child being beaten by a spouse or partner being beaten by anyone else being held up or threatened with a weapon rape sexual molestation being stalked an unexpected death at a young age of someone very close a son or daughter with a life-threatening illness or injury traumatic experience (rape) of someone very close witness serious physical fights at home as a child someone being badly injured or killed, or unexpectedly seeing a dead body doing something that accidentally led to serious injury or death of another person seriously injure, torture or kill another person on purpose witnessing atrocities any other extremely traumatic or life-threatening events any other extremely traumatic or life-threatening events including events the respondent does not wish to describe
The respondent was asked to determine which event was their worst traumatic event. To meet the criteria for this disorder, the person must report all of the following reactions to their worst traumatic event: ! The traumatic event is persistently remembered or relived (eg flashbacks, dreams, or distress when reminded of the event), or the person experiences distress when exposed to circumstances resembling or associated with the event; ! The person exhibits an actual or preferred avoidance of circumstances resembling or associated with the event, which was not present before that event; ! The person exhibits either an inability to recall some or all aspects of the trauma or two or more symptoms of increased sensitivity and arousal (difficulty in falling or staying asleep; irritability; difficulty concentrating; hypervigilance; exaggerated startle response). AFFECTIVE DISORDERS
Affective disorders involve mood disturbance, or change in affect. Most of these disorders tend to be recurrent and the onset of individual episodes can often be related to stressful events or situations. Disorders within this group include: Depressive Episode, Dysthymia and Bipolar Affective Disorder (of which Hypomania and Mania are components). HY P O M A N I A
Hypomania is characterised by elevated or irritable mood to a degree that is abnormal for the individual concerned and sustained for at least four consecutive days. It leads to some interference with daily living but to a lesser degree than Mania. At least three of the following symptoms must be present: ! increased activity or restlessness ! increased talkativeness ! distractibility ! decreased need for sleep ! increased sexual energy ! overspending or other types of reckless or irresponsible behaviour ! over-familiarity or increased sociability Hierarchy rules have been applied to Hypomania. To meet criteria for the 'with hierarchy' version, the person cannot have met criteria for an episode of Mania in their lifetime. The original exclusion rules from the ICD–10 also consider the presence of any Depressive Episodes, Cyclothymia and Anorexia Nervosa. As the 2007 SMHWB did not
ABS • NAT I O N A L SUR V E Y OF MEN T A L HEA L T H AND WEL L B E I N G : SUMMA R Y OF RESU L T S • 432 6 . 0 • 200 7
69
A P P E N D I X 1 I C D – 1 0 D I A G N O S E S continued
AFFECTIVE DISORDERS continued
collect information for Cyclothymia or Anorexia Nervosa (and the presence of Depressive Episodes was not operationalised by the diagnostic algorithm), Hypomania may include some persons with these disorders. MAN I A
Mood is elevated, expansive or irritable and definitely abnormal for the person concerned. The episode lasts for at least seven days (unless the episode is severe enough to require hospitalisation), causes severe interference with personal functioning, is not directly caused by substance use or a physical condition, and is characterised by at least three of the following (four if the mood is merely irritable): ! increased activity or restlessness ! increased talkativeness ! flight of ideas or the feeling that thoughts are racing ! loss of normal social inhibitions ! decreased need for sleep ! inflated self-esteem or grandiosity ! distractibility ! reckless behaviour ! marked sexual energy or sexual indiscretions DEP R E S S I V E EPI S O D E
A Depressive Episode lasts for at least two weeks and is characterised by the presence of a number of the following symptoms: ! depressed mood ! loss of interest in activities ! lack of energy or increased fatigue ! loss of confidence or self esteem ! feelings of self-reproach or excessive guilt ! thoughts of death or suicide, or suicide attempts ! diminished ability to concentrate, think or make decisions ! change in psychomotor activity; agitation or retardation ! sleep disturbance ! change in appetite The survey collected information to differentiate between three different types of Depressive Episode, based on the number of symptoms the person experienced: ! Severe Depressive Episode - all of the first three symptoms from the above list and additional symptoms from the remainder of the list to give a total of at least eight. ! Moderate Depressive Episode - at least two of the first three symptoms from the above list and additional symptoms from the remainder of the list to give a total of at least six. ! Mild Depressive Episode - at least two of the first three symptoms from the above list and additional symptoms from the remainder of the list to give a total of at least four. Hierarchy rules have been applied to all of the Depressive Episodes. To meet criteria for the 'with hierarchy' versions, the person cannot have met criteria for either Hypomanic or Manic episodes in their lifetime. The three types of Depressive Episode collected by the 2007 SMHWB are also mutually exclusive. A person cannot be diagnosed with Moderate Depressive Episode if the criteria for a Severe Depressive Episode have already been met and a diagnosis of a Mild Depressive Episode is considered only when the other two types of depression have been excluded. This criteria is applied regardless of whether the 'with hierarchy' or 'without hierarchy' versions of the disorder is used.
70
ABS • NAT I O N A L SUR V E Y OF MEN T A L HEA L T H AND WEL L B E I N G : SUMMA R Y OF RESU L T S • 432 6 . 0 • 200 7
A P P E N D I X 1 I C D – 1 0 D I A G N O S E S continued
AFFECTIVE DISORDERS
DYS T H Y M I A
continued
A disorder characterised by at least two years of constant (or constantly recurring) chronic depressed mood, where intervening periods of normal mood rarely last for longer than a few weeks. During some of the periods of depression at least three of the following are present: ! reduced energy or activity ! insomnia ! loss of self-confidence or feeling inadequate ! difficulty in concentrating ! frequent tearfulness ! loss of interest in or enjoyment of sex and other pleasurable activities ! feeling of hopelessness or despair ! feeling unable to cope with everyday responsibilities ! pessimism about the future or brooding over the past ! social withdrawal ! reduced talkativeness Hierarchy rules have been applied to Dysthymia. To meet criteria for the 'with hierarchy' version: ! the person must not have met criteria for either Hypomanic or Manic episodes in their lifetime; and ! there must be no episodes of Severe or Moderate Depression identified within the first two years of Dysthymia. BIP O L A R AFF E C T I V E DIS O R D E R
Characterised by episodes of Mania or Hypomania either alone or in conjunction with Depressive Episodes. For this survey, a diagnosis of Bipolar Affective Disorder was given if the person met criteria for Mania or Hypomania and had experienced one episode of mood disturbance (Mania, Hypomania or Depression). The survey does not allow differentiation according to the type of the current episode. SUBSTANCE USE DISORDERS
Substance Use Disorders involve the Harmful Use and/or Dependence on alcohol and/or drugs. The misuse of drugs, defined as the use of illicit substances and the misuse of prescribed medicines, included the following drug categories: opioids, cannabinoids, sedatives, and stimulants.
Alcohol Use Disorder s
Detailed questions about alcohol use were only asked if the person had at least 12 alcoholic drinks in the 12 months prior to interview. ALC O H O L HAR M F U L US E
There is clear evidence that the use of alcohol was responsible for (or substantially contributed to) physical or psychological harm, including impaired judgement or dysfunctional behaviour which may lead to disability or have adverse consequences for interpersonal relationships. The nature of the harm should be clearly identifiable by including at least one of the following: ! frequent interference with work or other responsibilities ! causing arguments or other serious problems with family, friends, neighbours or co-workers ! jeopardising safety because of alcohol use ! being arrested or stopped by police for drunk driving or drunk behaviour. Hierarchy rules have been applied to Alcohol Harmful Use. To meet criteria for the 'with hierarchy' version, a person cannot have met a diagnosis of Alcohol Dependence during the same time period (ie the duration of the two disorders must not overlap).
ABS • NAT I O N A L SUR V E Y OF MEN T A L HEA L T H AND WEL L B E I N G : SUMMA R Y OF RESU L T S • 432 6 . 0 • 200 7
71
A P P E N D I X 1 I C D – 1 0 D I A G N O S E S continued
Alcohol Use Disorder s
ALC O H O L DEP E N D E N C E SYN D R O M E
continued
A maladaptive pattern of behaviour in which the use of alcohol takes on a much higher priority for a person than other behaviours that once had greater value. The central characteristic is the strong, sometimes overpowering, desire to consume alcohol despite significant alcohol-related problems. A diagnosis was achieved if three or more of the following occurred within the same year: ! strong desire or compulsion to consume alcohol ! difficulties in controlling alcohol consumption behaviour ! withdrawal symptoms (eg fatigue, headaches, diarrhoea, the shakes or emotional problems) ! tolerance to alcohol (eg needing to drink a larger amount for the same effect) ! neglect of alternative interests because of alcohol use ! continued use despite knowing it is causing significant problems.
Drug Use Disorde rs
Assessment for Harmful Use and Dependence was only conducted if use of an illicit drug or misuse of a prescription medication occurred more than five times in the respondents' lifetime. A general assessment was made for Harmful Use and Dependence of any drugs as well as separate assessments of Harmful Use and Dependence for four specific categories of drug categories: opioids (eg heroin, methadone, opium); cannabiniods (eg marijuana, hashish); sedatives (eg barbiturates, librium, serepax, sleeping pills, valium); and stimulants (eg amphetamines, dexedrine, speed). OTH E R SUB S T A N C E HAR M F U L USE
This survey collected information on: ! Harmful Use—opioids ! Harmful Use—cannabinoids ! Harmful Use—sedatives ! Harmful Use—stimulants There is clear evidence that the use of opioids/cannabinoids/sedatives/stimulants were responsible for (or substantially contributed to) physical or psychological harm, including impaired judgement or dysfunctional behaviour which may lead to disability or have adverse consequences for interpersonal relationships. The nature of the harm should be clearly identifiable by including at least one of the following: ! frequent interference with work or other responsibilities ! causing arguments or other serious problems with family, friends, neighbours or co-workers ! jeopardising safety because of substance use ! being arrested or stopped by police for driving while intoxicated or other behaviour while intoxicated. Hierarchy rules have been applied to Other Substance Harmful Use. To meet criteria for the 'with hierarchy' versions, a person cannot have met a diagnosis of Dependence on the same substance during the same time period (ie the duration of the two disorders must not overlap). OTHE R SUB S T A N C E DEP E N D E N C E SYN D R O M E
This survey collected information on: ! Dependence Syndrome—opioids ! Dependence Syndrome—cannabinoids ! Dependence Syndrome—sedatives ! Dependence Syndrome—stimulants Opioids/cannabinoids/sedatives/stimulants Dependence Syndrome is a maladaptive pattern of substance use in which the use of the substance takes on a much higher
72
ABS • NAT I O N A L SUR V E Y OF MEN T A L HEA L T H AND WEL L B E I N G : SUMMA R Y OF RESU L T S • 432 6 . 0 • 200 7
A P P E N D I X 1 I C D – 1 0 D I A G N O S E S continued
Drug Use Disorde rs continued
priority for a person than other behaviours that once had greater value. The central characteristic is the strong, sometimes overpowering, desire to take the substance despite significant substance-related problems. Diagnoses were achieved if three or more of the following occurred in the 12 months prior to interview: ! strong desire or compulsion to take the substance ! difficulties in controlling substance-taking behaviour ! withdrawal symptoms (eg fatigue, headaches, diarrhoea, the shakes or emotional problems) ! tolerance to the drug (eg needing to use a larger amount for the same effect) ! neglect of alternative interests because of substance use ! continued use despite knowing it is causing significant problems.
ABS • NAT I O N A L SUR V E Y OF MEN T A L HEA L T H AND WEL L B E I N G : SUMMA R Y OF RESU L T S • 432 6 . 0 • 200 7
73
AP P E N D I X 2 COMP A R I S O N BETW E E N 1997 AND 2007
1997 SMHWB
2007 SMHWB
DIAG N O S I S OF MEN T A L DISO R D E R The 1997 survey instrument (CIDI Version 2.1) operationalised two major mental disorder classification systems: the Diagnostic and Statistical Manual of Mental Disorders, Fourth Edition (DSM–IV); and the WHO International Classification of Diseases, Tenth Revision (ICD–10).
The 2007 survey instrument (CIDI Version 3.0) operationalised two major mental disorder classification systems: the Diagnostic and Statistical Manual of Mental Disorders, Fourth Edition (DSM–IV); and the WHO International Classification of Diseases, Tenth Revision (ICD–10).
Some information about the diagnosis of mental disorders for the 2007 survey, according to the ICD–10 classification, is contained in Appendix 1. For more detailed information on diagnosis of mental disorders for the 1997 survey see National Survey of Mental Health and Wellbeing of Adults, Users' Guide, 1997 (cat. no. 4327.0).
For more detailed information on diagnosis of mental disorders for the 2007 survey see the National Survey of Mental Health and Wellbeing, Users' Guide, 2007 (cat. no. 4327.0).
No separate screener. Screener questions were asked at the start of each module.
This new module consists of diagnostic screening questions for the majority of disorders assessed in the survey (Depression, Mania, Panic Disorder, Generalised Anxiety Disorder (GAD), Social Phobia and Agoraphobia). Other disorders, such as Obsessive-Compulsive Disorder (OCD) and Post-Traumatic Stress Disorder (PTSD), are screened at the beginning of the individual module.
SCR E E N E R
MEN T A L DISO R D E R S The same mental disorders were diagnosed in both the 1997 and 2007 surveys. Between 1997 and 2007 there was a high degree of change to the survey instrument, both structurally and in terms of question wording and consequently to the specification of the diagnostic algorithms. The main differences to the 2007 survey are outlined below for each mental disorder.
ANX IE T Y DISO R D E R S Includes: Panic Disorder, Agoraphobia, Social Phobia, Generalised Anxiety Disorder (GAD), Obsessive-Compulsive Disorder (OCD) and Post-Traumatic Stress Disorder (PTSD)
PAN I C DISO R D E R Key Output Items:
Key Output Items:
–
Lifetime prevalence
12-month prevalence
12-month prevalence
–
30-day prevalence
Onset (timeframe, ie past month, 2–6 months ago)
Age at Onset (years)
Recency (timeframe, ie past month, 2–6 months ago)
Age at Recency (years)
Duration (years)
Persistence (years) Key Differences: The symptom-related criteria to determine the presence of panic attacks was assessed using two extra questions in 2007. The criteria for the "recurrent" and "unexpected" nature of those attacks, which is essential for a diagnosis of Panic Disorder, was assessed using a different combination of questions in 1997. In addition, the exclusion of a diagnosis of Panic Disorder due to co-occurring Affective disorders was not applied in 2007.
OVER V I E W
74
This Appendix presents a broad comparison between data items collected in the 1997 and 2007 surveys. Although many data items appear to be the same, there are a number of conceptual and operational differences between the two surveys (see Explanatory Notes paragraphs 85–95). The survey instruments used for the 1997 and 2007 SMHWB differ in content and structure. One major difference is the time-frame selected for assessment of diagnostic criteria.
ABS • NAT I O N A L SUR V E Y OF MEN T A L HEA L T H AND WEL L B E I N G : SUMMA R Y OF RESU L T S • 432 6 . 0 • 200 7
A P P E N D I X 2 C O M P A R I S O N B E T W E E N 1 9 9 7 A N D 2 0 0 7 continued
In 1997 the ABS conducted the National Survey of Mental Health and Wellbeing of Adults. The survey provided information on the prevalence of selected 12-month mental disorders, the level of disability associated with those disorders, health services used, and perceived need for help with a mental health problem for Australians aged 18 years and over. A key aim of the 1997 survey was to provide prevalence estimates for mental disorders in a 12 month time-frame. Therefore, diagnostic criteria were assessed solely on respondents' experiences in the 12 months prior to the survey interview. The 2007 National Survey of Mental Health and Wellbeing was designed to provide lifetime prevalence estimates for mental disorders. Respondents aged 16–85 years were asked about experiences throughout their lifetime. In the 2007 survey, 12-month diagnoses were derived based on lifetime diagnosis and the presence of symptoms of that disorder in the 12 months prior to the survey interview. The full diagnostic criteria were not assessed within the 12 month time-frame. Due to the differences described above and throughout this Appendix, 1997 data are not presented in this publication. Users should exercise caution when comparing data from the two surveys. A list of the broad differences between the two surveys is also provided below. More detailed information will be available in the National Survey of Mental Health and Wellbeing: Users' Guide, 2007 (cat. no. 4327.0), planned for release on the ABS website in late 2008.
ABS • NAT I O N A L SUR V E Y OF MEN T A L HEA L T H AND WEL L B E I N G : SUMMA R Y OF RESU L T S • 432 6 . 0 • 200 7
75
A P P E N D I X 2 C O M P A R I S O N B E T W E E N 1 9 9 7 A N D 2 0 0 7 continued
1997 SMHWB
2007 SMHWB
COLLE C T I O N MET HO D O L O G Y The diagnostic component of the interview was administered through a computer-assisted interview (CAI) version 2.1 of the Composite International Diagnostic Interview (CIDI).
The diagnostic component of the interview was administered through a computer-assisted interview (CAI) using the World Mental Health Survey Initiative version of the World Health Organization's Composite International Diagnostic Interview, version 3.0 (WMH–CIDI 3.0)
SCO P E Persons aged 18 years and over
Persons aged 16–85 years
Usual residents of private dwellings in urban and rural areas across Australia.
Usual residents of private dwellings in urban and rural areas of Australia.
SAMPL E DESIG N / S I Z E One randomly selected person per household
One randomly selected person per household
Final sample = 10,641
Final sample = 8,841
Response rate = 78%
Response rate = 60%
ENU ME R A T I O N PERI O D May – August 1997
August – December 2007
MAIN OUTP U T UNIT S Persons
Persons
Household
Household
Mental health condition
Mental health condition
Service use
Service use
HOUSE H O L D CHAR AC T E R I S T I C S Topics covered in the survey instrument include the following:
Topics covered in the survey instrument include the following:
Household details
Household details
Household demographic characteristics
Household demographic characteristics
Tenure type
Tenure type
Geography
Geography
–
Household income
–
Financial stress
DEMO G R A P H I C AND OTH E R CHAR A C T E R I S T I C S
76
Sex
Sex
Age (18 years and over)
Age (16–85 years)
Country of birth
Country of birth
Year of arrival
Year of arrival
Marital status (combined social and registered)
Registered marital status
Number of times married
Social marital status
Number of children
Sexual orientation
Age when child/ren born (only/oldest/youngest)
Country of birth of mother and father
Language usually spoken at home
Proficiency in spoken English
–
Whether ever served in the Australian Defence Forces
–
Whether ever received Department of Veterans' Affairs benefit
–
Whether ever been homeless
–
Whether ever been incarcerated
ABS • NAT I O N A L SUR V E Y OF MEN T A L HEA L T H AND WEL L B E I N G : SUMMA R Y OF RESU L T S • 432 6 . 0 • 200 7
A P P E N D I X 2 C O M P A R I S O N B E T W E E N 1 9 9 7 A N D 2 0 0 7 continued
1997 SMHWB
2007 SMHWB
EDUC A T I O N Whether attending school
Whether attending school
Whether completed secondary school
Highest year of school completed
Whether completed qualifications since leaving school
Whether has a non-school qualification
Highest qualification
Level of highest non-school qualification
Whether currently studying
Main field of highest non-school qualification Highest level of post-school educational attainment Whether currently studying full-time or part-time
Data items were classified on the ABS Classification of Qualifications (ABSCQ).
Data items have changed since 1997 as a result of a change in the standard classification of education attainment. In 2001 the Australian Standard Classification of Education (ASCED) replaced the ABSCQ as the national standard classification.
EMPL O Y M E N T Labour force status
Labour force status
Occupation (main job)
Occupation (main job)
Hours usually worked each week (all jobs)
Hours usually worked each week (all jobs)
–
Industry (main job)
Duration of unemployment
–
Multiple job holders
– A redesign of the Labour Force Survey in 2001 saw a change of classification for persons who were unemployed or not in the labour force.
Occupation (main job) was classified by the Australian Standard Classification of Occupations (ASCO), First edition, 1986.
Occupation (main job) was classified by the Australian and New Zealand Standard Classification of Occupations (ANZSCO), First edition, 2006. Industry (main job) was classified by the Australian and New Zealand Standard Industrial Classification (ANZSIC), 2006.
PERSO N A L INCOM E Sources of income
Sources of income*
Main source of income
Main source of income*
–
Personal gross weekly cash income
–
Type of government pension/allowance received *Data items had Workers' compensation as a new response category
ABS • NAT I O N A L SUR V E Y OF MEN T A L HEA L T H AND WEL L B E I N G : SUMMA R Y OF RESU L T S • 432 6 . 0 • 200 7
77
A P P E N D I X 2 C O M P A R I S O N B E T W E E N 1 9 9 7 A N D 2 0 0 7 continued
1997 SMHWB
2007 SMHWB
AGOR A P H O B I A Key Output Items:
Key Output Items:
–
Lifetime prevalence
12-month prevalence
12-month prevalence
–
30-day prevalence
Onset (timeframe, ie past month, 2–6 months ago)
Age at Onset (years)
Recency (timeframe, ie past month, 2–6 months ago)
Age at Recency (years)
Duration (years)
Persistence (years) Key Differences: The fear and/or avoidance of agoraphobic situations as defined in the ICD–10 criteria was assessed with the inclusion of seven extra situations in 2007. In addition, the exclusion of a diagnosis of Agoraphobia due to co-occurring Affective disorders or OCD was not applied in 2007.
SOCI A L PHO B I A Key Output Items:
Key Output Items:
–
Lifetime prevalence
12-month prevalence
12-month prevalence
–
30-day prevalence
Onset (timeframe, ie past month, 2–6 months ago)
Age at Onset (years)
Recency (timeframe, ie past month, 2–6 months ago)
Age at Recency (years)
Duration (years)
– Key Differences: The ICD–10 criteria that determines the presence of fear and/or avoidance of social situations is assessed by more than double the number of questions in 2007. Extra questions were also used to determine the emotional distress caused by those situations in 2007. In addition, the exclusion of a diagnosis of Social Phobia due to co-occurring Affective disorders was not applied in 2007.
GEN E R A L I S E D ANX I E T Y DISO R D E R (GAD ) Key Output Items:
Key Output Items:
–
Lifetime prevalence
12-month prevalence
12-month prevalence
–
30-day prevalence
Onset (timeframe, ie past month, 2–6 months ago)
Age at Onset (years)
Recency (timeframe, ie past month, 2–6 months ago)
Age at Recency (years)
Duration (years)
Persistence (years) Key Differences: The initial criteria to determine the presence of worry in the 2007 survey also considers the emotional distress caused by, and the amount of control over, that worry and anxiety. In addition, the exclusion of a diagnosis of GAD due to co-occurring Agoraphobia was not applied in 2007.
78
ABS • NAT I O N A L SUR V E Y OF MEN T A L HEA L T H AND WEL L B E I N G : SUMMA R Y OF RESU L T S • 432 6 . 0 • 200 7
A P P E N D I X 2 C O M P A R I S O N B E T W E E N 1 9 9 7 A N D 2 0 0 7 continued
1997 SMHWB
2007 SMHWB
OBSE S S I V E - C O M P U L S I V E DISO R D E R (OCD) Key Output Items:
Key Output Items:
–
Lifetime prevalence
12-month prevalence
12-month prevalence
–
30-day prevalence
Onset (timeframe, ie past month, 2–6 months ago)
Age at Onset (years)
Recency (timeframe, ie past month, 2–6 months ago)
Age at Recency (years)
Duration (years)
Persistence (years) Key Differences: The 1997 criteria ensured that the obsessions had to be severe enough to meet diagnosis without the presence of the compulsions (or vice versa) before an overall diagnosis of OCD could be met. The 2007 survey does not restrict the diagnosis in this manner. In addition, the exclusion of a diagnosis of OCD due to co-occurring Affective disorders was not applied in 2007.
POST - T R A U M A T I C STR E S S DISO R D E R (PT S D ) Key Output Items:
Key Output Items:
–
Lifetime prevalence
12-month prevalence
12-month prevalence
–
30-day prevalence
Onset (timeframe, ie past month, 2–6 months ago)
Age at Onset (years)
Recency (timeframe, ie past month, 2–6 months ago)
Age at Recency (years)
Duration (years)
Persistence (years) Key Differences: A key feature of the ICD–10 diagnosis for PTSD is that a person has experienced an event that is exceptionally threatening or catastrophic. An additional eighteen specific experiences were considered in the 2007 diagnosis, some of which were explicitly excluded in the 1997 diagnosis of PTSD. Criteria in 2007 also considered the distress caused by reactions to the event.
ABS • NAT I O N A L SUR V E Y OF MEN T A L HEA L T H AND WEL L B E I N G : SUMMA R Y OF RESU L T S • 432 6 . 0 • 200 7
79
A P P E N D I X 2 C O M P A R I S O N B E T W E E N 1 9 9 7 A N D 2 0 0 7 continued
1997 SMHWB
2007 SMHWB
AFFE C T I V E DISO R D E R S Includes: Depressive Episode, Dysthymia and Bipolar Affective Disorder (of which Hypomania and Mania are components).
HYPOMAN I A Key Output Items:
Key Output Items:
–
Lifetime prevalence
12-month prevalence
12-month prevalence
–
30-day prevalence
Onset (timeframe, ie past month, 2–6 months ago)
Age at Onset (years)
Recency (timeframe, ie past month, 2–6 months ago)
Age at Recency (years)
Duration (years)
Persistence (years) Key Differences: One of the criteria assesses the level of interference in daily living caused by the hypomanic episodes. This interference is explicitly defined by eight questions in the 2007 survey, but is only implied by two questions in 1997. In addition, the hierarchy rules applied in 1997 excluded a diagnosis of Hypomania where a co-occurring diagnosis was met for Mania, Bipolar Affective Disorder, Mild Depressive Episode or Moderate Depressive Episode. The 2007 survey excludes only where the diagnosis for Mania was met. Note: an error was detected in the 1997 CAI instrument whereby not all cases of Hypomania were coded correctly. It is likely that published data underestimates the prevalence of this disorder as a result. See National Survey of Mental Health and Wellbeing of Adults, Users' Guide, 1997 (cat. no. 4327.0) for further information.
MAN I A Key Output Items:
Key Output Items:
–
Lifetime prevalence
12-month prevalence
12-month prevalence
–
30-day prevalence
Onset (timeframe, ie past month, 2–6 months ago)
Age at Onset (years)
Recency (timeframe, ie past month, 2–6 months ago)
Age at Recency (years)
Duration (years)
Persistence (years) Key Differences: One of the criteria assesses the level of interference in daily living caused by the Manic episodes. This interference is explicitly defined by eight questions in the 2007 survey, but is only implied by two questions in 1997. Note: an error was detected in the 1997 CAI instrument whereby not all cases of Mania were coded correctly. It is likely that published data underestimates the prevalence of this disorder as a result. See National Survey of Mental Health and Wellbeing of Adults, Users' Guide, 1997 (cat. no. 4327.0) for further information.
80
ABS • NAT I O N A L SUR V E Y OF MEN T A L HEA L T H AND WEL L B E I N G : SUMMA R Y OF RESU L T S • 432 6 . 0 • 200 7
A P P E N D I X 2 C O M P A R I S O N B E T W E E N 1 9 9 7 A N D 2 0 0 7 continued
1997 SMHWB
2007 SMHWB
DEPR E S S I V E EPI S O D E Key Output Items:
Key Output Items:
Mild Depressive Episode:
Mild Depressive Episode:
–
Lifetime prevalence
12-month prevalence
12-month prevalence
–
30-day prevalence
Onset (timeframe, ie past month, 2–6 months ago)
Age at Onset (years)
Recency (timeframe, ie past month, 2–6 months ago)
Age at Recency (years)
–
Persistence (years)
Moderate Depressive Episode:
Moderate Depressive Episode:
–
Lifetime prevalence
12-month prevalence
12-month prevalence
–
30-day prevalence
Onset (timeframe, ie past month, 2–6 months ago)
Age at Onset (years)
Recency (timeframe, ie past month, 2–6 months ago)
Age at Recency (years)
–
Persistence (years)
Severe Depressive Episode:
Severe Depressive Episode:
–
Lifetime prevalence
12-month prevalence
12-month prevalence
–
30-day prevalence
Onset (timeframe, ie past month, 2–6 months ago)
Age at Onset (years)
Recency (timeframe, ie past month, 2–6 months ago)
Age at Recency (years)
–
Persistence (years) Key Differences: The assessment of symptom-related criteria for Depressive Episode differs across the two surveys because of extra symptom questions or wording changes that either restrict or broaden the concepts (eg the inclusion of "nearly every day" in 2007). In addition, the error noted above for Hypomania and Mania may have an impact on comparability as the co-occuring presence of these conditions will exclude a diagnosis of Depressive Episodes in both surveys.
DYST H Y M I A Key Output Items:
Key Output Items:
–
Lifetime prevalence
12-month prevalence
12-month prevalence
–
30-day prevalence
Onset (timeframe, ie past month, 2–6 months ago)
Age at Onset (years)
Recency (timeframe, ie past month, 2–6 months ago)
Age at Recency (years)
Duration (years)
Persistence (years) Key Differences: The criteria used to define the length of episode states that a person can have periods of normal mood within episodes of Dysthymia. In assessing this criteria, the 1997 survey explicitly refers to this concept. Questions used to assess the symptom-related criteria also use a longer timeframe in 1997. In addition, the hierarchy rules applied in 1997 excluded a diagnosis of Dysthymia where the diagnosis of Recurrent Mild Depressive Episode was also met, but in 2007 the exclusion is for co-occurring Severe or Moderate Depressive Episode.
ABS • NAT I O N A L SUR V E Y OF MEN T A L HEA L T H AND WEL L B E I N G : SUMMA R Y OF RESU L T S • 432 6 . 0 • 200 7
81
A P P E N D I X 2 C O M P A R I S O N B E T W E E N 1 9 9 7 A N D 2 0 0 7 continued
1997 SMHWB
2007 SMHWB
BIPO L A R AFFE C T I V E DISOR D E R Key Output Items:
Key Output Items:
–
Lifetime prevalence
12-month prevalence
12-month prevalence
–
30-day prevalence
Onset (timeframe, ie past month, 2–6 months ago)
Age at Onset (years)
Recency (timeframe, ie past month, 2–6 months ago)
Age at Recency (years)
Duration (years)
– Key Differences: Bipolar Affective Disorder is characterised by episodes of Mania or Hypomania either alone or in conjunction with Depressive Episodes. Refer to any differences outlined above for changes to how these Affective disorders are diagnosed. Note: an error was detected in the 1997 CAI instrument whereby not all cases of Hypomania and Mania were coded correctly. It is likely that published data underestimates the prevalence of Bipolar Affective Disorder as a result. See National Survey of Mental Health and Wellbeing of Adults, Users' Guide, 1997 (cat. no. 4327.0) for further information.
82
ABS • NAT I O N A L SUR V E Y OF MEN T A L HEA L T H AND WEL L B E I N G : SUMMA R Y OF RESU L T S • 432 6 . 0 • 200 7
A P P E N D I X 2 C O M P A R I S O N B E T W E E N 1 9 9 7 A N D 2 0 0 7 continued
1997 SMHWB
2007 SMHWB
SUBS T A N C E USE DISO R D E R S Includes: Alcohol Harmful Use, Alcohol Dependence, Other Substance Harmful Use and Other Substance Dependence.
ALCO H O L HARM F U L USE Key Output Items:
Key Output Items:
–
Lifetime prevalence
12-month prevalence
12-month prevalence
–
30-day prevalence
Onset (timeframe, ie past month, 2–6 months ago)
Age at Onset (years)
Recency (timeframe, ie past month, 2–6 months ago)
Age at Recency (years)
Duration (years)
Persistence (years) Alcohol Harmful Use in the 2007 survey addressed behavioural problems associated with the abuse of alcohol (eg drink driving or being arrested by the police for drunken behaviour) whereas the 1997 survey addressed physical and psychological harm caused by alcohol consumption (eg liver disease, depression or strange thoughts).
ALCO H O L DEPE N D E N C E Key Output Items:
Key Output Items:
–
Lifetime prevalence
12-month prevalence
12-month prevalence
–
30-day prevalence
Onset (timeframe, ie past month, 2–6 months ago)
Age at Onset (years)
Recency (timeframe, ie past month, 2–6 months ago)
Age at Recency (years)
Duration (years)
Persistence (years) One criteria in diagnosing Alcohol Dependence assesses the persistent use of alcohol despite clear evidence of harm. In the 1997 survey, this criteria is assessed by the presence of physical or psychological harm caused by alcohol (eg liver disease or depression). The 2007 survey also included social problems as a symptom of Alcohol Dependence. In addition, the assessment of withdrawal symptoms in 1997 required the presence of at least three specific symptoms (eg the shakes, sweating, nausea) but only one had to be present in 2007 for this criteria to be met.
ABS • NAT I O N A L SUR V E Y OF MEN T A L HEA L T H AND WEL L B E I N G : SUMMA R Y OF RESU L T S • 432 6 . 0 • 200 7
83
A P P E N D I X 2 C O M P A R I S O N B E T W E E N 1 9 9 7 A N D 2 0 0 7 continued
1997 SMHWB
2007 SMHWB
OTHER SUBS T A N C E HAR MF U L USE Key Output Items:
Key Output Items:
Harmful Use - Cannabinoids:
Harmful Use - Cannabinoids:
–
Lifetime prevalence
12-month prevalence
12-month prevalence
–
30-day prevalence
–
Age at Onset (years)
–
Age at Recency (years)
Duration (years)
–
Harmful Use - Stimulants:
Harmful Use - Stimulants:
–
Lifetime prevalence
12-month prevalence
12-month prevalence
–
30-day prevalence
–
Age at Onset (years)
–
Age at Recency (years)
Duration (years)
–
Harmful Use - Sedatives:
Harmful Use - Sedatives:
–
Lifetime prevalence
12-month prevalence
12-month prevalence
–
30-day prevalence
–
Age at Onset (years)
–
Age at Recency (years)
Duration (years)
–
Harmful Use - Opioids:
Harmful Use - Opioids:
–
Lifetime prevalence
12-month prevalence
12-month prevalence
–
30-day prevalence
–
Age at Onset (years)
–
Age at Recency (years)
Duration (years)
– Key Differences: Other Substance Harmful Use in the 2007 survey addressed behavioural problems associated with the misuse of drugs (eg driving under the influence of drugs or being arrested by the police for behaviour when under the influence) whereas the 1997 survey addressed physical and psychological harm caused by the misuse of drugs (eg overdose, hepatitis or depression).
84
ABS • NAT I O N A L SUR V E Y OF MEN T A L HEA L T H AND WEL L B E I N G : SUMMA R Y OF RESU L T S • 432 6 . 0 • 200 7
A P P E N D I X 2 C O M P A R I S O N B E T W E E N 1 9 9 7 A N D 2 0 0 7 continued
1997 SMHWB
2007 SMHWB
OTHE R SUBS T A N C E DEPE N D E N C E Key Output Items:
Key Output Items:
Dependence - Cannabinoids:
Dependence - Cannabinoids:
–
Lifetime prevalence
12-month prevalence
12-month prevalence
–
30-day prevalence
–
Age at Onset (years)
–
Age at Recency (years)
Duration (years)
–
Dependence - Stimulants:
Dependence - Stimulants:
–
Lifetime prevalence
12-month prevalence
12-month prevalence
–
30-day prevalence
–
Age at Onset (years)
–
Age at Recency (years)
Duration (years)
–
Dependence - Sedatives:
Dependence - Sedatives:
–
Lifetime prevalence
12-month prevalence
12-month prevalence
–
30-day prevalence
–
Age at Onset (years)
–
Age at Recency (years)
Duration (years)
–
Dependence - Opioids:
Dependence - Opioids:
–
Lifetime prevalence
12-month prevalence
12-month prevalence
–
30-day prevalence
–
Age at Onset (years)
–
Age at Recency (years)
Duration (years)
– Key Differences: One criteria in diagnosing Other Substance Dependence assesses the persistent use of drugs despite clear evidence of harm. In the 1997 survey, this criteria is assessed by the presence of physical or psychological harm caused by drug use (eg overdose, hepatitis or depression) but the 2007 survey also included social problems as a symptom of Dependence.
SUIC I D A L I T Y There were three questions about suicide in 1997, This is a more detailed section than in 1997 including items on thoughts, plans, and attempts asking about thoughts and attempts. Note that the (including method and the number of attempts). Note that the Depression module contains questions Depression module contained questions about about thoughts, plans and attempts, specifically in relation to episodes of Depression. thoughts, plans and attempts, specifically in relation to episodes of Depression.
PSYCH O S I S This module contains seven questions about psychotic experiences in the 12 months prior to the interview.
The Psychosis section in 2007 includes questions about lifetime psychotic experiences as well as in the 12 months prior to the interview.
Personality disorder (screener)
–
ABS • NAT I O N A L SUR V E Y OF MEN T A L HEA L T H AND WEL L B E I N G : SUMMA R Y OF RESU L T S • 432 6 . 0 • 200 7
85
A P P E N D I X 2 C O M P A R I S O N B E T W E E N 1 9 9 7 A N D 2 0 0 7 continued
1997 SMHWB
2007 SMHWB
MEN T A L HEAL T H AND PHY S I C A L CON D I T I O N S Medical conditions
Chronic conditions
Somatic disorders
Hypochondriasis/Somatisation
Neurasthenia
–
Disability (Brief Disability Questionnaire (BDQ))
Disability (ABS Short Disability Module)
–
Health risk factors:
Smoker status
Smoker status
–
Level of exercise
–
Body Mass Index (BMI)
Kessler Psychological Distress Scale (K10)
Kessler Psychological Distress Scale (K10) Two questions from the K10 were asked in a slightly different order for 2007 compared with 1997. There have also been slight changes to the question wording. These changes are minimal and are not expected to impact greatly on comparability. There were also four questions on anger attached to the end of the K10 scale in the 2007 survey.
FUNCT I O N I N G 30-day functioning
The respondents' perceptions of their overall health and life in the 30 days prior to interview.
Short-Form 12
World Health Organization's Disability Assessment Schedule (WHODAS)
–
(Australian) Assessment of Quality of Life (AQoL) instrument.
Days out of role
Days out of role
The number of days in the 4 weeks prior to The number of days in the 30 days prior to interview that the respondent was totally unable to work or interview that the respondent was totally unable to carry out normal activities (or had to cut down on their usual activities) because of their health. work or carry out normal activities (or had to cut down on their usual activities) because of their health.
OTHE R SCALE S AND MEASU R E S Mini mental state examination (MMSE)
Mini mental state examination (MMSE)
Asked of persons aged 65 years and over
Asked of persons aged 65–85 years
Self-assessed health rating
Self-assessed health rating
General Health Questionnaire (GHQ–12: 12 item scale)
–
Neuroticism (Eysenck Personality Questionnaire: 12 item scale)
–
Life satisfaction (Delighted-Terrible scale)
Life satisfaction (Delighted-Terrible scale).
Diagnosis which the respondent determined caused them the most trouble.
Diagnosis which the respondent determined caused them the most trouble.
MAIN PRO B L E M
86
ABS • NAT I O N A L SUR V E Y OF MEN T A L HEA L T H AND WEL L B E I N G : SUMMA R Y OF RESU L T S • 432 6 . 0 • 200 7
A P P E N D I X 2 C O M P A R I S O N B E T W E E N 1 9 9 7 A N D 2 0 0 7 continued
1997 SMHWB
2007 SMHWB
SER VI C E USE AND PER CE I V E D HEAL T H NEED S Hospital admissions
Hospital admissions
–
Self-management strategies (eg using the internet, telephone counselling, self-help groups)
Health professional consultations (questions were asked about consultations with the following health professionals: General practitioner, radiologist, pathologist, physician or other medical specialist, surgical specialist or gynaecologist, psychiatrist, psychologist, social worker or welfare officer, drug/alcohol counsellor, other counsellor, nurse, mental health team, chemist for professional advice, ambulance officer, other).
Health professional consultations (questions were asked about consultations with the following health professionals: General practitioner, psychiatrist, psychologist, mental health nurse, other professional providing specialist mental health services, specialist doctor or surgeon, other professional providing general services, complementary/alternative therapist).
Perceived need for care
Perceived need for care
–
Medications for mental health
ABS • NAT I O N A L SUR V E Y OF MEN T A L HEA L T H AND WEL L B E I N G : SUMMA R Y OF RESU L T S • 432 6 . 0 • 200 7
87
TECH N I C A L NOTE
ESTI M A T I O N PROC E D UR E S
1 Estimates from the survey were derived using a complex estimation procedure which ensures that survey estimates conform to independent population estimates by state, part of state, age and sex.
REL I A B I L I T Y OF THE
2 Two types of error are possible in an estimate based on a sample survey: sampling error and non-sampling error. The sampling error is a measure of the variability that occurs by chance because a sample, rather than the entire population, is surveyed. Since the estimates in this publication are based on information obtained from occupants of a sample of dwellings they are subject to sampling variability; that is they may differ from the figures that would have been produced if all dwellings had been included in the survey. One measure of the likely difference is given by the standard error (SE). There are about two chances in three that a sample estimate will differ by less than one SE from the figure that would have been obtained if all dwellings had been included, and about 19 chances in 20 that the difference will be less than two SEs.
ESTI M A T E S
3 Another measure of the likely difference is the relative standard error (RSE), which is obtained by expressing the SE as a percentage of the estimate. The RSE is a useful measure in that it provides an immediate indication of the percentage errors likely to have occurred due to sampling, and thus avoids the need to refer also to the size of the estimate. RSE% =
SE estimate
% 100
4 Space does not allow for the separate presentation of the SEs and/or RSEs of all the estimates in this publication. However, RSEs for all estimates are available free-of-charge on the ABS website , released in spreadsheet format as an attachment to this publication, National Survey of Mental Health and Wellbeing: Summary of Results (cat. no. 4326.0). As a guide, the population and RSE estimates for Table 2 are presented on the following page.
88
ABS • NAT I O N A L SUR V E Y OF MEN T A L HEA L T H AND WEL L B E I N G : SUMMA R Y OF RESU L T S • 432 6 . 0 • 200 7
TECH N I C A L NOTE
continued
REL I A B I L I T Y OF THE E S T I M A T E S continued
12 - MO N T H ME N T A L DI S O R D E R S (a ) , Re l a t i v e St a n d a r d Er r o r Es t i m a t e s Males RSE %
'000
RSE %
'000
RSE %
180.5 170.5 298.9 155.2 130.6 366.3 860.7
15.6 17.4 13.4 18.1 17.6 10.6 6.7
229.8 279.9 461.0 280.9 175.0 665.7 1 442.3
10.9 9.6 7.0 11.6 11.0 6.3 3.8
410.3 450.4 759.9 436.1 305.6 1 031.9 2 303.0
9.3 8.3 6.2 10.5 10.3 5.0 3.3
Affective disorders Depressive Episode(c) Dysthymia Bipolar Affective Disorder Any Affective disorder (b)
245.0 79.7 145.3 420.1
13.7 21.4 17.3 9.8
407.4 124.0 140.3 575.8
8.2 15.9 13.2 7.1
652.4 203.8 285.6 995.9
7.2 12.0 10.8 5.5
Substance Use disorders Alcohol Harmful Use Alcohol Dependence Drug Use disorders(d) Any Substance Use disorder(b)
300.8 174.9 165.7 556.4
10.5 15.7 13.5 8.8
169.3 55.3 65.7 263.5
15.6 18.5 16.8 10.7
470.1 230.2 231.4 819.8
8.2 12.2 10.0 6.5
1 400.1 6 549.7 7 949.8
5.5 1.2 —
1 797.7 6 267.8 8 065.5
2.9 3 197.8 0.8 12 817.5 — 16 015.3
2.7 0.7 —
Any 12-month mental disorder(a)(b ) No 12-month mental disorder(e) Total persons aged 16–85 years
(b) (c) (d) (e)
Persons
'000
Any 12-month mental disorder Anxiety disorders Panic Disorder Agoraphobia Social Phobia Generalised Anxiety Disorder Obsessive-Compulsive Disorder Post-Traumatic Stress Disorder Any Anxiety disorder(b)
— (a)
Females
nil or rounded to zero (including null cells) Persons who met criteria for diagnosis of a lifetime mental disorder (with hierarchy) and had symptoms in the 12 months prior to interview. See paragraphs 30–31 of Explanatory Notes. A person may have had more than one 12-month mental disorder. The components when added may therefore not add to the total shown. Includes Severe Depressive Episode, Moderate Depressive Episode, and Mild Depressive Episode. Includes Harmful Use and Dependence. Persons who did not meet criteria for diagnosis of a lifetime mental disorder and those who met criteria for diagnosis of a lifetime mental disorder (with hierarchy) but did not have symptoms in the 12 months prior to interview. See paragraphs 30–31 of Explanatory Notes.
5 The smaller the estimate the higher is the RSE. Very small estimates are subject to such high SEs (relative to the size of the estimate) as to detract seriously from their value for most reasonable uses. In the tables in this publication, only estimates with RSEs less than 25% are considered sufficiently reliable for most purposes. However, estimates with larger RSEs, between 25% and less than 50% have been included and are preceded by an asterisk (eg *3.4) to indicate they are subject to high SEs and should be used with caution. Estimates with RSEs of 50% or more are preceded with a double asterisk (eg **0.6). Such estimates are considered unreliable for most purposes. 6 The imprecision due to sampling variability, which is measured by the SE, should not be confused with inaccuracies that may occur because of imperfections in reporting by interviewers and respondents and errors made in coding and processing of data. Inaccuracies of this kind are referred to as the non-sampling error, and they may occur in any enumeration, whether it be in a full count or only a sample. In practice, the potential for non-sampling error adds to the uncertainty of the estimates caused by sampling variability. However, it is not possible to quantify the non-sampling error.
ABS • NAT I O N A L SUR V E Y OF MEN T A L HEA L T H AND WEL L B E I N G : SUMMA R Y OF RESU L T S • 432 6 . 0 • 200 7
89
TECH N I C A L NOTE
STAN D A R D ERRO R S OF PRO P O R T I O N S AND PERCEN T A G E S
continued
7 Proportions and percentages formed from the ratio of two estimates are also subject to sampling errors. The size of the error depends on the accuracy of both the numerator and the denominator. For proportions where the denominator is an estimate of the number of persons in a group and the numerator is the number of persons in a sub-group of the denominator group, the formula to approximate the RSE is given by: RSE(x − y ) = ([RSE(x )] 2 − [RSE(y )] 2 ) 8 From the above formula, the RSE of the estimated proportion or percentage will be lower than the RSE of the estimate of the numerator. Thus an approximation for SEs of proportions or percentages may be derived by neglecting the RSE of the denominator, ie by obtaining the RSE of the number of persons corresponding to the numerator of the proportion or percentage and then applying this figure to the estimated proportion or percentage.
COMP A R I S O N OF ESTI M A T ES
9 Published estimates may also be used to calculate the difference between two survey estimates. Such an estimate is subject to sampling error. The sampling error of the difference between two estimates depends on their SEs and the relationship (correlation) between them. An approximate SE of the difference between two estimates (x–y) may be calculated by the following formula: SE(x − y ) = ([SE(x )] 2 + [SE(y )] 2 ) 10 While the above formula will be exact only for differences between separate and uncorrelated (unrelated) characteristics of sub-populations, it is expected that it will provide a reasonable approximation for all differences likely to be of interest in this publication.
SIGN I F I C A N C E TEST I N G
11 For comparing estimates between surveys or between populations within a survey it is useful to determine whether apparent differences are 'real' differences between the corresponding population characteristics or simply the product of differences between the survey samples. One way to examine this is to determine whether the difference between the estimates is statistically significant. This is done by calculating the standard error of the difference between two estimates (x and y) and using that to calculate the test statistic using the formula below:
x−y SE(x − y ) 12 The imprecision due to sampling variability, which is measured by the SE, should not be confused with inaccuracies that may occur because of imperfections in reporting by respondents and recording by interviewers, and errors made in coding and processing data. Inaccuracies of this kind are referred to as non-sampling error, and they occur in any enumeration, whether it be a full count or sample. Every effort is made to reduce non-sampling error to a minimum by careful design of questionnaires, intensive training and supervision of interviewers, and efficient operating procedures.
90
ABS • NAT I O N A L SUR V E Y OF MEN T A L HEA L T H AND WEL L B E I N G : SUMMA R Y OF RESU L T S • 432 6 . 0 • 200 7
GLOSS A R Y
Affective (mood) disorders Agoraphobia
Alcohol consumption
Anxiety disorders
Area of usual residence
Assessment of Quality of Life (AQoL) Bipolar Affective Disorder
Body Mass Index (BMI)
Caregiving
Chronic conditions Comorbidity
Composite International Diagnostic Interview (CIDI) Contact with family or friends
Disorders that involve mood disturbance. Examples include bipolar affective disorder, depressive episode and dysthymia. Fear of being in public places from which it may be difficult to escape. Includes fears of leaving home, crowds, or travelling in trains, buses or planes. A compelling desire to avoid the phobic situation is often prominent. Frequency of consumption in the 12 months prior to interview. Only persons who had at least 12 standard drinks in a year were asked about their consumption. See Standard drink. Disorders that involve feelings of tension, distress or nervousness. In this survey the following anxiety disorders were collected; Panic Disorder, Social Phobia, Agoraphobia, Generalised Anxiety Disorder (GAD), Post-Traumatic Stress Disorder (PTSD) and Obsessive-Compulsive Disorder (OCD). State capital city is the capital city Statistical Division for each State or Territory. Balance of State/Territory covers the remaining areas. For more detailed information refer to the AUSTRALIAN STANDARD GEOGRAPHICAL CLASSIFICATION (ASGC), JULY 2007 (cat. no. 1216.0). An Australian-developed quality of life instrument that is used to measure the burden of disease. Questions measure: illness, independence, social relationships, physical senses, and psychological wellbeing. Characterised by repeated episodes in which the person's mood and activity levels are significantly disturbed—on some occasions lowered (depression) and on some occasions elevated (mania or hypomania). Calculated from reported height and weight information, using the formula weight (kg) divided by the square of height (m). BMI values are grouped according to the list below which allows categories to be reported against both the World Health Organization (WHO) and the National Health and Medical Research Council (NHMRC) guidelines. ! Underweight: Less than 18.5 ! Normal weight range: 18.5 to less than 25.0 ! Overweight: 25.0 to less than 30.0 ! Obese: 30.0 and greater The provision of care to an immediate family member who has cancer, serious heart problems, serious memory problems, an intellectual disability, a physical disability, chronic illness, alcohol or drug problems, depression, anxiety, schizophrenia or psychosis, bipolar affective disorder or other serious chronic mental problems. Provision of care includes helping with washing, dressing or eating, paperwork, housework, getting around or taking medications, or keeping company and giving emotional support. A physical condition or disorder that has lasted, or is expected to last for six (6) months or more. May also be referred to as a long-term health condition or chronic disease. The occurrence of more than one mental disorder at the same time. Comorbidity may refer to the co-occurrence of mental disorders and the co-occurrence of mental disorders and physical conditions. A comprehensive modular interview which can be used to assess lifetime and 12-month prevalence of mental disorders through the measurement of symptoms and their impact on day-to-day activities. Whether in contact with any family and/or friends, and the frequency of the contact. Contact includes visits, phone calls, letters, or electronic mail messages.
ABS • NAT I O N A L SUR V E Y OF MEN T A L HEA L T H AND WEL L B E I N G : SUMMA R Y OF RESU L T S • 432 6 . 0 • 200 7
91
G L O S S A R Y continued Country of birth
The classification of countries is the Standard Australian Classification of Countries (SACC). For more detailed information refer to the STANDARD AUSTRALIAN CLASSIFICATION OF COUNTRIES (SACC), 1998 (cat. no. 1269.0).
Days out of role
The number of days in the 30 days prior to interview that a person was unable to work or carry out normal activities or had to cut down what they did because of their health.
Dependence
Depressive Episode
Disability status
A state of gloom, despondency or sadness lasting at least two weeks. The person usually suffers from low mood, loss of interest and enjoyment, and reduced energy. Their sleep, appetite and concentration may be affected. Whether has a disability, the level of core-activity limitation (none, mild, moderate, severe or profound), and whether has a schooling or employment restriction.
Diagnostic and Statistical Manual of Mental Disorders–Fourth Edition (DSM–IV)
The DSM–IV is a handbook for mental health professionals that lists different categories of mental disorders and the criteria for diagnosing them. The DSM–IV focuses on clinical, research and educational purposes, supported by an extensive empirical foundation.
Drug Use disorder
Drug Use disorder involves the harmful use and/or dependence on drugs. Drugs include the use of illicit substances and the misuse of prescribed medicines. Four drug categories have been included in this survey: ! sedatives, eg serepax, sleeping pills, valium ! stimulants, eg amphetamines, speed ! marijuana, ie hashish ! opioids, eg heroin, methadone, opium.
Dwelling
A suite of rooms contained within a building which are self-contained and intended for long-term residential use. To be self-contained, the suite of rooms must possess cooking and bathing facilities as building fixtures. Examples of types of dwelling include: separate house; semi-detached, row or terrace house or townhouse; flat, unit or apartment; and other dwellings, including caravan, cabin, houseboat, and house or flat attached to a shop.
Dysthymia
A disorder characterised by constant or constantly recurring chronic depression of mood, lasting at least two years, which is not sufficiently severe, or whose episodes are not sufficiently prolonged, to qualify as recurrent depressive disorder. The person feels tired and depressed, sleeps badly and feels inadequate, but is usually able to cope with the basic demands of everyday life.
Employed
People aged 15 years and over who had a job or business, or who undertook work without pay in a family business for a minimum of one hour per week. Includes persons who were absent from a job or business.
Employed full-time
Employed part-time Family composition of household
92
A maladaptive pattern of use in which the use of drugs or alcohol takes on a much higher priority for a person than other behaviours that once had greater value. The central characteristic is the strong, sometimes overpowering, desire to take the substance despite significant substance-related problems.
Employed persons who usually worked 35 hours a week (in all jobs) and those who, although usually working less than 35 hours a week, worked 35 hours or more during the reference week. Employed persons who usually worked less than 35 hours a week (in all jobs) and either did so during the reference week, or were not at work in the reference week. Refers to the family composition of the household to which the respondent belonged. In this publication households are categorised as lone person, couple only, couple family with child(ren), one parent family with child(ren), and other households.
ABS • NAT I O N A L SUR V E Y OF MEN T A L HEA L T H AND WEL L B E I N G : SUMMA R Y OF RESU L T S • 432 6 . 0 • 200 7
G L O S S A R Y continued Generalised Anxiety Disorder (GAD)
Government support
A disorder involving anxiety that is generalised and persistent, but not restricted to any particular environmental circumstances. It is chronic and exaggerated worry or tension, even though nothing seems to provoke it. Symptoms are variable, but include complaints of persistent nervousness, trembling, muscular tensions, sweating, light-headedness, palpitations, dizziness and epigastric discomfort. The person may also anticipate disaster or worry excessively about health, money, family or work. Cash support from the government in the form of pensions, benefits or allowances.
Harmful Use
A pattern of use of alcohol or drugs that is responsible for (or substantially contributes to) physical or psychological harm, including impaired judgement or dysfunctional behaviour.
Health risk factors
Characteristics that may increase the likelihood of injury or illness, for example level of exercise, smoking, alcohol/drug consumption etc.
Hierarchy rule
When hierarchy rules are applied, a person is excluded from a diagnosis, even though they have sufficient symptoms to meet criteria, because they have another disorder that is thought to account for those symptoms.
Homelessness
Includes sleeping in public places, homeless shelters, a tent, an abandoned building or couch surfing when a person has no other choice.
Household
A group of residents of a dwelling who share common facilities and meals or who consider themselves to be a household. It is possible for a dwelling to contain more than one household, for example, where regular provision is made for groups to take meals separately and where persons consider their households to be separate.
Household income
Derived as the sum of the reported personal cash incomes of all household members aged 15 years and over. Household incomes were then divided into quintiles; 1st quintile is the lowest income, 5th quintile is the highest income. Cases where household income could not be derived are excluded before quintiles are created.
Hypomania
Immediate family member Incarceration Index of disadvantage
A lesser degree of mania characterised by a persistent mild elevation of mood and increased activity lasting at least four consecutive days. Increased sociability, over-familiarity and a decreased need for sleep are often present, but not to the extent that they lead to severe disruption. Parents, parents-in-law, grandparents, brothers and sisters, children, aunts, uncles, nieces, nephews and spouse/partner. Time spent in gaol, prison or correctional facility. This is one of four Socio-Economic Indexes for Areas (SEIFAs) compiled by ABS following each Census of Population and Housing. The indexes are compiled from various characteristics of persons resident in particular areas. The index of disadvantage summarises attributes such as low income, low educational attainment, high unemployment and jobs in relatively unskilled occupations. For more information refer to Information Paper: An introduction to socio-economic indexes for areas (SEIFA), 2006 (cat. no. 2039.0).
Industry of main job
A group of businesses or organisations which perform similar sets of activities in terms of the production of goods and services. For more information refer to the AUSTRALIAN AND NEW ZEALAND STANDARD INDUSTRIAL CLASSIFICATION (ANZSIC), 2006 (cat. no. 1292.0).
International Classification of Diseases–Tenth Revision (ICD–10)
The ICD–10 is the tenth edition of the international standard diagnostic classification for all general epidemiological purposes, many health management purposes and in clinical use. The ICD is produced by the World Health Organization and is used in the diagnosis, study and classification of diseases.
Labour force status
Persons aged 15 years and over who were 'employed', 'unemployed' or 'not in the labour force' as defined.
ABS • NAT I O N A L SUR V E Y OF MEN T A L HEA L T H AND WEL L B E I N G : SUMMA R Y OF RESU L T S • 432 6 . 0 • 200 7
93
G L O S S A R Y continued Level of exercise
Based on frequency, intensity (ie walking, moderate exercise or vigorous exercise) and duration of exercise (for recreation, sport or fitness) in the week prior to interview. From these components, an exercise category was determined using factors to represent the intensity of the exercise. Categories were grouped according to the following levels of exercise: ! Very low: Less than 100 minutes (including no exercise) ! Low: 100 minutes to less than 1,600 minutes ! Moderate: 1,600–3,200 minutes, or more than 3,200 minutes, but less than 2 hours of vigorous exercise ! High: More than 3,200 minutes including 2 hours or more of vigorous exercise.
Level of highest non-school qualification
The highest level of educational attainment. For more information refer to the AUSTRALIAN STANDARD CLASSIFICATION OF EDUCATION (ASCED), 2001 (cat. no. 1272.0).
Main source of personal income Mania
A disorder in which mood is happy, elevated, expansive or irritable out of keeping with the person's circumstances lasting at least seven days and leading to severe disruption with daily living. The person may exhibit hyperactivity, inflated self-esteem, distractibility and over-familiar or reckless behaviour.
Marital status
Based on registered marriage status with the inclusion of de facto relationship. See also Registered marital status and Social marital status.
Mental disorder
According to the ICD–10 Classification of Mental and Behavioural Disorders, a disorder implies 'the existence of a clinically recognisable set of symptoms or behaviour associated in most cases with distress and with interference with personal functions' (WHO 1992, p5). Most diagnoses require criteria relating to severity and duration to be met.
Mental health problem Misuse of drugs
Problems with mental health, such as stress, worry or sadness; regardless of whether they met criteria for mental disorders. Misuse of drugs in the 12 months prior to interview. Refers to the use of illicit drugs and/or the misuse of prescription drugs. People must have misused the same drug more than five times in their lifetime.
Not in the labour force
People who were not in the categories 'employed' or 'unemployed' as defined.
Obsessive-Compulsive Disorder
Characterised by obsessions (recurrent thoughts, ideas or images), compulsions (repetitive acts) or both, which cause distress or interfere with the person's normal functioning.
Occupation of main job
94
Includes employee cash income, unincorporated cash income, government cash pensions or allowances, property cash income, superannuation/annuities, transfer from private organisations and transfer from other households.
A set of jobs that require the performance of similar or identical sets of tasks. As it is rare for two actual jobs to have identical sets of tasks, in practical terms, an occupation is a set of jobs whose main tasks are characterised by a high degree of similarity. For further information refer to AUSTRALIAN AND NEW ZEALAND STANDARD CLASSIFICATION OF OCCUPATIONS (ANZSCO), FIRST EDITION, 2006 (cat. no. 1220.0).
Panic attack
A panic attack is a discrete episode of intense fear or discomfort that starts abruptly and reaches a peak within a few minutes and lasts at least some minutes.
Panic Disorder
Panic disorder is recurrent attacks of severe anxiety (panic), which are not restricted to any particular situation or set of circumstances (ie do not occur in the presence of a phobia, or in situations of danger) and are therefore unpredictable.
ABS • NAT I O N A L SUR V E Y OF MEN T A L HEA L T H AND WEL L B E I N G : SUMMA R Y OF RESU L T S • 432 6 . 0 • 200 7
G L O S S A R Y continued Perceived health needs
Physical condition
For each type of help, perceived health needs of respondents were classified as follows: ! no need - those who were not receiving help and felt that they had no need for it; ! need fully met - those who were receiving help and felt that it was adequate; ! need partially met - those who were receiving help but not as much as they felt they needed; and ! need not met - those who were not receiving help but felt that they needed it. A medical condition, illness, injury or disability including: asthma; cancer; stroke (or the effects of a stroke); gout, rheumatism or arthritis; diabetes or high blood sugar levels; and any other heart or circulatory condition. Information was also collected about the presence of the following physical conditions only if they had lasted for six months or more: hayfever; sinusitis or sinus allergy; emphysema; bronchitis; anaemia;epilepsy; fluid problems/fluid retention/oedema (excluding those due to heart or circulatory problems); hernias; kidney problems; migraine; psoriasis; stomach ulcer or other gastrointestinal ulcer; thyroid trouble/goiter; tuberculosis; back or neck pain or back or neck problems. The presence of any other physical conditions were not determined.
Post-Traumatic Stress Disorder (PTSD)
A delayed and/or protracted response to a psychologically distressing event that is outside the range of usual human experience. Experiencing such an event is usually associated with intense fear, terror or helplessness. The characteristic symptoms involve re-experiencing the traumatic event (flashbacks), avoidance of situations or activities associated with the event, numbing of general responsiveness and increased arousal.
Prevalence of mental disorders
The proportion of people in a given population who met the criteria for diagnosis of a mental disorder at a point in time.
Psychological distress
Derived from the Kessler Psychological Distress Scale (K10). This is a scale of non-specific psychological distress based on 10 questions about negative emotional states in the 30 days prior to interview. The K10 is scored from 10 to 50, with higher scores indicating a higher level of distress; low scores indicate a low level of distress. In this publication, scores are grouped as follows: ! Low 10–15; ! Moderate 16–21; ! High 22–29; and ! Very high 30–50.
Psychosis
A mental disorder in which the person has strange ideas or experiences which are unaffected by rational argument and are out of keeping with the views of any culture or group that the person belongs to.
Registered marital status
An individual's current status in regard to a registered marriage, ie whether he or she is widowed, divorced, separated, married or never married.
Section of state
Service for the Australian defence forces Services used for mental health problems
This geographical classification uses population counts to define Collection Districts (CDs) as urban or rural. Population counts are used to define a geographical area as a major urban area (population of 100,000 or more), other urban area (population of 1,000–9,999), bounded locality (population of 200–999) and rural balance (the remainder of the state/territory). For more information refer to AUSTRALIAN STANDARD GEOGRAPHICAL CLASSIFICATION (ASGC), 2007 (cat. no. 1216.0). Includes persons who had overseas qualifying service, serving and ex-serving Australian Defence Force members. Services used for self-perceived mental health problems in the 12 months prior to interview. Services include admissions to hospitals and consultations with health professionals for mental health. An individual may have considered they had a mental health problem prior to using services, or may have come to the realisation following consultation with a health professional.
ABS • NAT I O N A L SUR V E Y OF MEN T A L HEA L T H AND WEL L B E I N G : SUMMA R Y OF RESU L T S • 432 6 . 0 • 200 7
95
G L O S S A R Y continued Smoker status
The extent to which an adult was smoking at the time of interview, and refers to regular smoking of tobacco, including manufactured (packet) cigarettes, roll-your-own cigarettes, cigars and pipes, but excludes chewing tobacco and smoking of non-tobacco products. Categorised as: ! Current daily smoker – an adult who reported at the time of the interview that they regularly smoked one or more cigarettes, cigars or pipes per day; ! Current smoker – other – an adult who reported at the time of interview that they smoked cigarettes, cigars or pipes at least once a week, but not daily, or less than weekly; ! Ex-smoker – an adult who reported they did not currently smoke, but had regularly smoked daily, or had smoked at least 100 cigarettes in their lifetime; and ! Never smoked – an adult who reported they had never regularly smoked daily, and had smoked less than 100 cigarettes in their lifetime.
Social marital status
Social marital status is the relationship status of an individual with reference to another person who is usually resident in the household. A marriage exists when two people live together as husband and wife, or partners, regardless of whether the marriage is formalised through registration. Individuals are, therefore, regarded as married if they are in a de facto marriage, or if they are living with the person to whom they are registered as married.
Social networks
For respondents who had contact with family and/or friends, whether they can rely on or confide in them if they were faced with a serious problem. See Contact with family or friends.
Social Phobia
Standard drink
Substance Use disorder Suicidal behaviours
Type of health professional
96
A persistent, irrational fear of being the focus of attention, or fear of behaving in a way that will be embarrassing or humiliating. These fears arise in social situations such as meeting new people or speaking in public. A compelling desire to avoid the phobic situation may result. A standard drink contains 12.5ml of alcohol. It is important to note that the serving size will determine the number of standard drinks per serve, as shown by these approximations: ! Can/Stubbie light beer = 0.8 standard drink ! Can/Stubbie medium light beer = 1 standard drink ! Can/Stubbie regular beer = 1.5 standard drinks ! 100ml wine (9 to 13% alcohol) = 1 standard drink ! 30ml nip spirits = 1 standard drink ! Can spirits (approx 5% alcohol) = 1.5 to 2.5 standard drinks Substance Use disorders include harmful use and/or dependence on drugs and/or alcohol. Three experiences are included as suicidal behaviours: ! Ideation (ie the presence of serious thoughts about committing suicide); ! Plans; or ! Attempts. Type of health professionals: ! general practitioner ! psychiatrist ! psychologist ! mental health nurse ! other mental health professional - includes specialist mental health services, such as a social worker, counsellor or occupational therapist ! other health professional - includes those providing general services; a specialist or surgeon, such as a cardiologist, gynaecologist or urologist; or complimentary/alternative therapists, such as a herbalist or naturopath.
ABS • NAT I O N A L SUR V E Y OF MEN T A L HEA L T H AND WEL L B E I N G : SUMMA R Y OF RESU L T S • 432 6 . 0 • 200 7
G L O S S A R Y continued Type of help for mental health problems
Type of medication used for mental health
A range of assistance provided by health services for mental health problems: ! information ! medication ! counselling ! social intervention (ie help to sort out practical issues such as housing or money problems, or for support or company, or to help meet people) ! skills training (ie help to improve ability to work, to care for self, or to use time more effectively) Refers to the type of medication reported by respondents as used for their mental health in the two weeks prior to interview. May include medications used for preventive health purposes as well as medications used for mental disorders and includes vitamins and minerals, natural and herbal medications and pharmaceutical medications.
Unemployed
People aged 15 years and over who were not employed during the reference week, and: ! had actively looked for full-time or part-time work at any time in the four weeks up to the end of the reference week and were available for work in the reference week; or ! were waiting to start a new job within four weeks from the end of the reference week and could have started in the reference week if the job had been available then.
World Health Organization (WHO)
The WHO is the directing and coordinating authority for health within the United Nations system. It is responsible for providing leadership on global health matters, shaping the health research agenda, setting norms and standards, articulating evidence-based policy options, providing technical support to countries and monitoring and assessing health trends.
WHODAS
The WHO Disability Assessment Schedule (WHODAS) is a simple tool for assessing disturbances in social adjustment and behaviour in patients with a mental disorder. The current version (WHODAS II) represents a complete revision, reflective of WHO's current thinking about functioning and disability.
ABS • NAT I O N A L SUR V E Y OF MEN T A L HEA L T H AND WEL L B E I N G : SUMMA R Y OF RESU L T S • 432 6 . 0 • 200 7
97
BIBLI O G R A P H Y
Access Economics, 2007. Smoking and mental illness: Costs. A report for SANE Australia. Retrieved 18 August 2008 from http://www.accesseconomics.com.au/ Andrews, G and Slade, T, 2001. Interpreting scores on the Kessler Psychological Distress Scale (K–10) in the Australian and New Zealand Journal of Public Health, vol. 25, no. 6, pp494-497. Retrieved 18 June 2008 from Informit database. Australian Bureau of Statistics (ABS), 2007. Education and Work, Australia, 2007 (cat. no. 6227.0). Canberra. Australian Bureau of Statistics (ABS), 2006. National Health Survey: Summary of Results, 2004–05 (cat. no. 4364.0). Canberra. Australian Health Ministers, July 2003. National Mental Health Plan 2003–2008. Retrieved 12 June 2008 from http://www.health.gov.au/ Australian Institute of Health and Welfare (AIHW), 2008. Australia's Health, 2008 (cat. no. AUS99). AIHW, Canberra. Commonwealth Department of Health and Aged Care (CDHAC), 2001. National Comorbidity Project. A report on the National Comorbidity Workshop prepared by M Teesson and L Burns (eds) of the National Drug and Alcohol Research Centre. Commonwealth of Australia, Canberra. Department of Health and Ageing (DoHA), 2007. National Mental Health Report, 2007: Summary of Twelve Years of Reform in Australia's Mental Health Services under the National Mental Health Strategy 1993–2005. Commonwealth of Australia, Canberra. Department of Veteran's Affairs (DVA), 2004. Alcohol and mental health. Retrieved 10 September 2008 from http://www.therightmix.gov.au/ Fryers, T, Melzer, D, Jenkins, R, and Brugha, T, 2005. The distribution of the common mental disorders: Social inequalities in Europe in Clinical Practice and Epidemiology in Mental Health (online), vol. 1, no. 14. Retrieved 15 August 2008 from BioMed Central http://www.pubmedcentral.nih.gov/ Kessler, RC, and Ustun, TB, 2004. The World Mental Health (WMH) Survey Initiative version of the World Health Organization (WHO) Compositie International Diagnostic Interview (CIDI) in the International Journal of Methods in Psychiatric Research, vol. 13, no. 2, pp93-121. Retrieved 2 July 2008 from http://www.hcp.med.harvard.edu/wmhcidi/ National Centre for Education and Training on Addiction (NCETA) Consortium, 2004. Alcohol and Other Drugs: A handbook for health professionals. Retrieved 11 September 2008 from http://www.aodgp.gov.au SANE Australia, 2008. Factsheet: Suicidal behaviour and self-harm. Retrieved 9 September 2008 from http://www.sane.org World Health Organization (WHO), 2007. International Classification of Diseases and Related Health Problems, 10th Revision (ICD-10 online). Retrieved 19 June 2008 from http://www.who.int/ World Health Organization (WHO), 2005. Promoting mental health: Concepts, emerging evidence, practice. A report of the WHO, Department of Mental Health and Substance Abuse in collaboration with the Victorian Health Promotion Foundation and the University of Melbourne by Herman, Saxena, and Moodie (eds). Retrieved 28 August 2008 from http://www.who.int/ World Health Organization (WHO), 2001. The World Health Report 2001- Mental health: New understanding, New hope. Retrieved 12 June 2008 from http://www.who.int/
98
ABS • NAT I O N A L SUR V E Y OF MEN T A L HEA L T H AND WEL L B E I N G : SUMMA R Y OF RESU L T S • 432 6 . 0 • 200 7
MORE
INFOR M A T I O N
.
.
4326. 0
FOR
.
NATION AL
PHONE
1300 135 070
EMAIL
[email protected]
OF
FAX
1300 135 211
POST
Client Services, ABS, GPO Box 796, Sydney NSW 2001
MENTAL
SURVE Y
Our consultants can help you access the full range of information published by the ABS that is available free of charge from our website. Information tailored to your needs can also be requested as a 'user pays' service. Specialists are on hand to help you with analytical or methodological advice.
2007
INFORMA T IO N AND REFERRA L SERVICE
•
www.abs.gov.au the ABS website is the best place for data from our publications and information about the ABS.
INTERNET
ACCES S
TO
STATI S T I C S
www.abs.gov.au
WELLB E I N G :
WEB ADDRESS
AND
All statistics on the ABS website can be downloaded free of charge.
HEAL T H
FREE
SUMMA R Y OF RESULT S , AUSTR A L I A •
© Commonwealth of Australia 2008 Produced by the Australian Bureau of Statistics