Unsupervised Learning: The machine sees only the input sequence x1, x2,...,. xN . ... The emerging features are used as input for a supervised digit classifier in.
5. Unsupervised Learning
The example networks presented so far were designed manually to highlight different features of the Neural Abstraction Pyramid architecture. While the manually designed networks are relatively easy to interpret, their utility is limited by the low network complexity. Only relatively few features can be designed manually. If multiple layers of abstraction are needed, the design complexity explodes with height, as the number of different feature arrays and the number of potential weights per feature increase exponentially. Hence, there is no choice but to use machine learning techniques to automatically design the network’s connectivity from a dataset that describes the application at hand. Generally, three types of machine learning are distinguished [159]: • Supervised Learning: A sequence of input/output pairs (x1 , y1 ), (x2 , y2 ), . . . , (xN , yN ) is given to the learning machine. Its goal is to produce the correct output yi if it is confronted with a new input xi . • Unsupervised Learning: The machine sees only the input sequence x1 , x2 , . . . , xN . Its goal is to build representations that can be used for reasoning, decision making, predictions, communication, and other tasks. • Reinforcement Learning: The learning machine is now a situated agent that can produce actions a1 , a2 , . . . , aN which affect the state of the world around it and hence the later inputs x. The agent receives rewards r1 , r2 , . . . , rN and has the goal to maximize them in the long term. Reinforcement learning [223] requires an agent acting within a world. It is much more general than the other two types of learning but cannot be applied to a perception network alone. If the Neural Abstraction Pyramid were complemented by an inverse pyramidal network that expands abstract decisions to concrete actions, reinforcement learning would be a promising technique for training that agent. Supervised learning is covered in the next chapter. The remainder of this chapter discusses how unsupervised learning techniques can be applied in the Neural Abstraction Pyramid framework. The chapter is organized as follows: In the next section, I briefly discuss several techniques for unsupervised learning. Then, an algorithm for learning a hierarchy of sparse features in the Neural Abstraction Pyramid is proposed. In Section 5.3 this algorithm is applied to a dataset of handwritten digits. The emerging features are used as input for a supervised digit classifier in Section 5.4.
98
5. Unsupervised Learning
5.1 Introduction Unsupervised learning [16] techniques are applicable where supervised learning is not: if desired outputs for the learning machine are unavailable, one can still try to discover the structure underlying a dataset. Since data can be always interpreted in many different ways, some bias is needed to determine which aspects of the input’s structure should be captured in the output of the learning machine. In general, unsupervised learning has the goal of finding useful representations of the given data, for example, by: – – – –
grouping examples to clusters, reduction of data dimensionality, discovering hidden causes of the data, or modeling the data density.
If unsupervised learning is successful, the produced representations can be applied to tasks, such as data compression, outlier detection, classification or to make other learning tasks easier. The last application refers to the preprocessing step of pattern recognition systems. One of the most important problems in pattern recognition is the extraction of meaningful features from input signals. To compute symbolic information, such as the class of an observed object, it is often useful to aggregate characteristic aspects of the observation into a feature vector that is presented to a classification system. This generally reduces the dimensionality of the data and facilitates generalization by discarding aspects of the signal that correspond to variances not relevant for classification or to noise. A variety of feature extraction methods exist, e.g., for the problem of handwritten digit recognition [242]. Some methods use the normalized pixel image as input for a powerful statistical or neural classifier [22]. Others use features having a medium degree of abstraction, such as moments [204] or coefficients of the KLtransformation [86]. The most abstract features are extracted by methods that use the digit’s structure for recognition [21]. All these features usually need specific tuning towards the task at hand. This makes the transfer to other applications difficult. For this reason, it would be desirable to construct abstract features from a dataset of example images by means of unsupervised learning techniques. The Kalman filter and non-negative matrix factorization are unsupervised learning methods that have already been discussed in Chapter 3. Clustering. One of the best known methods of unsupervised learning is the Kmeans algorithm [145] for clustering of input vectors. It is also known as LBG method [144] for vector quantization. The algorithm assumes that the data vectors xi can be grouped into K clusters and replaced by the mean µci of the assigned cluster ci without much loss of information. The K-means algorithm optimizes iteratively a squared error criterion: N X kxi − µci k2 . (5.1) i=1
5.1 Introduction
99
The centroids µj are initialized arbitrarily, e.g. to randomly chosen examples. Each iteration consists of two steps: • Step1: Assign the data vectors to the closest centroid: ci = argmin kxi − µj k. 1≤j≤K
• Step2: Move the centroids to the mean of the assigned examples: µj = hxi ici =j . In a probabilistic framework, the K-means algorithm is a special case of the expectation-maximization (EM) algorithm [52] applied to mixture density estimation. Since each step decreases the quantization error until the assignment does not change any more, the K-means algorithm finds a local minimum of the error function 5.1. The quality of the approximation depends on the number of centroids and on the initialization. One can start with a low number of clusters that are split recursively to avoid initialization problems and to determine the number of clusters needed. Competitive Learning. The algorithm described above can be viewed as competition between the centroids to respond to the data vectors. Similar competition is achieved in winner-takes-all (WTA) networks. These neural networks consist of an input layer and a layer of laterally connected processing elements which assess the similarity between the current data vector xi and their weight vector wj . The assessment can be done using a distance function d(xi , wj ), as in self organizing maps (SOM) [126], or by computing the scalar product xi · wj . If the weight vectors and the inputs are normalized, the scalar product equals the cosine of the angle spanned by both vectors. The unit with the smallest distance or the largest scalar product is called the winner. Its output is set to one, while the outputs of all other units are set to zero. This operation requires global information about the similarities. It can be implemented by lateral inhibition. Competitive learning [201] in WTA networks can be achieved by adapting only the weight vector wk of the winning unit k. One possibility is to add a fraction of the current data vector: ∆wk = ηxi , where η is a learning rate that decreases over time, followed by a renormalization of the weight length: wk ← wk /kwk k. This leads to a redistribution of weight strengths from the weights connecting to inactive input components to the weights connecting to active inputs. Hence, the unit will respond more strongly if the same input is presented again. The weight vectors of the units loosing the competition remain unchanged. It is also possible to use the difference between the weight vector and the input to make the weights similar to the inputs: ∆wk = η(xi − wk ). If the network has a topological structure, such as in the SOM, neighboring units can be moved in the same direction to produce a topological feature map. Principal Component Analysis. One of the key ingredients of unsupervised learning methods are Hebbian [91] weight P updates: ∆wi = ηxi y, where xi is the activity of the presynaptic unit and y = i wi xi = w · x is the activity of the postsynaptic unit. The Hebbian learning rule can be stated informally as: ‘Neurons that fire together – wire together.’ If the inputs are zero mean, it captures the correlations
100
5. Unsupervised Learning
Cij = hxi xj i between the input units: h∆wi = ηCw. The correlation matrix C can be viewed as linear transformation of the weight vector. In the long run, the eigenvector e with the largest eigenvalue λ will dominate the weight change: Ce = λe. If the Hebbian rule is combined with normalization, the weights develop towards the principal component of the data. Generic Hebbian learning is unstable since the weights grow without limits. To avoid this effect, Oja [169] proposed adding a weight-decay term to the update rule: ∆wi = ηy(xi − ywi ). It implements a self-normalization of the weight vector. The unit’s output y represents the�orthogonal projection of a data vector x onto the weight vector w. Its variance y 2 is maximized by the learning rule. If more than the first principal component is desired, the reconstruction r = ywT = wxwT of the data vector that is based on y can be subtracted from x to produce new examples x0 = x − r, which can be analyzed by a second unit to extract the second principal component. Another possibility is to extend � � the learnP ing rule for a multi-unit network to ∆wr = ηyr x − s≤r ys ws as proposed by Sanger [203]. The principal component analysis (PCA) network decorrelates its outputs yk and hence removes linear dependencies from the input. Because the number of output units can be chosen smaller than the number of input components, the linear PCA transformation can be used to reduce the dimensionality of the data with minimal loss of variance. Independent Component Analysis. Another unsupervised learning technique is called independent component analysis (ICA) [115, 26]. Its goal is to find a linear transformation of the data vectors x that produces a representation y = Wx with components which are not only uncorrelated, but statistically independent. This is motivated by the assumption that the data vectors have been produced as a linear mixture x = As of independent sources si . If this is the case, ICA can be used to separate the sources by estimating an unmixing matrix W = A−1 , a problem known as blind source separation. ICA is applicable if at most one of the sources has a Gaussian distribution. Principal component analysis and whitening are usually required as preprocessing steps to remove second order correlations from the data vectors. This discards information about sign and amplitude of the sources. Some ICA methods use the fact that if two sources s1 and s2 are independent, then any nonlinear transformations g(s1 ) and h(s2 ) are uncorrelated. Thus, they perform nonlinear decorrelation to separate the sources. According to the central limit theorem, sums of nongaussian random variables are closer to a Gaussian than the original ones. This is used in ICA methods that maximize the non-gaussianity of the output components. To measure nongaussianity, cumulants of higher-order moments, such as the kurtosis, the normalized form of the fourth central moment measuring the peakedness of a distribution, are used. Because the estimation principles discussed above use non-quadratic functions, the computations needed usually cannot be expressed using simple linear algebra.
5.1 Introduction
101
Numerical optimization methods, e.g. gradient descent or the fixed-point algorithm called FastICA [106], are employed to estimate W. Other Unsupervised Learning Techniques. Because the goals of unsupervised learning can vary greatly, there exist many different unsupervised learning techniques that have not been discussed so far. One example is slow feature analysis (SFA), recently proposed by Wiskott and Sejnowski [244]. This method focuses on finding representations that change only slowly as input examples undergo a transformation. SFA expands the input signal non-linearly and applies PCA to this expanded signal and its time derivative. The components with the lowest variance are selected as slow features. Temporal smoothing of the network’s output is also the basis of the method proposed by F¨oldiak [69] for the learning of invariant features. Another example of unsupervised techniques is the learning of sparse features. Sparse representations can be viewed as generalization to the local representations generated by WTA networks. While in local representations exactly one unit is active, in sparse representations multiple units can be active, but the ratio between the active and the inactive units is low. This increases the representational power of the code, facilitates generalization, allows for controlled inference, increases the capacity of associative memories, implements fault tolerance, and allows for the simultaneous representation of multiple items by superposition of individual encodings [70]. There is substantial evidence that the human visual system utilizes sparse coding to represent properties of visual scenes [215]. A simple local unsupervised algorithm for learning such representations in a nonlinear neural network was proposed by F¨oldiak [68]. It uses Hebbian forward connections to detect non-accidental features, an adaptive threshold to keep the activity ratio low, and anti-Hebbian decorrelating lateral connections to keep redundancy low. It produces codes with few active units for frequent patterns, while less probable patterns are encoded using a higher number of active units. Other algorithms for the learning of sparse features adjust connection weights by explicitly maximizing measures of sparseness, successfully producing V1 simple cell-like features [170]. This class of algorithms is closely related to ICA since sparse distributions are also non-Gaussian. Beyond sparseness, another interesting property of a representation is the interpretability of encodings. While a randomly chosen codeword could only signal the presence of an item, Barlow [15] suggested that the cortex might use sparse codes where the individual units signal the presence of meaningful features in the input. In this scheme, items are encoded by combinations of features. In the following section, I introduce an unsupervised learning algorithm for the forward projections of the Neural Abstraction Pyramid. It is based on Hebbian weight updates and lateral competition and yields a sequence of more and more abstract representations. With increasing height, the spatial resolution of feature arrays decreases, feature diversity increases and the representations become increasingly sparse.
102
5. Unsupervised Learning
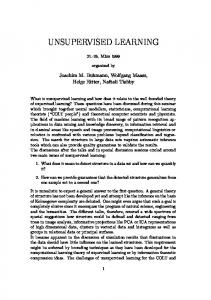
5.2 Learning a Hierarchy of Sparse Features In order to make the Neural Abstraction Pyramid approach to image interpretation work, a sequence of increasingly abstract models of the potential image content is needed. In the last chapter, such models were designed manually. In Section 4.3.2, for instance, the Gestalt approach was used to construct weight templates for the extraction of foreground/background features, step edges, and oriented lines. The feature cells in that network cooperated and competed to achieve binarization of handwritten digits. In the previous section, several unsupervised learning methods were discussed. They produced new representations from a set of data vectors. The representations found by the different methods have various properties that sometimes are contradictory. For example, while PCA tries to preserve variance, SFA focuses on the least variant features. All methods discussed so far are single-step transformations. In contrast, the Neural Abstraction Pyramid represents the image content on different levels of abstraction. Hence, a sequence of transformations is needed to extract features which become increasingly abstract. One way to produce such features is by repeated application of an unsupervised learning technique. This imposes a constraint on the learning method: Its output must be admissible as input for the next stage of learning. Hence, unsupervised learning methods that drastically change the nature of the representation cannot be used for this task. Another constraint is that features within a level should be treated equally. This excludes methods which produce an ordered sequence of features. In the following, I present an unsupervised learning method that produces representations with the following desired properties: – Completeness: All salient features of the input image should be represented. – Sparseness: The value of a feature should be zero at most positions and high at only a few positions. – Fairness: All feature arrays of a layer should contribute approximately equally to the representation. The proposed method is based on Hebbian weight updates and lateral competition. It can be applied repeatedly to learn a hierarchy of sparse features. Training starts at Layer 1 of the pyramid that analyzes small windows of Layer 0 representations. It proceeds upwards from layer to layer. Using the topmost representation on layer (l − 1) as input, it learns weight templates for the forward projections of feature cells that reside on layer l. Since the number of layers is logarithmic in the image size, only a few steps are needed to train the entire hierarchy. 5.2.1 Network Architecture Figure 5.1 illustrates the architecture of the network that is used for the unsupervised learning of a hierarchy of sparse features. It is a Neural Abstraction Pyramid (compare to Chapter 4) with six layers. Each layer l consists of 4 · 2l excitatory feature arrays and a feature sum array. All but the bottom layer also contain an array
5.2 Learning a Hierarchy of Sparse Features
103
inhibitory Feature sum
excitatory
Input
Layer 0 (32x32x4)
Layer 1 (16x16x8)
Layer 2 (8x8x16)
Layer 3 (4x4x32)
Layer 4 Layer 5 (2x2x64) (1x1x128)
Fig. 5.1. Learning a hierarchy of sparse features – network architecture. The Neural Abstraction Pyramid consists of six layers. Only forward projections are used. Excitation is specific while unspecific inhibition is mediated by the subsampled smoothed feature sums.
that represents the subsampled sum of the features in the layer below. This feature is inhibitory. Patterns are presented to the input feature array located in the bottom layer of the network. The input is analyzed by four excitatory feature arrays of Layer 0 that compute center-surround features. They each have a single lateral projection with direct access to the input array. The weights of these projections have a differenceof-Gaussian structure with two different scales and two polarities. Fine and coarse foreground and background features are detected. The projection unit has a linear transfer function and contributes with weight one to the output unit which has a saturating rectifying transfer function fp sat (α = 1, see Section 4.2.4) that limits the activities to the interval [0, 1]. This transfer function is also used for the output units of the excitatory feature cells in the higher layers. The feature sum Sl has only a single lateral projection with direct access to all excitatory features of a layer. It weights the 3×3 neighborhood of its hypercolumn with a binomial kernel that is scaled with a gain factor. The gain decreases with height, such that the central weight decreases from 0.125 in Layer 0 to 0.015625 in Layer 5. Both the transfer function of the projection unit and the one of its output unit are linear. On the next higher layer the inhibitory feature array Sˆl computes the average of a 2×2 window of Sl . The basic processing elements used for the excitatory features in Layer 1 to Layer 5 have two projections. One is the specific excitatory forward projection that directly accesses overlapping 4×4 windows of all excitatory feature arrays in the layer below. The other is the unspecific inhibitory projection that accesses the sub-
104
5. Unsupervised Learning
sampled feature sum Sˆl with weight −1. The transfer functions of both projections are linear. In the following, the weight from the specific excitatory projection to the output unit of feature kl is called Ekl , and the weight from the inhibitory projection is called Ikl . Both gain factors determine, how specific a feature cell will react to stimuli. If the excitation is large, compared to the inhibition, the cell reacts unspecifically to many stimuli that partially match its excitatory projection. On the other hand, if inhibition is large the cell is sharply tuned to the stimuli that exactly match the specific weights of its excitatory projection. 5.2.2 Initialization pq The weights wkl of the excitatory projections are initialized unspecifically: Larger positive weights are used in the center and weaker weights are used towards the periphery of the receptive field window. The weights have a random component and are normalized to a sum of one. This normalization of total excitatory weight strength is maintained during learning. The excitatory weights are not allowed to become negative. The excitatory gain Ekl is initialized to 2.0, while the inhibitory gain Ikl is initialized to zero. Hence, initially the excitatory features will react very unspecific to all stimuli present on the lower layer. The bias weights of all projection units and output units are set to zero and not changed during learning.
5.2.3 Hebbian Weight Update A combination of winner-takes-all learning and Hebbian weight updates [91] is used to make the excitatory weights specific. The idea is to change the weight template of the locally most active feature cell such that it becomes more specific to the current input. This means it will react more strongly to the same stimulus and react less strongly to other stimuli. For each training step, an image is chosen randomly from the dataset. It is loaded into the input feature array at bottom layer of the pyramid, and the activities of all feature cells are computed in the appropriate order. The following learning rules are applied only at positions where the subsampled feature sum Sˆ(l−1) of the inputs and the smoothed sum of the outputs Sl are nonzero. This avoids learning when there is nothing to learn. Furthermore, the subsampled input sum Sˆ(l−1) must have at most two larger values in its 8-neighborhood. This focuses the features to respond mostly to local maxima and ridges of the input sum. For the hypercolumns (i, j) of layer l meeting the above criteria, the most active feature kmax and the feature ksec with the second highest activity are determined. The qth weight wkpqmax l of the excitatory projection p of the winning feature kmax is changed as follows:
5.2 Learning a Hierarchy of Sparse Features
∆wkpqmax l
=
with ain aout
= =
ηl · ain · aout ,
105
(5.2)
pq H(Ipq kmax l , Jkmax l ) · ai∗ j ∗ k∗ l∗ , aijkmax l − aijksec l .
A weight is increased by an amount that is proportional to the product of the scaled input activity ain and the amount aout by which the activity of the winning feature cell exceeds the one of the second best feature. The use of the difference of the two most active features instead of the cell activity has a decorrelating effect on the features. They are forced to respond to different stimuli. How the address i∗ j ∗ k ∗ l∗ of the source feature cell is determined is explained in Section 4.2.2. Because more example windows are available to determine the lower-layer features than for the higher-layer ones, the learning rate ηl increases with height, e.g. ηl = 0.001Kl, where Kl is the number of excitatory features in layer l. pq The scaling factor H(Ipq kmax l , Jkmax l ) used for the input activity depends on the offset of a weight relative to the position (Υll∗ (i), Υll∗ (j)) in the source layer l∗ = (l − 1) that corresponds to the position (i, j) in layer l. H is one in the center of the window and descends to zero towards the periphery. The weighting enforces a centered response of the feature cells. This is done because non-centered stimuli can be represented by neighboring feature cells. The Hebbian term (5.2) makes the excitatory weights larger. To prevent unlimited weight growth, the sum of the excitatory weights is kept at a value of one by scaling down all weights by a common factor. The net effect of the normalized Hebbian update is that the weights receiving strong input are increased and the other weights are decreased. 5.2.4 Competition The normalization of the sum of the weights of excitatory projections, described above, is a form of competition. The weights compete to receive a large portion of the projection’s constant weight sum. In addition, competition between the Kl excitatory features of layer l is needed to achieve the desired properties for the produced representation. Care must be taken that a learning rule enforcing one constraint does not interfere with another rule enforcing a different constraint. To fulfill the fairness constraint, the winning frequency of all templates should be about the same. In order to achieve this, a feature’s inhibitory gain Ikl is increased each time it wins the competition; otherwise, it is decreased. This makes features whose winning frequency is above average less active and more specific. Consequently, these features will not win too frequently in the future. On the other hand, features that win less often become more active and less specific and therefore now win more often. The change is done by adding a small constant ∆If kl to Ikl , such that the net effect for a feature that has an average winning frequency is zero: � ηf : k = kmax [winning] If , (5.3) ∆kl = ηf : k 6= kmax [not winning] − Kl −1
106
5. Unsupervised Learning
where ηf is a constant. To achieve a complete representation, the features are forced to react to all significant input stimuli by constraining the smoothed sum Sl of the features in layer l to be equal to the subsampled sum Sˆ(l−1) of the input features from layer (l − 1): ∆Ec kl
=
∆Ic kl
=
ηc aijkl (Sˆij(l−1) − Sijl ), Kl −∆Ec kl ,
(5.4)
where ηc is a constant. If the activity of the features is too low, the excitatory gains of the active features are increased, and they are disinhibited at the same time. The opposite behavior applies when the features are too active. To enforce sparseness, the activity of a winning feature must be made large, e.g. to V = 0.75: � ηs (V − aijkmax l ) : k = kmax [winning] ∆Es = , (5.5) kl 0 : k 6= kmax [not winning] where ηs is a constant. If the activity of the winner is too small, its excitatory gain is increased; otherwise, it is decreased. Ic If adding ∆If kl and ∆kl to Ikl makes the inhibitory gain negative, its weight is added to Ekl , and Ikl is set to zero. Vice versa, if Ekl should become negative from Es adding ∆Ec kl and ∆kl it is set to zero, and its weight is added to Ikl . The efficacy of the constraint enforcing rules, described above, can be controlled by the learning constants. One possible choice could be: ηf = ηc = ηs = 0.1ηl . The rules are designed such that their net effect goes to zero if the learned representation has the desired properties. Then the templates describing the computation of the features become stable, and the training can be stopped. The number of training images needed to determine the weights of the weight templates for a layer increases with the height of that layer since the number of examples per image decreases and the number of weights per layer increases. Because the emerging representations are sparse, most of the weights will be close to zero after training and can be pruned away without significant loss. This speeds up the computation and saves memory.
5.3 Learning Hierarchical Digit Features The properties of the described unsupervised learning algorithm can be illustrated by applying it to a dataset of handwritten digits. Here, digits are used which have been extracted by Siemens AG from German ZIP codes written on large-size letters. The available examples are partitioned as follows: 44,619 digits constitute the training set (TRN), 5,379 digits are available for testing the performance of a recognition system and to stop training (TST), and 6,313 digits are used for final validation (VAL).
5.3 Learning Hierarchical Digit Features
107
Table 5.1. Learning a hierarchy of sparse features – emerging representations. layer
name
feature arrays
hypercolumns
feature cells
input size
5
digits
128
1×1
128
32×32
4
curves
64
2×2
256
16×16
3
strokes
32
4×4
512
8×8
2
lines
16
8×8
1024
4×4
1
edges
8
16×16
2048
2×2
0
contrasts
4
32×32
4096
1×1
Since the digits show a high degree of variance, some preprocessing steps are necessary prior to presentation to the pyramid. Preprocessing consists of binarization, size and slant normalization. The images are scaled to 24×24 pixels and are centered into the 32×32 input array at the bottom layer of the pyramid. The Neural Abstraction Pyramid is initialized at the lowest level (l = 0) with contrast detectors. These have a center-surround type receptive field that analyzes the intensities of the input image. Four different features are used: center-on/offsurround and center-off/on-surround in two scales, representing the fine and coarse details of the foreground and the background, respectively. The feature arrays are surrounded by a border of the same width that is set to zero. Repeated application of the unsupervised learning method, described above, yields following representations (compare to Table 5.1): – Edges: Vertical, horizontal, and diagonal step edges are detected at Layer 1. – Lines: At Layer 2 short line segments with 16 different orientations are detected. – Strokes: Larger line segments that have a specific orientation and a specific curvature are detected at Layer 3. Detectors for line endings and specific parallel lines emerge as well. – Curves: The feature detectors at Layer 4 react to typical large substructures of digits, such as curves, crossings, junctions, etc. – Digits: The feature cells at the topmost Layer 5 see the entire digit. Consequently, detectors for typical digit shapes emerge. Figure 5.2 shows in its upper right part a preprocessed input digit. On the upper left, the activities of the contrast detectors are shown. They provide input to the edge features via the specific weights of the excitatory projections. On the left side of the figure, the activity of the edge feature arrays is shown. It can be seen that the feature cells detect oriented step edges. For instance, the feature in the first row detects edges on the lower side of horizontal lines. It receives input from foreground features in the upper part of its projection and from background features in the lower part of the projection. The right side of the figure shows the four best stimuli of the training set that excited the features maximally. In the center of these stimuli, the 2×2 area of responsibility of Layer 1 features is shown in the original contrast. Its neighborhood is shown with a lower contrast.
108
5. Unsupervised Learning Contrasts
Input ContrastSum EdgeSum
1
1.75 0.58
2
2.05 0.78
3
2.28 0.97
4
2.24 0.96
5
2.25 0.78
6
2.22 0.63
7
2.09 0.64
8
5.24 3.12
Edge(k)
Excitatory Weights
Ekl Ikl
Best Stimuli
Fig. 5.2. Learning a hierarchy of sparse features – edge features. Shown are from left to right: activity of the feature arrays for a digit (Input ”0”), excitatory weights to contrast features, excitatory and inhibitory gain, stimuli that caused the highest winning activity. There are pairs of step-edges for horizontal, vertical and (/) diagonal lines. The diagonal (\) is represented by a single feature only. The feature in the last row detects background and reacts most strongly to the inner part of small loops.
All learned edge features are different. There are pairs of horizontal, vertical, and lower-left to upper-right diagonal step edges. The upper-left to lower-right diagonal is represented by only one feature that responds to the center of the line. This is no surprise since lines of this orientation are less frequent in handwriting. The feature in the last row serves a special purpose. It is excited by centered background and responds most to the inner part of small loops. The edge features are not very specific. Since the inhibitory gain is small, they respond also to suboptimal stimuli. Only the last feature is strongly inhibited by the sum of the contrast features to avoid responses to foreground. On the next higher level, Layer 2, the 16 features respond to lines of different orientations. The line detectors show a sharper orientation tuning than the edge features. Four line features that detect approximately horizontal lines are shown in
5.3 Learning Hierarchical Digit Features Edges
4 6 9 15 Line(k)
Excitatory Weights
EdgeSum
3.48 0.94 3.46 0.85 2.99 0.45 2.60 0.35 Ekl Ikl
109
LineSum
Best Stimuli
Fig. 5.3. Learning a hierarchy of sparse features – line features. Four of the 16 features were chosen that respond to approximately horizontal lines. The other features respond to lines of other orientations.
Fig. 5.4. Learning a hierarchy of sparse features – stroke features. Shown are the eight best stimuli of eight features that detect horizontal strokes with different curvature. The upper part of the figure shows the sparse activity of all 32 stroke features.
Figure 5.3. They receive input mostly from the pair of horizontal step edges. The lower horizontal edge feature is accessed by the lower part of the forward projections, while the upper horizontal edge is accessed by the upper part of the projection. Step edges of other orientations contribute less to horizontal line features. The access to the Layer 1 background feature that is done by the upper and the lower row of projection weights is also interesting. The 32 stroke features at Layer 3 are not as easy to describe as the line features. They react to different local line shapes. Figure 5.4 shows the eight best stimuli for eight of the stroke features that react to approximately horizontal lines. In addition to the orientation preference, some of the stroke features are also sensitive to line curvature. Others seem to react to line endings. The feature in the lower right corner is stimulated optimally by two parallel horizontal lines. It responds to the background between the lines. The figure also shows in its upper part the activity of
110
5. Unsupervised Learning
Fig. 5.5. Learning a hierarchy of sparse features – curve features. Shown are the eight best stimuli of the 16 first features. They respond to typical digit parts. The upper part of the figure shows the sparse activity of all 64 curve features.
all stroke features when the input from Figure 5.2 is presented to the network. One can see that the representation is already quite sparse. Figure 5.5 shows the eight best stimuli of the first 16 of the 64 curve features that reside on Layer 4 of the pyramid. They detect typical digit parts, such as open and closed loops, line crossings, and major strokes. It can be observed that for most curve features all of the best stimuli belong to the same digit class. The activity of the curve features is sparse since not all typical configurations of strokes are contained in a single digit. The best stimuli of some of the top-layer digit features are shown in Figure 5.6. For the left side of the figure, digit features that react best to one of the ten digit classes were selected. The right side shows digit features that were selected because they react to examples from different classes. They seem to focus on some aspect of the digit, such as to the presence of a vertical line or to a characteristic curve. One must ask the question: ‘What do the best stimuli have in common?’ to find out what a specific feature cell detects. The emerging feature detectors do not represent all possible combinations of substructures, but only the typical ones. The more frequent combinations of lower level features are represented by multiple similar features with greater detail than the less frequent ones. When going up in the hierarchy of representations, the correlation of feature activities with the digit class increases. This is remarkable since no class information has been presented to the system so far.
5.4 Digit Classification
111
Fig. 5.6. Learning a hierarchy of sparse features – digit features. Shown are the eight best stimuli. For the left column features were chosen that correspond to a single class. The right column shows features that focus on some other aspect of a digit.
5.4 Digit Classification In the following experiments, the usefulness of the learned sparse features for digit recognition is investigated. First, only two layers of the pyramid are constructed. The resulting representation is based on features that represent oriented lines. It has the same total size as the input image. Table 5.2 shows the performance of a KNN classifier and two feed-forward neural networks (FFNN) that were trained with backpropagation using the digit’s gray values and the extracted lines as feaTable 5.2. Learning a hierarchy of sparse features – classification of low-level features. Zeroreject substitution rates of different classifiers. features
Gray
Lines
classifier
TST
VAL
TST
VAL
KNN 15
2.98
2.87
4.53
4.36
FFNN 1024 − 10
5.82
6.48
2.04
2.14
FFNN 1024 − 64 − 10
2.49
2.65
1.90
2.04
112
5. Unsupervised Learning
Table 5.3. Learning a hierarchy of sparse features – classification of abstract features. Zeroreject substitution rates of different classifiers that input the upper four layers of the learned hierarchy of sparse features. classifier
TST
VAL
KNN 15
3.59
3.64
FFNN 1920 − 10
1.71
1.66
FFNN 1920 − 16 − 10
1.99
1.77
FFNN 1920 − 32 − 10
1.71
1.73
FFNN 1920 − 64 − 10
1.67
1.68
FFNN 1920 − 128 − 10
1.65
1.49
tures. One can see that the performance of the neural networks is better for the more abstract features. In the second experiment, the top four layers of the feed-forward pyramid are fed into a 1920 − 128 − 10 FFNN to classify the digits. After 120 epochs of onlinetraining with a learning rate of η = 0.01, a zero-reject substitution rate of 1.65% on the test set and a rate of 1.49% on the validation set was observed. Table 5.3 shows the results for different numbers of hidden units, as well as for a network without hidden units and a KNN classifier. These rates compare favorably to the results published in [21] for the same dataset. One can also reject ambiguous digits by looking at the two best classes. The substitution rate drops to 0.55% when 2.52% of the validation set are rejected and to 0.21% for 7.9% rejects. Figure 5.7 shows the substitution-reject curve of this classifier compared to the structural classifier and a time-delay neural network (TDNN) classifier [21]. Clearly, the classifier that uses the features extracted by the Neural Abstraction Pyramid performs about as well as the combination of the other two classifiers. The figure also shows the results when the new classifier is combined sequentially [22] with the other two. Now the zero-reject substitution rate drops to 1.17%. The substitution rate can be reduced to 0.30% with 3.60% and to 0.11% with 9.20% rejects. These results are the best the author knows for this dataset.
5.5 Discussion This chapter presented an unsupervised learning algorithm for the design of the forward projections in the Neural Abstraction Pyramid. The algorithm was applied to a dataset of handwritten digits to produce a sequence of increasingly abstract digit representations. The emerging feature detectors are meaningful and can be interpreted in terms of detected combinations of digit substructures. This leads to a hierarchical image description that is distributed and sparse. When looking at the
5.5 Discussion
113
2.5 Structural Classifier TDNN Classifier Neural Abstraction Pyramid TDNN+Structural Pyramid+TDNN+Struct
% Substitution
2
1.5
1
0.5
0 0
1
2
3
4
5
6
7
8
9
% Reject
(a) 2.5
Structural Classifier TDNN Classifier Neural Abstraction Pyramid TDNN+Structural Pyramid+TDNN+Struct
% Substitution
2
1.5
1
0.5
0 0
1
2
3
4
5
6
7
8
9
% Reject (b) Fig. 5.7. Learning a hierarchy of sparse features – performance of different digit classifiers: (a) test set; (b) validation set.
best stimuli for the feature detectors, one can see that these are not similar in terms of a simple pixel-based distance measure, but in terms of their recursive decomposition to substructures. Hence, the pyramidal digit representation becomes increasingly invariant against distortions when going up in the hierarchy. The extracted features facilitate recognition of the digits. When used as input to an FFNN-classifier, the recognition performance observed was very satisfactory. It outperforms any single classifier that has been tested on that dataset and is about as good as the combination of the TDNN and the structural digit recognizer. When combined with these two classifiers, the recognition performance improves further.
114
5. Unsupervised Learning