Using digital technologies to test the Social Norms Approach to reducing electricity consumption Tim Harries Business School, Kingston University, Kingston Hill,
Ruth Rettie Business School, Kingston University, Kingston Hill,
Kingston-upon-Thames KT2 7LB, UK
Kingston-upon-Thames, KT2 7LB, UK
[email protected]
[email protected]
Matt Studley, Department of Engineering, University of the West of England, Frenchay Campus, Coldharbour Lane, Bristol, BS16 1QY, UK
[email protected]
An 18-week experimental intervention with 316 Bristol householders used digital technologies to collect and feed back hourly data on participants’ own electricity consumption and that of others in their neighbourhood. By providing digital feedback (by email and web) to two thirds of participants and only giving half of these the social data, the study set out to test the effectiveness of the social norms approach at reducing domestic electricity consumption in a UK setting. Initial findings suggest little difference between the impact of individual feedback and individual plus social feedback but point to the importance of the granularity of feedback data and the inclusion, in future research, of large samples, extended data collection periods and adequate experimental controls. Keywords: Social norms approach; framing; domestic electricity; greenhouse gases; households; mixed methods.
provided by two types of norms: descriptive norms, which describe what others do, and injunctive norms, which describe or imply what they ought to do (Cialdini, 2001). The approach deploys these norms in marketing campaigns that aim to change behaviours and has successfully been used to influence substance abuse (e.g. Neighbors et al. 2008), household recycling (Nomura et al., 2011) and hotel towel re-use (Goldstein et al., 2008).
1. INTRODUCTION Funded by the RCUK Digital Economy Programme, and part of the CHARM suite of studies, this research sought to test a behaviour change method known as the social norms approach. This approach had previously been used successfully in campaigns to reduce alcohol consumption and substance abuse and, in several US studies, had been shown to reduce household electricity consumption. The CHARM study set out to conduct a more rigorous test of the approach, using digital technologies to deliver feedback more frequently and cost-effectively; comparing the impacts of social feedback with those of feedback that only included information on individual consumption levels, and combining consumption analysis with surveys and in-depth exploratory research.
In the area of domestic energy consumption, three large-scale tests of the social norms approach have been conducted in the US (Schultz et al., 2007; Nolan et al., 2008; Allcott, 2011) and one smallscale test in the UK (Brandon and Lewis, 1999). The most recent and largest of these (Allcott, 2011) analysed experimental programmes in the US involving 600,000 households over two years. In these programmes, reports containing descriptive and injunctive social norms were posted to intervention groups with their normal electricity bills at bimonthly or quarterly intervals. While Schultz et al and Nolan et al had associated use of the social norms approach with reduction of between 4% and 7%, Allcott found that, after two years, the groups receiving social norms information had a 2% reduction in electricity use compared to households whose bills displayed only their own usage.
2. THE SOCIAL NORMS APPROACH Conventional approaches to behaviour change often assume a direct relationship between attitudes and behaviour (see McGuire, 1986). However, this long-disputed assumption is of limited validity for pro-environmental behaviours (for example Young et al., 2010), for which cognitive, attitude-driven decision-making should be viewed as a special case rather than as the norm (Bentler and Speckart, 1979).
3. THE CHARM RESEARCH
Other approaches emphasise the role of heuristic short-cuts, or “nudges”, that simplify or bypass decision-making. One such, the social norms approach, employs the phenomenon of conformity and relies on the notion that heuristics for the selection of effective adaptive behaviour are © The Authors. Published by BISL. Proceedings of BCS HCI 2012 Workshops Using Technology to Facilitate Behaviour Change and Support Healthy, Sustainable Living
The CHARM research involved 316 households from two wards in Bristol, UK: one affluent ward and one less affluent. Recruitment was conducted by a professional agency that was given a quota for the age of recruits and was told to recruit at
1
Using digital technologies to test the Social Norms Approach to reducing electricity consumption Tim Harries ● Ruth Rettie ● Matt Studley
weekends, weekdays and weekday evenings. Recruitment was door-to-door and included the offer of an £80 incentive. Recruits were randomly allocated to a control group, a group that received social norms information (the social norms group) or a group in which householders received information about their own consumption only (the individual group). The demographic make-up of the achieved sample is shown in Table 1.
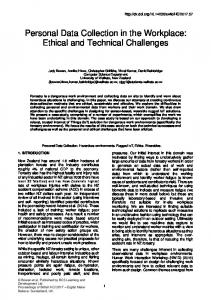
Graphs provided to members of the social norms group contained data not provided to those in the individual group. One additional line on the graph represented the average usage of other participants in the neighbourhood and another showed the average used by the 20% lowest consumers in the neighbourhood (see Figure 1). The graphs also included injunctive norms messages such as “Your energy consumption was
Table 1: Characteristics of the sample, shown as per cent Gender F M 59
41
Social class AB C2 C1 DE 68
32
16-34 18
Age 35-54 55-65 46
22
65+
Household structure Adults & Single Adults no kids adult kids
14
46
8
46
Experimental group Control Individual Social Norms 107
103
106
above average” or “Your energy consumption was just below average. Well done, keep it up!”
Participants received purpose-built monitoring devices capable of measuring consumption changes of 1 Watt or more. Each householder fitted onto their electricity meter a clamp that transmitted usage data at two-second intervals, via a local radio link, to a mains-powered monitor. This monitor sent hourly usage data to the study server via a mobile telephony service, with small flashing lights indicating that they were functioning properly.
Once they had installed their monitors, members of the control group were not asked to take any further action until after the end of the monitoring period. During the study, the only communication with this group was an Easter card posted during week 8 of the study. This thanked them for their participation and was intended to reassure them that they had not been forgotten and were still participating.
After an initial fortnight for the collection of baseline data, usage information and tips on saving electricity were communicated to the intervention groups for a period of 16 weeks between March and August 2011. Feedback and tips were delivered by email, SMS and personalised websites, with electricity use being depicted in four different graphs: consumption for the current day, consumption for the previous day and day-by-day consumption for the previous week and since the start of the study. On each graph, the horizontal axis represented the time of day and the vertical axis the kilowatt-hours used.
Five types of data were collected in the study: 1/ frequency with which participants viewed the graphs in the emails and on the web pages; 2/ electricity consumption; 3/ attitudinal and demographic data from a face-to-face recruitment survey and an online post-study survey, and transcripts of 4/ focus group interviews with three groups of eight social feedback participants and 5/ in-depth interviews with one participant from the control group, three from the individual group and 13 from the social norms group.
Figure 1: Example of the feedback provided to members of the social norms group 2
Using digital technologies to test the Social Norms Approach to reducing electricity consumption Tim Harries ● Ruth Rettie ● Matt Studley
4. FINDINGS
patterns between the US and the UK, where airconditioning and electric heating are less common. The mode and format of the feedback is a second key difference between CHARM and earlier studies. In the Schultz et al and Nolan et al studies, researchers took manual meter readings and handdelivered printed reports to participants’ doors. The more automated process used in CHARM may have reduced the social potency of the feedback; and the greater granularity of the CHARM data enabled participants to identify and target particular activities that led to the greatest electricity use.
The qualitative research indicates that participants found it easy to understand the graphical social norm feedback and, contrary to Roberts et al. (2007), were not adverse to social group feedback. In fact, feedback generated considerable interest and engagement – in spite of scepticism about whether the other homes in the study were comparable. Some participants, indeed, sought to maintain or achieve consumption levels within the ‘20% best’ range. Although this report draws on an initial, thematic analysis of the interviews and focus groups, its main focus is the analysis of the quantitative data. In this analysis, regression was used to assess the impact of the interventions on three outcome variables: engagement with the feedback, reported changes in electricity consumption and consumption change. While experimental group was the main predictor variable, demographic variables thought likely to have an influence were also included as predictors.
There is also the question of the duration of the consumption monitoring. Although he identified a smaller effect than the indicative change indicated by CHARM, Allcott (2011, p7) suggests that reductions in consumption were most evident twelve months after the first social norms feedback was provided. CHARM collected consumption data for 18 weeks and there is evidence that some behaviour changes may only have occurred after the end of this monitoring period. It is unclear whether householders’ perceptions of the relevance of the data distinguish CHARM from previous studies. Like Schultz et al (2007) and Nolan et al (2008), the CHARM study used averages that did not distinguish by house type or occupancy, while OPOWER’s proprietary algorithm allowed social norms feedback to base comparisons on data from broadly similar households. However, although some interviewees reported doubts over the relevance of the social norms data to their circumstances, interview data indicates that this did not necessarily reduce the effectiveness of the feedback.
The statistical analysis revealed that emails sent to the social-norms group were significantly more likely to be read than those sent to the individual group (N=232, B=.16, Standard error 2.32, p