http://dx.doi.org/10.14236/ewic/HCI2018.45
Presence and Navigation: a Comparison Between the Free Exploration of a Real and a Virtual Museum
Javier Marín-Morales Instituto de Investigación e Innovación en Bioingeniería València, Spain
[email protected]
Juan Luis Higuera-Trujillo Instituto de Investigación e Innovación en Bioingeniería València, Spain
[email protected]
Carla de Juan Instituto de Investigación e Innovación en Bioingeniería València, Spain
[email protected]
Carmen Llinares Instituto de Investigación e Innovación en Bioingeniería València, Spain
[email protected]
Jaime Guixeres Instituto de Investigación e Innovación en Bioingeniería València, Spain
[email protected]
Susana Iñarra Instituto de Investigación e Innovación en Bioingeniería València, Spain
[email protected]
Mariano Alcañiz Instituto de Investigación e Innovación en Bioingeniería València, Spain
[email protected]
The validity of environmental simulations resides in their capacity to replicate responses produced in a physical environment. However, no studies validate the similarity of navigation in immersive virtual environments, even though this can radically condition space perception and therefore alter the various evoked responses. The objective of this present paper is to validate environmental simulations using 3D environments and head-mounted display devices, at perception level by means of presence and at behavioural level through navigation. A comparison was developed between the free exploration of an art exhibition in a physical museum and a simulation of the same experience. At perception level, the virtual museum shows a high degree of presence. At navigation level, movement patterns show high similarity, and they present significant differences only at the beginning of the exploration in the percentage of area explored and the time taken to undertake the visits. The results suggest that there is an environmental adaptation effect of about 2 minutes. Subsequently, navigation in physical and virtual museums does not show significant differences. These findings support the use of immersive virtual environments as empirical tools in human behavioural research. Virtual Reality, Head-mounted display, human behaviour tracking, movement tracking, navigation, presence, immersive virtual environment, virtual real comparison
These simulations have a great variety of set-ups, which involve a combination of formats and supports (Mengoni, Germani, & Peruzzini, 2011). They have been progressively integrated into studies as the technology has evolved. On the one hand, among the formats - understood as the codification standard - photography and 3D environments can be highlighted. Photographs, including panoramic ones, provide us with non-interactive visual representations, whereas 3D environments can generate interactive representations. On the other hand, display devices - understood as the
1. INTRODUCTION Environmental simulations are representations of physical environments which allow researchers to compare reactions to common concepts (Kwartler, 2005). They become particularly relevant when what they represent cannot be physically represented. Therefore, they are widely employed in different areas related to human behaviour. Likewise, the emergence of virtual reality has generated a wide range of possibilities, not only at the scientific level, but also at the commercial level.
© Marín-Morales et al. Published by BCS Learning and Development Ltd. Proceedings of British HCI 2018. Belfast, UK.
1
Presence and navigation: a comparison between the free exploration of a real and a virtual museum Javier Marín-Morales ● Juan Luis Higuera-Trujillo ● Carla de Juan ● Carmen Llinares ● Jaime Guixeres ● Susana Iñarra Mariano Alcañiz
technological devices used to visualize the formats can be classified according to their capacity to isolate the user from physical reality (Rangaraju & Terk, 2001). Thus, there are non-immersive supports, such as the desktop type; semi-immersive, such as the cave automatic virtual environment (CAVE); and immersive, such as head-mounted displays (HMDs). The environments displayed through HMDs are called immersive virtual environments (IVE). Nowadays, the tendency is to use 3D environments and immersive support formats, given that their synergy offers a higher sense of presence (Sanchez-Vives & Slater, 2005), understood as the illusion of „being there‟ (Steuer, 1992). While these set-ups were, in the past, difficult to implement, they are now much more accessible (Parsons, 2015) and have improved performance.
The present work addresses this limitation. Specifically, the objective was to validate the environmental simulations by means of 3D IVEs, at perception level through presence and at behavioural level through navigation. The questions to be answered were: (a) what level of presence do the users of latest generation HMDs and 3D IVEs feel? and (b) how similar is navigation between a physical space and its virtualization using a 3D IVE and a latest generation HMD? A comparative study was conducted during a free exploration of an art exhibition in an actual museum and a virtual museum simulated by means of HTC Vive. The results may be of interest to researchers and content developers and are applicable to different fields. 2. MATERIAL AND METHODS
The usefulness of these representations for human behaviour research has been analysed through the concept of validity: the capacity to evoke a response from the user similar to one that might be evoked by a physical environment (Rohrmann & Bishop, 2002). The comparison between a physical space and its simulation through a 3D IVE has been studied at different levels. At a physiological level it has been found that they evoke responses more similar to the physical environment than other formats with lower interactivity capacity, although at the psychological level the validity decreases when compared to other formats, due to its lower realism (Higuera-Trujillo, López-Tarruella, & Llinares, 2017). Also, measured by psychological response, a relation has been found between sense of presence and the immersive capacity of HMDs (Baños et al., 2004) and the navigation metaphor (Usoh et al. 1999). Other studies have carried out comparisons between real and virtual spaces, analysing user performance in sets of everyday office-related activities (e.g. reading texts and identifying objects in an office environment) (Heydarian et al., 2015), physiological responses in different thermal conditions (Yeom, Choi, & Zhu, 2017), subjective perception of daylit spaces (Chamilothori, Wienold, & Andersen, 2018) and orienteering tasks (Kimura et al., 2017). However, no research has undertaken a comparison between a physical space and its virtualization through a HMD from the point of view of navigation, despite this being capable of radically conditioning the perception of the space and therefore altering the responses evoked. The studies concerning navigation and 3D environments have been carried out only with non-immersive or semiimmersive screens (Kuliga, Thrash, Dalton, & Hölscher, 2015; van der Ham, Faber, Venselaar, van Kreveld, & Löffler, 2015).
2.1 Participants A homogeneous group of 60 healthy subjects (age 28.9 ± 5.44, 40% men, 60% women) were recruited. The criteria were as follows: (i) (ii) (iii) (iv) (v)
Age between 20 and 40 Spanish nationality Not having formal, or informal, training in fine arts Not having previous experiences of HMDs Not having previously visited this particular exhibition
Two questionnaires were included to ensure that the subjects had healthy mental conditions and homogeneous emotional responses. First, the subjects were analysed by the Patient Health Questionnaire (PHQ) (Kroenke, Spitzer, & Williams, 2001). Only subjects with a value inferior to 5 were included to avoid including individuals in states of depression. Second, a selection of IAPS images (Lang, Bradley, & Cuthbert, 1997) were evaluated by the participants using the Self-Assessment Manikin (SAM) (Bradley & Lang, 1994). The images had a range of 3.41 to 7.24 in arousal and of 1.29 to 8.17 in valence (selected images: 7234, 5201, 9290, 1463, 9181, 8380, 3102, 4652). The participants‟ self-assessments were normalized by means of a z-score using the means and deviation published in the IAPS. Participants with evaluations outside of the range -2.58 and 2.58 (α=0.005) were excluded since they were considered outliers. 2.2 Physical museum During the first phase of the study, 30 subjects visited an actual museum to perform the test. The Institut Valencià d'Art Modern (IVAM) offered its facilities for the study.
2
Presence and navigation: a comparison between the free exploration of a real and a virtual museum Javier Marín-Morales ● Juan Luis Higuera-Trujillo ● Carla de Juan ● Carmen Llinares ● Jaime Guixeres ● Susana Iñarra Mariano Alcañiz
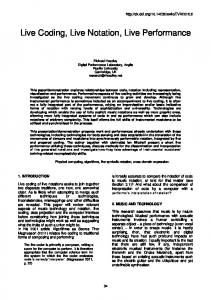
Figure 1: Plan of the art exhibition. Circles with an „“i” represent the artwork information boards. In room 3, the dashed line represents a limit that could not be crossed by the subjects.
The exhibition “Départ-Arrivée” by Christian Boltanski was selected due to its high emotional content, since its setting is the Nazi holocaust and because it was spacious enough to allow users to freely navigate. It consisted of five rooms with an approximate total floor surface area of 750 m2 (Figure 1). Each room is considered to be a single piece of art. In addition, the last room contained three art pieces that could be analysed independently. Furthermore, the rooms presented information boards with the artist‟s notes on the works. Finally, in Room 3 there was a path laid out from which subjects could not deviate.
2.3 Virtual museum During the second phase of the study the museum was virtualized using a 3D scenario. For this we used the Unity 5.1 game engine (www.unity3d.com). In order to achieve a scenario with maximum realism, we imported a threedimensional copy of the exhibition created by Rhinoceros v5.0 and textures partially derived from the physical environment. This process required the exhaustive and methodical drawing and photographing of the whole exhibition. Figure 3 shows the photos and screenshots of the virtual environment.
The subjects were told, before starting the experiment, that they could freely explore the first four rooms. In the last room, while they also could explore it freely, they had also to view, in detail, the three pieces of art in the room. The researcher waited for the subject at the exhibition exit, allowing the subjects to explore the space without any external influence.
For the simulation of the 3D VR, we compiled the scenario for HTC Vive (www.vive.com), which enabled us to carry out visual and displacement simulations. Visualization was conducted by means of a HMD with 2160x1200 pixels (1080×1200 per eye), and a field of view of 110 degrees working at 90Hz refresh rate. On the other hand, we conducted the displacements by means of a tracking technology made up of two controllers and two base stations that, together, enabled the subject to interact with the environment and physically move within an area of a 2x2 metres. Specifically, the metaphor used was the teleport navigation metaphor incorporated into the HTC Vive with a maximum teleportation radio of 2.5 metres from the subject. This was selected because we hypothesize that it will allow us to achieve pseudo-naturalistic navigation. The equipment was connected to the research computer (Predator G6, www.acer.com) by means of a DisplayPort 1.2 and USB 3.0 and ran smoothly and without interruption.
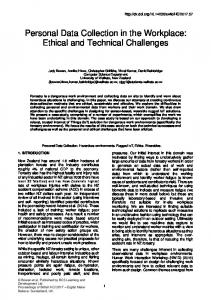
To record the subjects‟ navigation a GoPro camera was used. The subjects carried this attached to their chests by means of a harness (Figure 2).
After the environmental simulation of the art museum had been created, the study was replicated using the 3D IVE with the second group of 30 subjects in a lab environment. Figure 4 shows a subject exploring the virtual museum.
Figure 2: Example of a subject in the physical museum.
3
Presence and navigation: a comparison between the free exploration of a real and a virtual museum Javier Marín-Morales ● Juan Luis Higuera-Trujillo ● Carla de Juan ● Carmen Llinares ● Jaime Guixeres ● Susana Iñarra Mariano Alcañiz
Figure 3: Comparison between a photograph of the physical museum (left) and a screenshot of the virtual museum (right). From top to bottom, Room 1, Room 2, Room 3 and Room 5.
Before starting the experiment, the subjects carried out several tasks to adapt themselves to the HMD device and to the navigation metaphors, in a neutral scenario, without textures. The researcher ensured that the subject adapted correctly and navigated fluently. The subjects could stay in this scenario for as long as they wanted, until they
considered that they could use the device without difficulty. During this period, the researcher addressed any doubts raised by the subjects about the HMD device, given that they had no previous HMD experience. Figure 5 shows a screenshot of a training environment.
4
Presence and navigation: a comparison between the free exploration of a real and a virtual museum Javier Marín-Morales ● Juan Luis Higuera-Trujillo ● Carla de Juan ● Carmen Llinares ● Jaime Guixeres ● Susana Iñarra Mariano Alcañiz
The software shows at the same time two items: a video recording of the subjects‟ exploration of the exhibition and a plan of the exhibition. It includes two buttons that can advance and rewind the video with 1-second jumps. In addition, it allows the position of the subjects to be manually entered into the plan, using the video as a reference. The researcher reviewed all the videos, positioning the subjects in the plans at 1-second intervals. Finally, the navigation path was saved to a file with the route sampled every second. Regarding navigation in the virtual museum, a script in Unity was developed which recorded the subjects‟ positions at a frequency of 7Hz while he or she was exploring the scenario and exported them to a csv file at the end of the test. Finally, the recorded navigation path was resampled to the same frequency as the path generated in the physical space (1 Hz).
Figure 4: Example of a subject viewing the virtual museum.
2.5 Spatial segmentation and analysis The analysis of the subjects‟ navigation was based on the framework developed by Marín-Morales et al. (Marín-Morales, Torrecilla, Guixeres, & Llinares, 2017). This proposes the segmentation of space into Areas of Interest (AOI) on which several indicators are calculated to characterize navigation. The museum is comprised of eight AOIs, the five rooms and the three pieces of art in the last room. The area of each room is defined by its walls, and each of the three works of art by the area where they are viewed (Figure 3). The analysis was carried out based on two items: the trajectories and the length of time of the visits.
Figure 5: Screenshot of the training environment.
After the training, the researcher gave the subjects the same instructions as were given to subjects who had visited the physical museum. During the experiment, the researcher remained in an adjoining room. Finally, the researcher was able to note through the monitor when the subject arrived at the exit of the "museum" and then removed the HMD device. Following the test, the subject had to answer a presence questionnaire, the “SUS questionnaire” (Martin Usoh, Catena, Arman, & Slater, 2000). This consists of six items assessed from 1 to 7 using a Likert scale to measure three aspects of presence: (i) (ii) (iii)
For the trajectory analysis, the well-known heatmaps and the average of percentage of area explored were used. Heatmaps were created using every point of the subjects‟ trajectories at 1 Hz. Subsequently, a radius of 0.75 m was applied to each position, defining that each subject‟s presence spans a circle of 1.5m in diameter. Considering that heatmaps are usually relative to themselves, i.e. they adapt the colours to the maximum and minimum values that they represent in each case, both heatmaps were constructed according to the same linear representation scale, allowing them to be comparable between themselves. 5% of the pixels with the highest values were dismissed and were saturated in red to increase the sensitivity of the heatmap. On the other hand, we calculated the percentage of area explored in each AOI by each user, considering that the area explored is calculated with the centroids of the subject‟s navigation points with a radius of 0.75 metres.
The experience of being inside the simulation. The consideration of the simulation as the dominant reality. The memory of the simulation as a place.
2.4 Signal synchronization Regarding navigation in the physical museum, software was developed using the “Microsoft Virtual Studio” in C++ language to synchronize the data.
Regarding the length of the visits, a visit is defined as the period of time from when a subject enters an AOI to the moment he or she leaves it. In particular,
5
Presence and navigation: a comparison between the free exploration of a real and a virtual museum Javier Marín-Morales ● Juan Luis Higuera-Trujillo ● Carla de Juan ● Carmen Llinares ● Jaime Guixeres ● Susana Iñarra Mariano Alcañiz place similar to other places that I‟ve been today 6. During the experience I often thought that I was really in the museum space
the variable being analysed is the length of time of the main visit to each of the AOIs, defined as that visit with the longest duration in the case that an AOI was visited more than once by the same subject. Processing assured that the variable included the main visit to the room or piece of art: if there were less than 15 seconds between two visits to the same AOI, the visits were put together and considered as just one visit.
Figure 6 shows the heatmaps of the trajectories in the physical and virtual museums. Carrying out a descriptive analysis room by room, it is observed that: (i)
3.1 Presence Table 1 shows the results of presence provided by the SUS questionnaire. Two items are between 6 and 7: “I had a sense of „being there‟ in the museum space” and “During the experience I often thought that I was really in the museum space”. Another two items are between 5.50 and 6: “There were times during the experience when the museum space was the reality for me" and "During the experience you felt you were in the museum space”. Finally, the two remaining items are below 5. The total average of the set of items is 5.47 out of 7 so the level of presence of the simulation is high.
(ii)
(iii)
(iv)
Table 1: Results of presence (SUS Questionnaire).
1. I had a sense of „„being there‟‟ in the museum space. 2. There were times during the experience when the museum space was the reality for me. 3. The museum space seems to me to be like somewhere that I visited before 4. During the experience you felt you were in the museum space 5. I think of the museum space as a
Score Mean
SD
6.17
0.95
5.86
0.95
4.87
1.91
5.87
1.17
3.93
2.26
0.94
3.2 Trajectory
3. RESULTS
Question
6.13
(v)
6
In Room 1, the exploration is more dispersed in the physical museum. In addition, the participants are very focused on the information board in the physical museum. In Room 2, the trajectories are similar. However, taking into account that the natural path is that presented in the physical museum, the subjects´ trajectories deviated slightly from these natural paths in the virtual museum, being a bit more dispersed. Similarly, the information board was scarcely visited in the virtual museum. In Room 3, the trajectories are very similar and there are no differences, except that some subjects ignored to a small extent the limitations set by the exhibition organizers. In Room 4, there are no differences among the trajectories, except for the same effect mentioned for Room 2. In Room 5, there are no differences, except for the trajectory relevant to piece of art 3, where the subjects notably stopped at the information board in the physical museum, whereas the trajectories were much more dispersed in the virtual museum. It is noteworthy that, both in the physical and the virtual museum, a light spot can be seen in the middle of the room, caused by the subjects who visualised the room from its central point.
Presence and navigation: a comparison between the free exploration of a real and a virtual museum Javier Marín-Morales ● Juan Luis Higuera-Trujillo ● Carla de Juan ● Carmen Llinares ● Jaime Guixeres ● Susana Iñarra Mariano Alcañiz
Figure 6: Heatmaps of the physical museum (top) and the virtual museum (bottom). They indicate the different AOIs and the positions of the information boards.
Table 2 shows the percentage of the area of each AOI explored and the difference between both conditions. Due to the Gaussianity of data (p < 0.05 from Shapiro-Wilk test with null hypothesis of having a Gaussian sample), a T Test was applied. The percentage of area explored is higher in the physical museum for all AOIs, significant differences being observed in Room 1, Room 3 and for piece of art 1. The AOI with greatest absolute difference is Room 1, reaching 15.40%, whereas the others are below 6%.
PIECE OF ART 2 PIECE OF ART 3
ROOM 1 ROOM 2 ROOM 3 ROOM 4 ROOM 5 PIECE OF ART 1
Virtual museum 18.62% (8.16) 30.58% (11.39) 25.31% (2.71) 24.93% (6.31) 42.54% (8.33)
99.98% (0.06)
94.87% (18.55)
Difference +15.40%
Pvalue 0.00 (***)
+4.84%
0.09
+2.18%
0.00 (***)
+3.22%
0.08
+0.85%
0.65
+5.10%
0.00 (***)
+5.63% -
0.07
43.53% (11.47)
40.64% (13.23)
+2.90%
0.38
Figure 7(a) shows the length of time of the main visit to each AOI in the physical and virtual museums using mean and standard deviations. Due to the Gaussianity of data (p < 0.05 from Shapiro-Wilk test with null hypothesis of having a Gaussian sample), a T Test was applied. Only in Room 1 (p-value=0.00) and Room 2 (p-value=0.03) were there significant differences, since subjects stayed for less time in the virtual museum. However, as can be seen at Figure 7 (b), p-value increases as the subjects progress through the AOIs. Considering that the visit to the rooms is sequential, this also indicates that the p-value increases as time progress.
Percentage of area explored Physical museum 34.02% (11.79) 35.42% (9.85) 27.49% (2.37) 28.16% (7.22) 43.39% (5.85)
57.40% (11.20)
3.3 Length of visit time
Table 2: Results of the percentage of area explored. Results are presented for each AOI and condition using the mean and the standard deviation, the difference between both conditions and the p-value of the T Test.
AOI
63.03% (12.10)
7
Presence and navigation: a comparison between the free exploration of a real and a virtual museum Javier Marín-Morales ● Juan Luis Higuera-Trujillo ● Carla de Juan ● Carmen Llinares ● Jaime Guixeres ● Susana Iñarra Mariano Alcañiz
Figure 7(a): Representation of timings for the main visit to each AOI. Bars represent the average and lines represent the standard deviation. Figure 7(b): The blue line represents the p-value obtained by T Tests for each AOI, whereas the dashed red line marks the limit of 0.05, which indicates that the comparison is significant when p-value is lower.
has a central object that tends to be avoided (Figures 1 and 3). It is seen that the subjects walk around this object in the physical museum, forming a clear rectangle in their trajectories, whereas, in the virtual museum, they tend to do the same but not so obviously. This implies subtle differences in patterns when the subjects try to avoid obstacles. Room 3 shows a similar pattern. Nevertheless, there are significant differences in the percentages of areas explored. These differences may be caused by the fact that it was not possible in the virtual museum to leave the indicated path whereas, in the physical museum, some subjects strayed into prohibited zones. In Room 4, there are no significant differences among the patterns, not even in the area explored percentage, except for the effect described for Room 2. In the last Room, no significant differences were observed in the heatmap patterns at the exploration or trajectory levels. Moreover, it was noted that the same pattern is seen when moving between the pieces of art, the observation from the central point of the room and the exit from the exhibition. For piece of art 1, we find significant differences although, in both cases, the percentage of area explored is more than 90%, so it does not represent a substantial difference. For piece of art 2, there are no differences. For piece of art 3, there are no significant differences in exploration, but a more dispersed pattern is detected in the heatmap. Therefore, considering the exploration, the major
4. DISCUSSION The aim of this study is to validate environmental simulations made by means of 3D IVEs and a latest generation HMD, at presence and navigation levels. Regarding sense of presence, an overall average of 5.47 (out of 7) was reached in the SUS questionnaire. It reached more than 6 in questions such as “I had a sense of „„being there‟‟ in the museum space” and “During the experience I often thought that I was really in the museum space”. The results are considered to be high, taking into account the previous results reported by studies using similar technologies (Sas & O‟Hare, 2003) and, therefore, they support the use of the present set-up. With regard to navigation, trajectories and the lengths of visits to AOIs were analysed. The heatmaps show similar navigation patterns between the physical and the virtual museum. Room 1 shows the biggest differences between exploration and heatmaps, with 15.40% more area being explored in the physical environment. The heatmaps do not show the same pattern. These differences may be because, in the first room, the subject is still adapting to the IVE. The second room has no significant differences either at the exploration level or with the path patterns in the heatmap. This room
8
Presence and navigation: a comparison between the free exploration of a real and a virtual museum Javier Marín-Morales ● Juan Luis Higuera-Trujillo ● Carla de Juan ● Carmen Llinares ● Jaime Guixeres ● Susana Iñarra Mariano Alcañiz
difference is observed in Room 1. In addition, differences were found for all the information boards. Current HMD technologies have difficulty reading medium or small texts. This problem might be solved by an increase in the resolution of the HMD systems. Finally, the similarity of the navigation paths shows that the navigation metaphor used with 2.5 metres of radius, and physical movement within an area of a 2x2 metres, provides the user with pseudo-naturalistic navigation.
conclusions support the use of environmental simulations by means of 3D IVEs and HMDs as empirical tools to study human behaviour at presence and navigation levels, and raise interesting points to be considered in future commercial or research studies. 6. ACKNOWLEDGEMENTS This work was supported by Ministerio de Economía y Competitividad de España (Project TIN201345736-R); Dirección General de Tráfico, Ministerio Del Interior de España (Project SPIP2017-02220); and the Institut Valencià d'Art Modern.
With regard to the length of the visits, there were significant differences only in Room 1 (p-value=0.00) and Room 2 (p-value=0.03). In both rooms, the virtual museum shows visit lengths considerably shorter than for the physical museum. Room 3 also presents a shorter time in the virtual museum, but this difference is no longer significant. The p-value tendency reflected in Figure 7b clearly shows that, as the study progressed, the length of visit to each AOI became more similar to the time spent with these AOIs in the physical museum. Consequently, and despite the existence of a training phase, it is necessary to allow a period of adaptation in the main scenario until behaviours at the navigation level are similar to those in the physical space that it simulates. In this study, as the average length of visit to Room 1 and Room 2 are as shown in Figure 7, this period of adaptation was approximately 2 minutes. For future studies, we would recommend that a period of approximately 2 minutes be allowed for previous free navigation to eliminate this effect. However, it must be borne in mind that these results come from subjects with no prior experience of HMDs. In the future, if more of the population have wider experience of these devices, this adaptation period will probably be reduced or even be unnecessary.
7. REFERENCES Baños, R. M., Botella, C., Alcañiz, M., Liaño, V., Guerrero, B., & Rey, B. (2004). Immersion and Emotion: Their Impact on the Sense of Presence. CyberPsychology & Behavior, 7(6), 734–741. https://doi.org/10.1089/cpb.2004.7.734 Bradley, M. M., & Lang, P. J. (1994). Measuring emotion: The self-assessment manikin and the semantic differential. Journal of Behavior Therapy and Experimental Psychiatry, 25(1), 49–59. https://doi.org/10.1016/00057916(94)90063-9 Chamilothori, K., Wienold, J., & Andersen, M. (2018). Adequacy of Immersive Virtual Reality for the Perception of Daylit Spaces: Comparison of Real and Virtual Environments. LEUKOS - Journal of Illuminating Engineering Society of North America, 0(0), 1–24. https://doi.org/10.1080/ 15502724.2017.1404918
5. CONCLUSIONS
Heydarian, A., Carneiro, J. P., Gerber, D., BecerikGerber, B., Hayes, T., & Wood, W. (2015). Immersive virtual environments versus physical built environments: A benchmarking study for building design and user-built environment explorations. Automation in Construction, 54, 116–126. https://doi.org/10.1016/j.autcon.2015.03.020
The virtual museum shows a high degree of presence. It implies validation of the use of 3D IVEs with devices such as HTC Vive at the perception level and, particularly, in environments with a high emotional content such as museums. In terms of navigation, the physical museum was explored more, although there were significant differences only in Room 1. The pattern of trajectories observed in the heatmaps is very similar, although there were differences in the information boards since their medium-sized and small lettering is still not easily read in HMDs. Regarding the length of the visits the adaptation period was 2 minutes approximately, even though there was a training room. After this initial period, there were no significant differences among the visit lengths in both museums. We would advise that an initial adaptation period should be considered for future studies using the current setup with subjects with no experience of HMDs. These
Higuera-Trujillo, J. L., López-Tarruella, J., & Llinares, M. C. (2017). Psychological and physiological human responses to simulated and real environments: A comparison between Photographs, 360° Panoramas, and Virtual Reality. Applied Ergonomics, In Press. https://doi.org/10.1016/j.apergo.2017.05.006 Kimura, K., Reichert, J. F., Olson, A., Pouya, O. R., Wang, X., Moussavi, Z., & Kelly, D. M. (2017). Orientation in Virtual Reality Does Not Fully Measure Up to the Real-World. Scientific
9
Presence and navigation: a comparison between the free exploration of a real and a virtual museum Javier Marín-Morales ● Juan Luis Higuera-Trujillo ● Carla de Juan ● Carmen Llinares ● Jaime Guixeres ● Susana Iñarra Mariano Alcañiz
Reports, 7(1), 6–13. https://doi.org/10.1038/s41598-017-18289-8
Sanchez-Vives, M. V. V., & Slater, M. (2005). From presence to consciousness through Virtual Reality. Nature Reviews Neuroscience, 6(4), 332–339.
Kroenke, K., Spitzer, R. L., & Williams, J. B. W. (2001). The PHQ-9: Validity of a brief depression severity measure. Journal of General Internal Medicine, 16(9), 606–613. https://doi.org/10.1046/j.15251497.2001.016009606.x
Sas, C., & O‟Hare, G. M. (2003). Presence Equation: An Investigation into Cognitive Factors Underlying Presence. Presence: Teleoperators and Virtual Environments, 12(5), 523–537.
Kuliga, S. F., Thrash, T., Dalton, R. C., & Hölscher, C. (2015). Virtual reality as an empirical research tool - Exploring user experience in a real building and a corresponding virtual model. Computers, Environment and Urban Systems, 54, 363–375. https://doi.org/ 10.1016/j.compenvurbsys.2015.09.006
Steuer, J. (1992). Defining Virtual Reality: dimensions determining telepresence. Journal of Communication, 42(4), 73–93. Usoh, M., Arthur, K., Whitton, M. C., Bastos, R., Steed, A., Slater, M., & Brooks, F. P. (1999). Walking> walking-in-place> flying, in virtual environments. In W. Waggenspack (Ed.), Proceedings of the 26th annual conference on Computer graphics and interactive techniques (pp. 359–364). ACM Press/Addison-Wesley Publishing.
Kwartler, M. (2005). Visualization in support of public participation. In I. Bishop & E. Lange (Eds.), Visualization in landscape and environmental planning: technology and applications (pp. 251–260). London, UK: Taylor & Francis.
Usoh, M., Catena, E., Arman, S., & Slater, M. (2000). Using Presence Questionnaires in Reality. Presence: Teleoperators and Virtual Environments, 9(5), 497–503. https://doi.org/10.1162/105474600566989
Lang, P. J., Bradley, M. M., & Cuthbert, B. N. (1997). International Affective Picture System (IAPS): Technical Manual and Affective Ratings. NIMH Center for the Study of Emotion and Attention, 39–58. https://doi.org/10.1027/0269-8803/a000147
van der Ham, I. J. M., Faber, A. M. E., Venselaar, M., van Kreveld, M. J., & Löffler, M. (2015). Ecological validity of virtual environments to assess human navigation ability. Frontiers in Psychology, 6(May), 1–6. https://doi.org/10.3389/fpsyg.2015.00637
Marín-Morales, J., Torrecilla, C., Guixeres, J., & Llinares, C. (2017). Methodological bases for a new platform for the measurement of human behaviour in virtual environments. DYNA, 92(1), 34–38. https://doi.org/http://dx.doi.org/10.6036/7963
Yeom, D., Choi, J.-H., & Zhu, Y. (2017). Investigation of the Physiological Differences between Immersive Virtual Environment and Indoor Enviorment in a Building. Indoor Adn Built Enviornment, 0(0), Accept. https://doi.org/10.1177/1420326X17731945
Mengoni, M., Germani, M., & Peruzzini, M. (2011). Benchmarking of virtual reality performance in mechanics education. International Journal on Interactive Design and Manufacturing, 5(2), 103–117. Parsons, T. D. (2015). Virtual Reality for enhanced ecological validity and experimental control in the clinical, affective and social neurosciences. Frontiers in Human Neuroscience, 9, 660. Rangaraju, N., & Terk, M. (2001). Framework for immersive visualization of building analysis data. In E. Banissi, F. Khosrowshahi, M. Sarfraz, & A. Ursyn (Eds.), Fifth International Conference on Information Visualisation (pp. 37–42). London, UK: IEEE. Rohrmann, B., & Bishop, I. D. (2002). Subjective responses to computer simulations of urban environments. Journal of Environmental Psychology, 22, 319–331. https://doi.org/10.1006/jevp.2001.0206
10