6.2
A STATISTICAL-DISTRIBUTED MODELING APPROACH FOR FLASH FLOOD PREDICTION
Seann Reed*, John Schaake, Victor Koren, DongJun Seo, and Michael Smith Hydrology Laboratory, Office of Hydrologic Development National Weather Service, NOAA, Silver Spring, Maryland
1.
INTRODUCTION
Perhaps the biggest potential gain from the use of distributed hydrologic models in flood forecasting is to increase the spatial resolution of forecasts. Higher resolution hydrologic forecasts can provide information in flash flood situations; however, an important question to consider in evaluating higher resolution forecasts is whether or not larger simulation uncertainties at smaller scales will diminish the utility of these forecasts, and, if so, to what degree? The statistical-distributed modeling approach is proposed to simulate floods on small basins and account for hydrologic modeling uncertainty. This modeling approach should enhance our ability to predict the occurrence of flash flooding. The approach offers an alternative to the current National Weather Service (NWS) Flash Flood Guidance (FFG) system and inherently addresses FFG limitations (discussed below). Two goals of this study are to: •
Define, develop, and evaluate a statisticaldistributed framework for predicting relative flood severity at flash flood scales (typically ungauged locations).
•
In doing so, characterize hydrologic simulation uncertainties across a wide range of scales using operational quality radar-based precipitation data.
Use of the Office of Hydrologic Development (OHD) Hydrology Laboratory Research Modeling System (HLRMS) (Koren et al., 2003) will facilitate this project. HLRMS includes a grid-based, distributed hydrologic model designed to efficiently ingest NWS radar-based precipitation products. The computational efficiency of the model and the well-defined procedures for getting initial, a priori parameter estimates make this project feasible. This paper describes the basic scale issues being addressed, the proposed methodology, and initial basin selection. ____________________________________________ *Corresponding author address: Seann Reed, w/OHD12, 1325 East-West Highway, Silver Spring, MD 20910; e-mail:
[email protected].
A few example results are used in this paper to illustrate the approach. More results will be presented at the conference in January. 2.
SCALE ISSUES
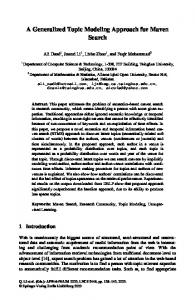
Three limitations of the current FFG science are (1) the use of lumped rainfall-runoff models which don’t account for the spatial and temporal differences between RFC basin scales and flash flood scales, (2) misuse of threshold runoff as an area averaged property rather than a characteristic of a point along the channel, and (3) large uncertainties in defining threshold runoff at ungauged locations using the available empirical relationships. The use of a distributed model inherently solves the first two problems. Use of the statisticaldistributed modeling approach will address some of the uncertainty issues. Relative simulation errors from hydrologic models tend to increase with decreasing spatial scales. Numerous sensitivity studies have shown that models are sensitive to the spatial and temporal scales of the computations and to the resolution of rainfall inputs (e.g. Finnerty et al., 1997; Winchell et al., 1998; Koren et al., 1999; to name a few); however, no study has systematically computed simulation errors relative to observed streamflow over the wide range of basin sizes in which we are interested. Although independent studies in the literature report results for basin of various sizes, it is difficult to compare the accuracy of these published results due to differences in the statistics reported, the models used, the quality of input forcing, and the climate regime. HL-RMS simulation results from the Distributed Model Inter-comparison Project (DMIP) (Smith et al., 2003; Reed et al., 2003) in Figure 1 show an increase in the percent peak error prediction for the three smallest basins in the study. Other models in DMIP agreed with this trend. The trend of increased errors for smaller basins is a little stronger in the calibrated results when compared with uncalibrated results because there was no explicit calibration using observed data for the three smallest basins. Even so, the scenario of calibrating large basins with limited calibration or no calibration at interior points is realistic when considering real-world data constraints.
difficulty that still remains is how to define the probability associated with flooding flow (discussed more in the next section).
Percent Peak Error
120.0
80.0
40.0
0.0 0
1000
2000
3000
The effectiveness of a statistical-distributed approach compared to a distributed approach can be assessed at locations with observed data. For example, Figure 2 shows a plot of the joint probability distribution of simulated and observed peaks for the 34 largest flood events occurring at USGS gauge 07194800 (Illinois 2 River at Savoy, OK; drainage area is 433 km ) between January 1, 1999, and July 1, 2000. The simulations are from the HL-RMS distributed model.
Drainage Area (km2) Calibrated
Uncalibrated
Figure 1. Percent error in simulated peaks from the HLRMS distributed model (averages for approximately 20 events per basin) versus drainage area for the DMIP basins. Also in DMIP basins, Carpenter and Georgakakos (2003) compute uncertainty estimates across a wide 2 range of scales (50 – 2000 km ) using Monte Carlo ensemble simulations. Their theoretical results indicate a significant increase in uncertainty with decreasing scale; however, the accuracy of their results is difficult to confirm given the limited number of stream gauges at interior locations in this small region. In this study we hope to broaden our knowledge of simulation uncertainties at small scales by running simulations on many gauged basins of various sizes. Flash floods typically occur in basins smaller than 300 2 km with times of concentration less than 12 hours. RFCs typically calibrate river forecasting models for 2 2 basins ranging in size from 300 km up to 5000 km . Although the target application for the proposed methodology is small basins, some large basins will be analyzed to contrast results obtained at different scales. 3.
METHODOLOGY
3.1. The Statistical-Distributed Approach The statistical-distributed approach requires running a distributed model using archived radar-rainfall grids to derive flood probability characteristics of simulated flows for all cells in the distributed model. When subsequently running the distributed model in forecast mode, the flooding flow threshold for each grid cell is defined in terms of a flood probability level rather than an absolute value of flow. In this manner, the flooding flow computed from simulated data is different than that computed from observed data because it takes into account the hydrologic model uncertainty. Implementing this approach in the distributed modeling framework provides a consistent, physical basis for predicting floods at ungauged locations. A
For illustration purposes only, the flooding flow is set to 178 cms, which corresponds to a non-exceedance probability of 0.71 based on the observed events in this example. The solid vertical line in Figure 2 is drawn at the corresponding non-exceedance probability level on the simulation axis. The dashed vertical line is drawn at the non-exceedance probability corresponding to a flow of 178 cms based on simulated events (0.8). The difference between the dashed and solid vertical lines represents the model error. Using the statistical-distributed approach, the solid vertical line is used as the flood threshold, yielding forecast hits in areas B and C, forecast misses in area A and forecast false alarms in areas E and F. A distributed modeling approach would use the dashed line as the flood threshold, yielding hits in area C, misses in areas A and B, and false alarms in area F. For the events in this example, the statistical-distributed approach would have yielded 7 hits, 3 misses, and 3 false alarms and a distributed approach would have yielded 5 hits, 5 misses, and 2 false alarms. This example is meant only for illustration purposes, and the results from Figure 2 are much too limited to make general conclusions about the effectiveness of the approach.
Corresponding flow s (cms) 84.6 178 Observed Non-exceedance Prob.
1 0.8
A
B
C
D
E
F
0.71 0.6 0.4 0.2 0 0
0.2
0.4
0.6 0.71 0.8
1
Simulated Non-exceedance Prob.
Figure 2. Joint probability pairs of simulated and observed peaks for 34 storm events at the Savoy, OK stream gauge.1 3.2. The Flooding Flow Problem There are two levels of difficulty in defining the flooding flow. The first is to distinguish between a hydraulic definition of flooding flow such as bankfull and a more pragmatic definition such as a damage level. In some localities, warning at the bankfull level would be too conservative (e.g. low water crossings and canyons) while in other localities an overbank flood may cause minimal risk and no damage. To be practical, initial evaluations of the proposed approach will use the bankfull definition. A second difficulty is that there is a lot of uncertainty in defining bankfull flow. Although measurements for some locations are available in the literature, no comprehensive and consistently measured database of bankfull flow estimates is available for small streams in the United States. Although empirical evidence suggests that bankfull floods often occur with a return period of between 1 and 2 years, there is a lot of scatter in these data and variation from one location to the next. Recent work by Dr. Boyko Dodov, University of Minnesota (personal communication), suggests that part of this variation in fluvial channels may be explained by defining the frequency associated with flooding as a function of drainage area. For this study, we can define a simple strategy for estimating bankfull flow as a function of scale and evaluate the performance of the statistical-distributed approach when this strategy is used. 3.3. Data Sets and Basin Selection The required data sets for the proposed analysis include an archive of multi-sensor precipitation grids,
peak flow measurement data from the USGS and provisional instantaneous flow data (sometimes referred to as “unit” data by the USGS) where available, and mean daily flow data. Initial analysis will be done in ABRFC and WGRFC. ABRFC has the longest archive of multi-sensor precipitation products in the country, starting in June, 1993, and WGRFC also has a reasonably long archive, starting in January, 1996. Snow effects are expected to be minimal in the basins selected. Another reason for starting with these areas is that much complementary research for basins in these RFCs is ongoing at OHD. Given the nature of the multi-sensor radar-rainfall archives currently available (hourly, 4 km), the initial phase of this study will target basins in the 130 – 1500 2 2 km size range. A 130 km basin is approximately the smallest that can be reasonably represented by a 4 km cell-to-cell network (Reed, 2003). The tools to complete the first phase of this study are in hand. Results from the first phase will help guide future studies on basins 2 Although additional data smaller than 130 km . processing to develop higher resolution models (e.g. 1 or 2 km) will be required to evaluate results on smaller basins, no substantial changes will be required to the basic HL-RMS algorithms. A basin screening process has begun. Basins are selected such that the USGS peak flow data are available for the same time period covered by the multisensor precipitation archive. A second criterion is that peak flows should not be affected by factors not accounted for in the current modeling system (e.g. regulation and diversion). Data flags in the USGS peak flow data are used to screen out basins with these currently unmodeled characteristics. For WGRFC, additional manual screening is used to eliminate basins where it is known or suspected that significant interbasin transfers through karst groundwater aquifers may occur. Table 1 lists the number of basins remaining after various steps in the basin screening process for ABRFC and WGRFC.
Table 1. Number of stations remaining after various stages in the basin screening process. No. of Stations Remaining ABRFC WGRFC 407 537
Criteria Station record overlaps with radar data No undesirable peak 168 257 qualification codes No missing annual peak 80 100 data in the expected analysis period 38 69 For Phase 1: Basins ranging in size from 130 – 2 1500 km At least one fairly 9 34* substantial event occurs during the planned validation period (2001 2002) * Will be reduced based on additional manual screening. 3.4. Validation Strategy The availability of a priori parameter estimation techniques for HL-RMS will facilitate rapid testing on many basins. Initial evaluations of the approach will be primarily using uncalibrated model parameters. This blind testing is intended to evaluate how effective the approach can be in ungauged locations. The testing strategy will include the following general steps: (1) Specify an exceedance probability associated with flooding at each model cell (perhaps initially as a simple function of drainage area). (2) Simulate floods for a period up through 2000 (reserving data from 2001 and 2002 for validation) and estimate the flow associated with the flooding exceedence probability defined in step 1. (3) Using the available observed data, determine the number of hits, misses, and false alarms that would occur if predicting floods during the validation period for both the statistical-distributed approach and a distributed approach. (4) Devise a method to compare these predictions with what would have been predicted using archived FFG data. We don’t know for sure how long a period of record will be required to demonstrate the utility of the approach. Since the system is primarily intended to predict floods that may occur every few years rather than extreme floods, the method may yield success without requiring a long archive of data. It will also be important to quantify the water balance for the basins modeled to ensure that the results are
reasonable, especially given that uncalibrated parameters will be used for initial simulations. Limited initial simulations using uncalibrated parameters in the ABRFC and WGRFC areas have been promising. 3.5. Variations Research to improve the HL-RMS model and the available input forcing data is ongoing. Several developments expected in the next year can and should be evaluated for the basins identified for this project. For example, (1) What benefits can a re-analysis of the multi-sensor precipitation archives offer? (2) What difference can refined a priori parameters using more detailed GIS data sources make (for both rainfall-runoff and hillslope/channel routing)? (3) Without resorting to a full calibration effort, what difference can simple parameter adjustments to improve the overall water balance make? 4.
SUMMARY
The goal of the statistical-distributed modeling method is to quantify uncertainties in our ability to forecast flash floods given currently available precipitation data and currently available continuous, distributed modeling software (HL-RMS). Use of a distributed model addresses scale issues. The ‘statistical’ part of the approach accounts for the increased uncertainties expected at smaller scales and ungauged locations where calibration is not possible. While the statistical-distributed approach cannot, by itself, answer the question of what flood probability level represents a risk, the approach is expected to provide more spatially explicit and physically consistent estimates of relative flood severity compared to what is currently provided by FFG. Using parameter estimation techniques developed for HL-RMS, the proposed approach can be evaluated on a relatively large number of basins. An initial set of basins in WGRFC and ABRFC have been identified for analysis. Although not available for this preprint, results for several of these basins will be presented at the conference. REFERENCES Carpenter, T.M., Georgakakos, K.P., 2003. Impacts of Parametric and Radar Rainfall Uncertainty on the Ensemble Streamflow Simulations of a Distributed Hydrologic Model, Journal of Hydrology, accepted for the upcoming DMIP special issue. Finnerty, B. D., Smith, M.B., Seo, D.J., Koren, V., Moglen, G.E., 1997. Space-time scale sensitivity of the
Sacramento model to radar-gage precipitation inputs, Journal of Hydrology, 203, 21-38. Koren, V.I., Finnerty, B.D., Schaake, J.C., Smith, M.B., Seo, D.J., Duan, Q.Y, 1999. Scale dependencies of hydrologic models to spatial variability of precipitation, Journal of Hydrology, 217, 285-302. Koren, V., Reed, S., Smith, M., Zhang, Z., Seo, D. J., 2003. Hydrology Laboratory Research Modeling System (HL-RMS) of the National Weather Service, Journal of Hydrology, accepted. Reed, S., Deriving Flow Directions for Coarse Resolution (1 - 4 km) Gridded Hydrologic Modeling, 2003. Water Resources Research, accepted. Reed, S., Koren, V., Smith, M., Zhang, Z., Moreda, F., Seo, D.J., and DMIP Participants, 2003. Overall Distributed Model Intercomparison Results, Journal of Hydrology, accepted for the upcoming DMIP special issue. Smith, M.B., Seo, D.J., Koren, V., Reed, S., Zhang, Z., Duan, Q.Y., Moreda, F., and Cong, S., 2003. The Distributed Model Intercomparison Project (DMIP): Motivation and Experiment Design, Journal of Hydrology, accepted for the upcoming DMIP special issue. Winchell, M., Gupta, H.V., and Sorooshian, S., 1998. On the simulation of infiltration- and saturation- excess runoff using radar-based rainfall estimates: Effects of algorithm uncertainty and pixel aggregation. Water Resources Research, 34(10), 2655-2670.