and NI-USRP. Nikookhoy Shahin, Nickolas J. LaSorte, Samer A. Rajab, Hazem H. Refai. Electrical and Computer Engineering, University of Oklahoma Tulsa, ...
802.11g Channel Characterization Utilizing LabView and NI-USRP Nikookhoy Shahin, Nickolas J. LaSorte, Samer A. Rajab, Hazem H. Refai Electrical and Computer Engineering, University of Oklahoma Tulsa, Oklahoma, USA {sh.nikookhoy, nicklasorte, samer.rajab, hazem}@ou.edu
Abstract—Medical device manufacturers have recently begun to incorporate wireless communication, such as ZigBee and Bluetooth operating in the unlicensed 2.4 GHz industrial, scientific, and medical (ISM) band, into their medical devices. Wi-Fi, however, is a major source of interference in the ISM band. With patient safety in mind, the FDA has mandated coexistence testing for wireless medical devices [1]. An initial step toward supporting this mandate is to be able to accurately characterize the interfering network in a typical environment. In this paper, a software defined radio (SDR) is employed to serve as a platform for measuring channel duty cycle, packet arrival rate, node distribution, and packet inter-arrival time distribution of 802.11g networks. Theoretical and technical concerns are discussed, and tests performed to assess system integrity are described. Experimental tests examining channel characteristics of an 802.11g network are also reported. Keywords—802.11g; Packet Arrival Rate; Node Distribution; Packet Inter-arrival Time Distribution; Duty Cycle; Channel Characterization, USRP, LabView
I.
INTRODUCTION
Sound knowledge of channel characteristics is required to guarantee reliable wireless communication. In a typical environment these variables provide information to predict and possibly prevent circumstances wherein wireless devices might malfunction. To model a typical medical setting environment, the duty cycle, packet arrival rate, packet inter-arrival time distribution, and node distribution of the wireless channel must be known. These parameters offer information that can be used to estimate channel occupation, channel traffic, and MAC layer performance and efficiency. Likewise, the data aids in determining the nodes operating on the network and their corresponding distances to the point of measurement, as well as the signal power expected on the network. Consequently, these characteristics can play a significant role in assessing the probability of wireless devices interference. A. Contributions This paper reports a platform that was developed to measure duty cycle, packet arrival rate, node distribution, and packet inter-arrival distribution of an 802.11g network. The measurement system was developed on an NI-USRP. This work was supported by National Instrument.
Theoretical aspects of design and implementation are discussed, and tests that were executed to verify scheme performance are detailed. In addition, test results are provided for an 802.11g network studied under various network traffic conditions. The remainder of this paper is organized as follows. In Section II the desired channel characterization parameters are defined and discussed. A testbed measuring them is also presented. Section III provides experimental results and interpretation. Conclusions are drawn in the final section. II.
CHANNEL CHARACTERIZATION
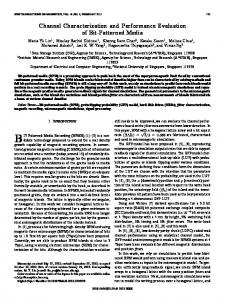
A. Duty Cycle Duty cycle measurement of wireless channels is a spectrum occupancy method that can be applied to determine channel occupancy [2]. Their study has drawn great attention recently due to the dramatic increase in the demand for wireless technologies and a growing interest in employing cognitive radio techniques and spectrum sharing technologies [3]. In spite of this interest, a limit amount of research has focused on duty cycle measurements [4]. Wireless channel duty cycle is defined as the percentage of time the channel is occupied over a specific period of time. To measure it, received samples are divided into blocks of various sizes of n in the order in which they are received, where n is the Fast Fourier Transform (FFT) size. FFT is performed on each block to obtain the spectrum frequency of the received signal over both time and a particular power threshold. Duty cycle can then be obtained by dividing the number of occupied blocks over the total number of blocks. A program developed by the authors in LabView was used to measure duty cycle in 802.11g channels. When at least 80% of the power spectrum was determined to be above the designated threshold, a channel was assumed occupied. Figure 1 illustrates the experimental test setup employed to assess the accuracy of the duty cycle measurement. In an effort to ensure minimal background noise, experiments were conducted in an anechoic chamber. An 802.11g network was emulated using a Rohde & Schwarz SMIQ-06B signal generator that achieved a 20 MHz bandwidth signal by generating a pseudo random number sequence and modulating it with QPSK. An Agilent 33220A arbitrary waveform generator created a square wave to drive the RF switch (ZX80DR230-S+) and control the duty cycle.
Figure 1. Test setup for duty cycle measurement.
The signal generator was set to transmit at 2.412 GHz— the center frequency of channel 1 for 802.11g. By using an NIUSRP to scan the power spectrum of all 802.11g channels, signal power was determined to be -60dBm, and the noise floor was -95dBm. A threshold of -80dBm was selected, and FFT size was set to 128 samples. The NI-USRP sampled the signal at 1-, 5-, and 20-MHz. Square waveform generator frequencies varied from 100 Hz to 100 KHz. Test results are shown in Figure 2. Given a generated signal with a duty cycle of 80%, results show that as the square wave frequency increases, measured duty cycle also increases, ultimately reaching 100%. Focusing on f s 20MHz one can see that when a square wave frequency is less than 20kHz , measured duty cycle is reliable. For f s 5MHz and f s 1MHz , reliability is maintained until square wave
frequency reaches 5kHz and 1kHz , respectively. This demonstrates that as square wave frequency increases, the SDR must sample the received signal at a higher rate to ensure accuracy. The SDR Unit used to conduct this study is the National Instruments USRP-2920. Consider f r f s / n , which denotes frequency of the reception of a new block of samples. As long as f r is larger than square wave frequency, duty cycle measurement error is minimal. However, when square wave frequency is over f r , measurement error increases dramatically. To maintain reliable duty cycle measurement, sampling rate should be large enough to ensure Tr 1/ f r remains smaller than the period of frame exchange for 802.11 networks. This time interval is comprised of a DCF Inter-Frame Space (DIFS), Short Inter-Frame Space (SIFS), data packet, and acknowledgement packets (ACK), of which all but data packet have a constant length. Thus, to find the smallest possible frame exchange time, the physical header of the packets serves as the minimum length of data packets. Table 1 illustrates the minimum frame exchange time for 802.11g. Table 1. MAC parameters Timing Intervals DIFS
28 sec
802.11g
PHY header
20 sec
SIFS
10 sec
ACK
30 sec
Frame Exchange
88 sec
Figure 2. Measured duty cycle results with different sampling rates.
B. Packet Arrival Rate Wireless channel packet arrival rate is defined as the rate of packet transmission over time. Each 802.11g packet commences with 10 short training symbols, each containing 16 samples followed by a cyclic prefix guard interval and two long training symbols, as shown in Figure 3. To detect 802.11g packets, the periodic structure of the Physical Layer Convergence Protocol (PLCP) preamble of OFDM signals is exercised. In this way the receiver applies auto correlation on the received samples to detect packets [5]. Let rn be the received sample at time n . Packet detection estimation D n is defined as L 1
Dn
r k 0
n k n k L
r
L 1
r k 0
2
nk L
Figure 3. Preamble structure of 802.11g packets.
where L 16 is the period of short training sequences. In an ideal case at the start of 802.11g packets, Dn 1 for the first 128 consecutive symbols out of 160 short training symbols. In practice, however, a threshold < 1 is set to detect packets. The platform packet detector is set to indicate a packet only when 125 out of 128 symbols has a Dn 0.98 . C. Packet Inter-Arrival Distribution Packet inter-arrival time (PIT) is defined as the time between the transmissions of two packets in a network. Studying network MAC layer PIT over time can be helpful in assessing network MAC layer traffic, expected transmission wait time, and MAC protocol efficiency and performance. While significant amounts of literature report on wired network PIT, few have focused on the wireless MAC layer PIT. And of these, most studied and assessed network PIT based on theory or simulation [6-7]. With the use of the NI-USRP, the testbed
detailed in this paper demonstrates packet inter-arrival distribution of 802.11g channels by assessing the time interval between the detection of two packets. In the next section packet inter-arrival distribution of an 802.11g network with various throughputs is measured and interpreted. D. Node Distribution Node distribution is defined in this paper as an estimate of node distance in relation to SDR, which estimates the distance d to the nodes utilizing the free space path loss model. The free space path loss model is indicated by:
d
Pt Gt G r 2
B. Validation Tests To evaluate the performance of the designed SDR measurement-based system under various traffic conditions, the IEEE802.11g transmitter was configured to send packets at rates of 1-, 5-, and 10Mbit/sec. One test rate is used during a single test run. Table 2 shows the DATA packet rate, associated ACK packet rate, and the WiFi Beacon rate measured by the SDR. The WiFi network was also configured with and without retransmissions. Figure 5 demonstrates packets received by the SDR during an interval of 250msec for the three different traffic rates. Two packet size groups were detected by sensing the received power.
4 2 Pr L
where Pt is the transmit power; G t is the antenna gain of the
transmitter; G r is the antenna gain of the receiver; is the wavelength of the transmitted frequency (2.4 GHz); Pr is the power received; and L is the system loss. To estimate packet power by time synchronization methods, the start of preamble symbols is estimated, and then their average power is calculated. Wavelength is computed on the basis of 802.11g channel center frequency. We assumed Gt , Gr and L are , constant, and Pt 16dBm . III.
EXPERIMENTAL SETUP AND RESULTS
A. Experimental setup All 802.11g channels were scanned to ensure no wireless activity in 2.4GHz band. Noise floor was less than -95dBm. To assess SDR performance for detecting packet arrival rate and node distribution, 802.11g packets were generated at a varied rate. ADI pronghorn metro boards were used to establish the 802.11g wireless network. Transmit power, operation mode, and throughput of each 802.11g card was configurable. Transmitted power was 16dBm. The MAC layer used DCF as the channel access mechanism. Neither transmitter nor receiver sent ‘request to send’ (RTS) or ‘clear to send’ (CTS) packets. Beacons were sent by the transmitter every 100msec, and data packets were 12,000 bits. Transport layer protocol was set as UDP. Figure 4 illustrates that NI-USRP was located at a distance of 0.8m from receiver and 3m from the transmitter boards. NI-USRP was programmed by the adjacent computer to sample received signals at a 20MHz.
Figure 4. 802.11g characterization test setup
Figure 5. Node distribution. a) 1Mbit/sec throughput. b) 5Mbit/sec throughput. c) 10Mbit/sec throughput.
C. 802.11g Network Packet Inter-arrival Distribution Study The measurement system also characterized packet interarrival distribution of the 802.11g network MAC layer. Figure 4 illustrates the test setup. Throughputs at 1-, 5-, 10-, 15-, and 20Mbit/sec were characterized for a period of 500 seconds. Time intervals of 30-, 254-, 28-, and 10 sec indicate time duration of ACK packet, DATA packet, DIFS, and SIFS, respectively. These were utilized to analyze results, as indicated in Figure 6. For each DATA packet received, the receiver transmits one ACK packet after time duration SFIS. DATA packet length and SIFS indicate that 264 sec after DATA packet receipt by NIUSRP, another ACK packet will be received. Consequently, all packets received between 264 sec and 265 sec are considered ACK packets, which results in an increase in cumulative probability of packet inter-arrival distribution at 265 sec for various throughputs. Increases were measured at 47.9%, 47%, 47.5%, 46.4%, and 44.7% for 1-, 5-, 10-, 15-, and 20Mbit/sec throughputs, respectively. This implies that as throughput passes 10Mbit/sec, transmission error increases and
Table 2. Packet arrival rate Throughput (Mbit/sec) 1 5 10
DATA (No/sec) 83.3 416.7 833.3
ACK (No/sec) 83.3 416.7 833.3
Beacon (No/sec) 10 10 10
the a lower percentage of DATA packets is sent. Another significant increase in cumulative probability of packet interarrival distribution occurs at different times relative to changes in throughout, e.g., approximately 10000 sec , 2000 sec , 900 sec , 500 sec , and 400 sec for 1-, 5-, 10-, 15-, and 20Mbit/sec throughputs, respectively. This demonstrates that as throughput increases, the NI-USRP will receive DATA packets in a shorter period of time following the arrival of each ACK packet. Bearing in mind the size of ACK packet and DIFS time interval, the transmitter is still able to increase network throughput by sending DATA packets immediately following reception of ACK packets and DIFS.
Packet Rate (No/sec) 177 843 1676
Measured Packet Rate (Including Retransmissions) (No/sec) 173.3 853.6 1728
cycle, packet arrival rate, node distribution, and packet interarrival distribution of an 802.11g channel. These variables can be used to evaluate the coexistence risk of communication among wireless medical devices. Theoretical aspects of design and technical implementation concerns are discussed as are tests conducted to verify platform performance. Analysis and test results from an 802.11g network are also provided.
Figure 7. Duty cycle measurement of 802.11g throughputs with different sampling frequencies.
REFERENCES Figure 6. Packet inter-arrival cumulative distribution function of an 802.11g network including an access point and a station.
[1] [2]
D. 802.11g Duty Cycle Study The designed platform was used to attain duty cycle of an 802.11g network for different throughputs. The test set up is shown in Figure 4. Although transmitter was set to transfer data between 1Mbit/sec and 100Mbit/sec, network throughput did not surpass 39Mbit/sec. NI-USRP was set to sample at 1-, 5-, and 20MHz with FFT size of 128. Results shown in Figure 7 demonstrate that by increasing throughput, channel duty cycle increases until channel throughput reaches approximately 39Mbit/sec, which is the maximum network throughput. When this threshold is surpassed, measured duty cycle remains at a constant level, implying channel saturation. The figure also shows that at a sampling rate of 1Mbit/sec, measured duty cycle is always higher than when sampling rate is 5Mbit/sec or 20Mbit/sec because with an FFT of 128, a 1Mbit/sec sampling rate is not sufficient to detect channel vacancy in the relatively short interval between transmissions like SIFS or DIFS. CONCLUSION This paper presents an SDR testbed utilizing NI-USRP and LabView for modeling an empirical channel characterization of a typical environment to determine conditions for more reliable wireless communication. The proposed platform measures duty
[3] [4] [5] [6] [7]
http://www.fda.gov/MedicalDevices/DeviceRegulationandGuidance/Gui danceDocuments/ucm077210.htm. A. D. Spaulding and G. H. Hagn, “On the definition and estimation of spectrum occupancy,” IEEE Transactions on Electromagnetic Compatibility, vol. 19, pp. 269-280,August 1977. T. Yücek, and H. Arslan, “A Survey of Spectrum Sensing Algorithms for Cognitive Radio Applications,” IEEE Communications Surveys & Tutorials, Vol.11, NO.1, pp.116-130, 2009. D. Denkovski, M. Pavloski, V. Atanasovski, L. Gavrilovska, “Parameter setting for 2.4GHz ISM spectrum measurement,” In Proc. ISABEL, pp. 1-5, Nov. 2010. Schmidl T M, Cox D C, "Robust frequency and timing synchronization for OFDM," IEEE Transactions on Communications. 1997,45 (12), pp. 1613 - 1621. n O. Tickoo and B. Sikdar, “On the impact of IEEE 802.11 MAC on traffic characteristics,” IEEE J. Sel. Areas Commun., vol. 21, no. 2, pp. 189–203, Feb. 2003. D. Malone, P. Clifford, and D. J. Leith, "On buffer sizing for voice in 802.11 WLANs," IEEE Communications Letters, vol. 10, no. 10, pp 701-703, Oct. 2006.