Ma, H., Capacitive displacement sensing for the nanogate, Ph.D. Thesis, Mas- sachusetts Institute of Technology, 2004. 5. APC International, L., Piezoelectric ...
A 10 BIT INTERFACE CIRCUIT FOR AN ARRAY OF CAPACITIVE TRANSDUCERS
by Mohammad Ali Vosoughi B.S., Electrical and Electronics Engineering, Sharif University of Technology, 2013
Submitted to the Institute for Graduate Studies in Science and Engineering in partial fulfillment of the requirements for the degree of Master of Science
Graduate Program in Electrical and Electronics Engineering Bo˘gazi¸ci University 2016
ii
A 10 BIT INTERFACE CIRCUIT FOR AN ARRAY OF CAPACITIVE TRANSDUCERS
APPROVED BY:
Prof. Gunhan Dundar
...................
(Thesis Supervisor)
Assoc. Prof. Hamdi Torun
...................
Assist. Prof. Okan Zafer Batur
...................
DATE OF APPROVAL: 05.12.2016
iii
ABSTRACT
A 10 BIT INTERFACE CIRCUIT FOR AN ARRAY OF CAPACITIVE TRANSDUCERS
Terahertz Cameras are going to be widely used in many places, specifically for medical purpose and there are many advantages over the use of terahertz signals for imaging. Among different methods of terahertz imaging, the transformation of the THz signals into the form of absorbed heat and mechanical displacements can be used for medical purposes. The use of mechanical deflections for cameras requires a method for measuring the displacement. From different modalities for displacement sensing, capacitor based displacements are widely used in literature. For many reasons, including cost and feasibility with current technologies and compatibility with MEMS fabrications process, capacitive displacement transducers are the best choice for photo-mechanical cameras. Simulations show that the interface circuit should satisfy a sufficiently good safe margin for operation of circuit in different sensing capacitor dimensions. A rail-to-rail voltage at the output of the sensor interface circuit might limit tolerance of the fabrication process. Therefore, conventional method with limited output voltage swing is employed to provide sufficiently flexible solution. A 10 bit data converter transduces the capacitance value to a digital modulated signal.
iv
¨ OZET
˙ IF ˙ DON ¨ US ¨ ¸ TUR ¨ UC ¨ U ¨ DIZ ˙ IS ˙ I˙ IC ˙ ¸ IN ˙ 10 BIT ˙ KAPASIT ˙ IM ˙ DEVRESI˙ ARABIR
Terahertz kameralar o¨zellikle medikal ama¸clı uygulamalar i¸cin bir¸cok yerde yaygın olarak kullanılmaktadır ve terahertz sinyallerinin g¨or¨ unt¨ uleme ama¸clı kullanımının bir¸cok faydası vardır. Bir¸cok farklı terahertz g¨or¨ unt¨ uleme y¨ontemleri arasında, terahertz sinyallerinin, emilen ısıya ve mekanik yer de˘gi¸simine d¨on¨ u¸su ¨m¨ u, tıbbi ama¸clar i¸cin kullanılabilir. Mekanik sapmaların kameralar i¸cin kullanılması yer de˘gi¸simini o¨l¸cen bir y¨ontem gerektirmektedir. Yer de˘gi¸simi algılama i¸cin bir¸cok farklı yakla¸sım i¸ceresinde, kondansat¨or bazlı yer de˘gi¸smeler literat¨ urde yaygın olarak kullanılmaktadır. G¨ un¨ um¨ uz teknolojilerinin maliyeti ve fizibilitesi ve MEMS u ¨retim i¸slemlerine uyumlulu˘gu gibi bir¸cok nedenden dolayı, kapasitif yer de˘gi¸stirme d¨on¨ u¸st¨ ur¨ uc¨ uleri foto-mekanik kameralar i¸cin en iyi se¸cimdir. Benzetimler, arabirim devresinin, farklı algılama kapasit¨or¨ u boyutlarında devrenin ¸calı¸sması i¸cin yeterli bir g¨ uvenlik sınırını kar¸sılaması gerekti˘gini g¨ostermektedir. Algılayıcı arabirim devresinin ¸cıkı¸s gerilim salınımı, u ¨retim i¸sleminin toleransını sınırlayabilir. Bu nedenle, yeterince esnek bir ¸co¨z¨ um sa˘glamak i¸cin sınırlı ¸cıkı¸s gerilimi salınımlı geleneksel bir y¨ontem kullanılır. 10 bitli bir veri d¨on¨ u¸st¨ ur¨ uc¨ u, kapasitans de˘gerini sayısal olarak mod¨ ule edilmi¸s bir sinyal haline d¨on¨ u¸st¨ ur¨ ur.
v
TABLE OF CONTENTS
ABSTRACT . . . . . . . . . . . . . . . . . . . . . . . . . . . . . . . . . . . . .
iii
¨ OZET . . . . . . . . . . . . . . . . . . . . . . . . . . . . . . . . . . . . . . . . .
iv
LIST OF FIGURES . . . . . . . . . . . . . . . . . . . . . . . . . . . . . . . . . viii LIST OF TABLES . . . . . . . . . . . . . . . . . . . . . . . . . . . . . . . . . . xiii LIST OF SYMBOLS . . . . . . . . . . . . . . . . . . . . . . . . . . . . . . . . . xiv LIST OF ACRONYMS/ABBREVIATIONS . . . . . . . . . . . . . . . . . . . .
xv
1. MOTIVATION FOR THE DESIGN . . . . . . . . . . . . . . . . . . . . . .
1
1.1. Motivation for Design
. . . . . . . . . . . . . . . . . . . . . . . . . . .
1
1.2. MEMS Chip Specification . . . . . . . . . . . . . . . . . . . . . . . . .
3
1.3. Different Approaches for Nano-Meter Range Displacement Sensing . . .
5
1.4. Conclusion for Interface Circuit Design Specifications . . . . . . . . . .
6
2. DESIGN OF SENSOR INTERFACE . . . . . . . . . . . . . . . . . . . . . .
8
2.1. Differential Difference Amplifier Based Interface Circuit . . . . . . . . .
8
2.2. Emulated Resistor Based Interface Circuit . . . . . . . . . . . . . . . .
11
2.3. Switched Capacitor Amplifier-Based Interface Circuit . . . . . . . . . .
13
2.3.1. Noise Analysis of Switched Capacitor Amplifier Based Readout Circuit . . . . . . . . . . . . . . . . . . . . . . . . . . . . . . . .
16
2.3.1.1.
Thermal Noise of the CMOS OTA . . . . . . . . . . .
16
2.3.1.2.
Thermal Noise in Phase I . . . . . . . . . . . . . . . .
19
2.3.1.3.
Thermal Noise in Phase II . . . . . . . . . . . . . . . .
21
2.3.2. Total Noise and Optimal Operating Point . . . . . . . . . . . .
22
2.3.3. Simulation Results . . . . . . . . . . . . . . . . . . . . . . . . .
23
3. ANTI ALIASING FILTER . . . . . . . . . . . . . . . . . . . . . . . . . . . .
25
3.1. Filters . . . . . . . . . . . . . . . . . . . . . . . . . . . . . . . . . . . .
25
3.1.1. Different Filter Types . . . . . . . . . . . . . . . . . . . . . . .
25
3.1.2. Realization of Switched Capacitor Biquad Filters . . . . . . . .
26
3.2. Specifications of the Filter . . . . . . . . . . . . . . . . . . . . . . . . .
26
3.3. Realization of Filter . . . . . . . . . . . . . . . . . . . . . . . . . . . .
28
3.3.1. Extraction of the Transfer function . . . . . . . . . . . . . . . .
28
vi
3.3.2. Circuit Implementation . . . . . . . . . . . . . . . . . . . . . . .
29
4. ANALOG TO DIGITAL CONVERSION . . . . . . . . . . . . . . . . . . . .
33
4.1. Fundamentals of Data Converters . . . . . . . . . . . . . . . . . . . . .
33
4.2. Specifications of Data Converters . . . . . . . . . . . . . . . . . . . . .
35
4.3. Classification of Data Converters . . . . . . . . . . . . . . . . . . . . .
40
4.3.1. Nyquist-Rate Converters . . . . . . . . . . . . . . . . . . . . . .
40
4.3.2. Oversampling Converters . . . . . . . . . . . . . . . . . . . . . .
41
4.4. Delta Sigma Converters . . . . . . . . . . . . . . . . . . . . . . . . . .
41
4.4.1. Noise Shaping in SD Modulators . . . . . . . . . . . . . . . . .
42
4.4.2. Discrete Time vs. Continuous Time Σ∆ Modulator . . . . . . .
43
4.4.3. Design of Delta Sigma Converter . . . . . . . . . . . . . . . . .
44
4.4.3.1.
Second Order Switched Capacitor Σ∆ ADC . . . . . .
45
4.4.3.2.
Switched Capacitor Integrator . . . . . . . . . . . . . .
45
4.4.3.3.
Specifications of Desired Sigma Delta Converter . . . .
47
4.5. Implementation of Delta Sigma Converter . . . . . . . . . . . . . . . .
47
4.5.1. Switches . . . . . . . . . . . . . . . . . . . . . . . . . . . . . . .
48
4.5.2. Operational Amplifier . . . . . . . . . . . . . . . . . . . . . . .
48
4.5.3. Latched Comparator . . . . . . . . . . . . . . . . . . . . . . . .
52
4.5.4. 1 Bit DAC . . . . . . . . . . . . . . . . . . . . . . . . . . . . . .
53
4.5.5. Non overlapping Clocks . . . . . . . . . . . . . . . . . . . . . .
53
4.5.6. SNR vs. Input Voltage Plot . . . . . . . . . . . . . . . . . . . .
58
5. SIMULATION AND RESULT . . . . . . . . . . . . . . . . . . . . . . . . . .
60
5.1. Layout of the Circuits . . . . . . . . . . . . . . . . . . . . . . . . . . .
60
5.2. Post-Layout Simulations of the Circuits . . . . . . . . . . . . . . . . . .
67
6. CONCLUSION AND FUTURE WORKS . . . . . . . . . . . . . . . . . . . .
71
6.1. Conclusion . . . . . . . . . . . . . . . . . . . . . . . . . . . . . . . . . .
71
6.2. Future Works . . . . . . . . . . . . . . . . . . . . . . . . . . . . . . . .
72
REFERENCES . . . . . . . . . . . . . . . . . . . . . . . . . . . . . . . . . . . .
74
APPENDIX A: CALCULATION OF ABSTRACT NOISE BY MATLAB . . .
78
A.1. Spectral Density . . . . . . . . . . . . . . . . . . . . . . . . . . . . . .
78
A.2. Measuring Noise Value by Matlab . . . . . . . . . . . . . . . . . . . . .
79
vii
A.2.1. Windowing Function . . . . . . . . . . . . . . . . . . . . . . . .
79
A.2.2. Normalization of the Integrated Spectral Power . . . . . . . . .
81
A.2.3. pwelch Function in MATLAB . . . . . . . . . . . . . . . . . . .
81
viii
LIST OF FIGURES
Figure 1.1.
Different displacement sensing modalities . . . . . . . . . . . . . .
Figure 1.2.
Three dimensional drawing of the detector structure. Whole the
2
structure is just one pixel. In this design, the height of bimaterial leg may vary, resulting in variation of initial state’s total capacitance.
4
Figure 1.3.
Different capacitive sensing methods. . . . . . . . . . . . . . . . .
7
Figure 2.1.
Block diagram of capacitive sensing stage proposed by Wu et al., The mechanical offset is removed by an external ac signal. Offchip capacitor removes the dc offset of the circuit. . . . . . . . . . . . .
Figure 2.2.
Modification of the first stage of circuit proposed by Wu et al. to meet the linearity with respect to the displacement. . . . . . . . .
Figure 2.3.
9
10
Linearity and swing of the proposed first stage, as modification of the work conducted by Wu et al., as sensor’s value initially set to 200f F and displacement happens from 2 to 3µm . . . . . . . . . .
Figure 2.4.
10
Proposed stage with emulated resistors in drain of the transistors. The value of the resistor depends on the gap size of the capacitors. CMOS transistors provide constant current. . . . . . . . . . . . . .
Figure 2.5.
Conceptual diagram of the proposed emulated resistor based sensor interface. . . . . . . . . . . . . . . . . . . . . . . . . . . . . . . . .
Figure 2.6.
11
12
Comparative simulation of the contribution of different noise sources to the total noise of the circuit. . . . . . . . . . . . . . . . . . . .
13
ix
Figure 2.7.
Output swing for the sensor with initial value of 200f F . Later on, the gap size varies from 2 to 3µm and the corresponding output voltage measured and drawn. . . . . . . . . . . . . . . . . . . . . .
Figure 2.8.
14
Amplifier-Based capacitive sensing. The circuit is simply a switched capacitor amplifier, where one of the capacitors replaced with the sensor. . . . . . . . . . . . . . . . . . . . . . . . . . . . . . . . . .
Figure 2.9.
15
Folded cascode OTA with PMOS input stage. For simplification CMFB is not shown. . . . . . . . . . . . . . . . . . . . . . . . . .
17
Figure 2.10. Noise model circuit when Φ1 is high. . . . . . . . . . . . . . . . . .
20
Figure 2.11. Noise model circuit when Φ2 is high. . . . . . . . . . . . . . . . . .
21
Figure 2.12. Flicker and Thermal of all components, Only Thermal and Only Switches’ Thermal . Integrated noise for SC-emulated resistor (fully switched capacitor) is 56.56nV . Cs = 300f . . . . . . . . . . . . .
24
Figure 3.1.
Topology of a typical data converter system. . . . . . . . . . . . .
25
Figure 3.2.
Basic relationship of fS , fGBW , fP EAK , and fC .
. . . . . . . . . .
27
Figure 3.3.
Flowchart for extracting the transfer function of Butterworth filter.
28
Figure 3.4.
2nd order Butterworth filter.
29
Figure 3.5.
High Q switched capacitor biquad filter.
Figure 3.6.
Filter frequency response after realization. Gain error is less than
. . . . . . . . . . . . . . . . . . . .
. . . . . . . . . . . . . .
8mdB inside the band. . . . . . . . . . . . . . . . . . . . . . . . .
30
31
x
Figure 3.7.
Comparison of total noise of the circuit after passing through the filter and before the filter. . . . . . . . . . . . . . . . . . . . . . .
32
Figure 4.1.
Block diagram of an ADC. . . . . . . . . . . . . . . . . . . . . . .
33
Figure 4.2.
(a)Output of an ADC for a ramp input. (b) Quantization error of an ADC . . . . . . . . . . . . . . . . . . . . . . . . . . . . . . . . .
34
Figure 4.3.
Transfer curve and quantization error of an ideal 3 bit ADC. . . .
36
Figure 4.4.
Differential non-linearity error (DNL) of a possible 12-bit ADC. .
37
Figure 4.5.
INL obtained with the endpoint-fit line. . . . . . . . . . . . . . . .
37
Figure 4.6.
Offset error for an analog-to-digital (a) and a digital-to-analog (b) converter. . . . . . . . . . . . . . . . . . . . . . . . . . . . . . . .
Figure 4.7.
38
Gain error for an analog-to-digital (a) and a digital-to-analog (b) converter. . . . . . . . . . . . . . . . . . . . . . . . . . . . . . . .
38
Figure 4.8.
Generalized SD modulator with loop-filter G(z). . . . . . . . . . .
42
Figure 4.9.
Comparison of noise shaping in the oversampling and Nyquist-Rate data converters. . . . . . . . . . . . . . . . . . . . . . . . . . . . .
43
Figure 4.10. (a) Switched-capacitor integrator (b) Continuous-time integrator. .
44
Figure 4.11. The switched capacitor second order Σ∆ modulator used in this work. . . . . . . . . . . . . . . . . . . . . . . . . . . . . . . . . . .
45
Figure 4.12. The switched capacitor integrator. . . . . . . . . . . . . . . . . . .
46
xi
Figure 4.13. (a) NMOS switch; (b) Transmission Gate (TG) switch. . . . . . .
48
Figure 4.14. Folded cascode operational amplifier. . . . . . . . . . . . . . . . .
50
Figure 4.15. Common mode feedback circuit. . . . . . . . . . . . . . . . . . . .
50
Figure 4.16. Folded cascode OTA frequency response. . . . . . . . . . . . . . .
51
Figure 4.17. Latched comparator. . . . . . . . . . . . . . . . . . . . . . . . . .
53
Figure 4.18. 1 Bit DAC for the feedback link. . . . . . . . . . . . . . . . . . . .
54
Figure 4.19. Latched comparator response. . . . . . . . . . . . . . . . . . . . .
55
Figure 4.20. Latched Comparator sensitivity checking, it works with less than 50mV of variations. . . . . . . . . . . . . . . . . . . . . . . . . . .
56
Figure 4.21. Non-overlapping clocks. . . . . . . . . . . . . . . . . . . . . . . . .
57
Figure 4.22. SNR versus input voltage for Vref = ±55mV . . . . . . . . . . . . .
59
Figure 5.1.
Folded cascode OTA layout. . . . . . . . . . . . . . . . . . . . . .
61
Figure 5.2.
Second order biquad Butterworth filter layout. . . . . . . . . . . .
62
Figure 5.3.
Sensor interface layout. . . . . . . . . . . . . . . . . . . . . . . . .
63
Figure 5.4.
Latched comparator layout. . . . . . . . . . . . . . . . . . . . . . .
64
Figure 5.5.
1 Bit digital to analog converter layout. . . . . . . . . . . . . . . .
65
xii
Figure 5.6.
Sigma Delta ADC layout. . . . . . . . . . . . . . . . . . . . . . . .
Figure 5.7.
Positive and negative outputs of the ADC in performing state and
65
the input signal - post layout. . . . . . . . . . . . . . . . . . . . .
66
Figure 5.8.
Post layout simulation of latched comparator. . . . . . . . . . . .
68
Figure 5.9.
SNR of the post layout ADC. . . . . . . . . . . . . . . . . . . . .
69
Figure 5.10. SNR of the post layout complete circuit for Csensor = 100f F and Cref erence = 300f F . Harmonics are due to the mismatch in the sensor and reference capacitors. . . . . . . . . . . . . . . . . . . .
Figure A.1.
70
The MATLAB code used for power spectral density and calculation of pure noise. . . . . . . . . . . . . . . . . . . . . . . . . . . . . .
82
xiii
LIST OF TABLES
Table 2.1.
Results of simulation and calculation values . . . . . . . . . . . . .
24
Table 3.1.
Capacitor values for filter . . . . . . . . . . . . . . . . . . . . . . .
30
Table 4.1.
Transistor sizing for the switches . . . . . . . . . . . . . . . . . . .
48
Table 4.2.
Transistor sizing for the OTA . . . . . . . . . . . . . . . . . . . . .
49
Table 4.3.
Transistor Sizing for the CMFB . . . . . . . . . . . . . . . . . . .
49
Table 4.4.
Transistor sizing for latched comparator. . . . . . . . . . . . . . . .
52
Table 6.1.
Specifications earned in this thesis. . . . . . . . . . . . . . . . . . .
72
Table A.1.
Maximum scallop loss and correction factors for different windowing functions. . . . . . . . . . . . . . . . . . . . . . . . . . . . . . . . .
80
xiv
LIST OF SYMBOLS
A
Area of electrodes in capacitor
Cf ringe
Capacitance due to fringes
Cj
Capacitance of j − th Capacitor
d
Gap separation in capacitor
ed
Gap displacement in capacitor
eA
Electrodes area variations in capacitor
fj
Frequency of j
gmx
Transconductance of transistor x
k
Boltzmann constant ' 1.38 × 10⁻²³ JK −1
Rj
Resistance of j
Tj
Time period of signal j
∆(x)
Variations of parameter x
�
Error parameter
�r
Relative static permittivity
�0
Electric constant
Θ(ω)
Relative phase error
φj
j − th Clock
xv
LIST OF ACRONYMS/ABBREVIATIONS
ADC
Analog to Digital Converter
CMFB
Common Mode Feed Back
CCD
Charge Couples Devices
OpAmp
Operational Amplifier
OTA
Operational Trans-conductance Amplifier
PSD
Power Spectral Density
SAR
Successive Approximation Register
SC
Switched Capacitor
SD ADC
Sigma Delta Analog to Digital Converter
SNR
Signal to Noise Ratio
VLSI
Very Large Scale Integration
1
1. MOTIVATION FOR THE DESIGN
1.1. Motivation for Design
Imaging technology plays the principal role in the medical diagnosis process. In the past decade, the research on safe medical test and diagnosis equipment has significantly increased and many methods have been proposed for safe test diagnosis. The use of terahertz signals for cancer diagnosis have become popular, since it is safe to frequently use it on the human body [2]. Recently, Bilgin et al proposed a method for terahertz signal detection using metamaterials and verified this method on a chip, which is suitable for medical imaging cameras [3]. The chip consists of distributed metamaterial based pixels. These pixels absorb the heat and act as transducer to the form a mechanical deflection on the pixels. These mechanical displacements have nanometer range and hard to measure.
The aim is to measure displacement of several pixels over a detector plane. However, in this project, we are concerned with detecting the deflections of a single pixel while we keep the scalability to multiple pixels in mind. Therefore, the design should somehow satisfy the thresholds to be multiplexed in the next phases of project.
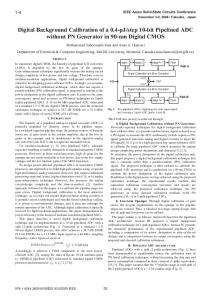
There are several methods to detect terahertz signals. The method employed in [3] is photo-mechanical transducer based. The THz signal is transformed into mechanical variations. These mechanical variations are in the range of few nanometers, which correspond to aF range variations in the capacitance of the sensors implanted on the pixels. There are several methods to detect the sub-nanometer range variations. Figure 1.1 shows different approaches for displacement measuring instrumentation [4].
Among different modalities, CMOS based method seems to be the best in terms of compatibly with integration and enough precision. In order to reduce the effect of parasitics, the interface circuit should be integrated into the MEMS chip.
2
Figure 1.1. Different displacement sensing modalities
3
1.2. MEMS Chip Specification
The topology of the pixel array defines the specifications of the readout circuit. Therefore, knowing the features of the pixels is useful for designing an appropriate architecture for transducing the capacitance values in a readable digital number.
One important issue of the pixel arrays is that they have limited area, as a result, limited capacitance. Moreover, pixels’ dimensions are not defined precisely due to fabrication process variability up to 1µm. Therefore, under the deflection conditions, the value of the capacitance may vary from from 120f F to 380f F , which will be calculated in the following. This implies that the interface circuit should mitigate variations as large as 300%. However, the fabrication process of the chip could be improved to have a better performance of the final camera.
To better define the range of displacement sensing capacitance, we first study the specifications of one single pixel, which implemented in [3] and depicted in figure 1.2. The suspended absorber that is 200µm × 200µm in size consists of 16 square patches of 43µm × 43µm , two bimaterial legs of 75µm × 45µm, and the bottom metallic layer. Assuming equivalent capacitance of the parallel-plate capacitor, without fringing effect and 2µm gap size between the plates that is filled with the vacuum, the equivalent total capacitance of each pixel would be about 200f F . However, with a simple math, corresponding range of capacitance can be derived:
C=
�r �0 A + Cf ringe d
(1.1)
where A states the area of plates, d stands for the separation between the plates, �r is the relative static permittivity and �0 is the electric constant (�0 ≈ 8.854×10⁻¹² F.m−1 ). The effect of fringes for parallel plate capacitor is around 4% of the non-fringed portion of the capacitor. Let’s assume ed as the error in the plates separation, eA as the error
4
Figure 1.2. Three dimensional drawing of the detector structure. Whole the structure is just one pixel. In this design, the height of bimaterial leg may vary, resulting in variation of initial state’s total capacitance.
in the area fabrication and �r = 1. Therefore, the value of the capacitance is equal to:
C=
�r �0 (A + eA ) + Cf ringe d + ed
(1.2)
1µm accuracy for lateral dimensions is a valid assumption. The fabrication tolerance for gap height is much smaller, on the order of nm. But uniformity from one pixel to another is an issue, where it can vary more than 1µm, leading to wide variations in capacitance value [3]. The typical value for the height of the legs is 2µm; however, it can be controlled with nm range accuracy. Assuming 1µm accuracy for MEMS process, the area which corresponds to a 200µm × 200µm plate has less than 1% of error in each dimension, resulting in 2.01% of error in area. The capacitance initial value is about 185f F . As a result, the range of initial capacitance of the sensor may vary from 180f F to 190f F , based on the fabrication process with 1% tolerance in horizontal dimensions. If sensor laterally deflects by 1µm, the sensor value will vary from 120f F to 380f F .
5
1.3. Different Approaches for Nano-Meter Range Displacement Sensing
For measuring the nano-meter range displacements, we may deploy different modalities, including:
• Optical intensity • Optical phase • Capacitance • Magnetic field • Piezoelectric response
Piezoelectric sensors are deployed in [5,6], but they are not proffered in this work. The disadvantage of this method was that they are not easily reproducible. In addition to this, they are very sensitive to temperature variations.
Magnetic field sensors were employed to measure the displacement in [6]. They are nor proffered, since they are prone to non-linear effects due to interference. Furthermore, it is hard to integrate them in a typical MEMS fabrication process.
Optical methods and capacitive sensing are promising approaches. Optical intensity based separation measuring sensors sense the variation in amplitude of a reflected beam from the target of interest. The reflected beam may be measured using a chargecoupled devices (CCD) with sufficiently high accuracy [7]. Sub-wavelength accuracy can be achieved by assuming a Gaussian beam and then interpolating between CCD elements.
Optical phase based movement detectors employ a laser source to generate a diffraction pattern. The variation in the pattern can be measured using a photodetector. Generally there are two configurations of this method: the Michelson interferometer and interdigitated diffraction gratings [4]. Sub-wavelength accuracy can be achieved using the oprical phase based detectors [4]. The main advantage of the optical methods is their high accuracy. Disadvantage of the optical approaches is that they
6
are not good for integration to the MEMS chip, at least in a fair price.
Capacitive sensors are easy to implement by two electrodes and required wires [8, 9]. There are several advantages for using the capacitive methods for displacement sensing, including the integration of CMOS process with the MEMS fabrication process, high precision, with an easily affordable price and a little sensitivity to temperature. The capacitive method for movement sensing is widely used in the MEMS devices. The precision can be very high, based on the circuit and configuration employed. In [10, 11] they have demonstrated better than 0.002 nanometer resolution for displacement sensing with a bandwidth of 10kHz.
Switched capacitor methods are widely used along with the MEMS process [12– 14]. Advantages of the switched capacitor based sensor interface are that, first they are abundantly used by the capacitive sensor interfaces, and second, they are robust and stable. The major disadvantages of the switching interface circuit is that: high (kT /C) noise for low capacitor values; thermal noise of MOS switches; and folded noise due to the sampled data system. Even though correlated double sampling (CDS) can be used to reduce the noise [12], due to the noise folding and the switch noise, the noise of the SC circuit is further than continuous time counterpart with the same power consumption. Figure 1.3 compares the input-referred noise of SC charge integration with CDS [12], continuous-time current (CTC) sensing using transimpedance amplifier [15], and continuous- time voltage (CTV) sensing [15–18] at 4 × 20f F sensing capacitance. The CTV has better noise performance in comparison to other methods [19].
1.4. Conclusion for Interface Circuit Design Specifications
Among different approaches for displacement sensing, the CMOS based capacitive sensing method is a good choice thanks to the possibility of integration and technology support at an affordable price. The initial capacitance value of the sensor is variable and is not well-controlled. Therefore the interface circuit should be able to detect a wide range of the sensor values. In addition to this, the sensor itself is a single-ended capacitor and may suffer from circuit design issues due to single-ended structure. These
7
Figure 1.3. Different capacitive sensing methods.
are the points that are carefully considered during the design of sensing circuit.
The next chapter will be on the designing of the interface circuit for capacitive sensing of the chip shown in Figure 1.2. Different modalities will be studied and tested for interface circuit, then a method based on conventional switched capacitor capacitive sensing is chosen and implemented. The spikes and higher harmonics of the interface circuit should be reduced or removed before entering into the data converter. Therefore, an anti-aliasing circuit should be used between the interface and ADC circuit. Chapter 3 investigates on the design and implementation of the filter. In chapter 4, the classification and fundamentals and data converters are studied, then a Sigma Delta oversampling data converter is used for conversion. In the fifth chapter, simulations and layout of the circuits are drawn, then conclusions are drawn.
8
2. DESIGN OF SENSOR INTERFACE
This chapter describes the interface circuit design and related linearity and noise analysis. During this thesis, different configurations have been designed and analyzed to define a proper architecture. In this chapter, we explain these methods, compare the pros and cons of each approach, and continue with the selected approach. Afterwards, we analyze the noise performance of the interface circuit in order to make sure that the method will meet the noise performance required by the data conversion step.
Three different methods have been studied:
• Differential difference amplifier based. • Emulated resistors on the drain of the buffer. • Conventional switched capacitor amplifier as the sensor interface.
Following sections explain these circuits.
2.1. Differential Difference Amplifier Based Interface Circuit
This method is proposed in [19] for capacitance to voltage conversion. Fully differential capacitors are measured with a high accuracy for accelerometers. The circuit is shown in Figure 2.1. The flicker noise and noise folding are reduced through the chopping stabilization technique with a sufficiently high chopping frequency. The dc offset is removed by the feedback stage of the differential difference amplifier (DDA). The sensor input-referred noise is minimized by sizing the input transistors to achieve optimum capacitance matching. A differential difference amplifier (DDA) is used to automatically cancel the dc offset due to circuit mismatch and to calibrate the ac offset due to sensor position mismatch.
While the circuit operates in continuous-time mode, robust dc bias at the highimpedance sensing electrodes is established by low-duty-cycle periodic reset to prevent
9
Figure 2.1. Block diagram of capacitive sensing stage proposed by Wu et al., The mechanical offset is removed by an external ac signal. Offchip capacitor removes the dc offset of the circuit.
the undesirable charging and the resulting bias voltage drift problems. This bias scheme provides a low-impedance dc path, ultra-high ac impedance above G level, ultra-small parasitic capacitance below 10f F , and negligible noise folding at the same time, therefore, minimum noise is injected by the biasing circuit [19].
Replacing the first stage of Figure 2.1 by Figure 2.2, the output will be linear with respect to displacement of a single ended sensor.
The linearity of the circuit shown in Figure 2.2 is 99.65% (by first order interpolation of the output data points) we use it as the first stage. Coupling capacitors at the gate of NMOS are responsible for the isolation of the flicker noise from the being chopped to higher frequencies.
A test regarding the linearity of the proposed first stage is shown in Figure 2.3. As shown in the figure, limited swing is an important drawback for the proposed DDA based configuration. As a result, it might not be a good choice for sufficiently high signal to noise ratios. In addition, the effect of the third harmonic at the output should be studied carefully.
10
Figure 2.2. Modification of the first stage of circuit proposed by Wu et al. to meet the linearity with respect to the displacement.
Figure 2.3. Linearity and swing of the proposed first stage, as modification of the work conducted by Wu et al., as sensor’s value initially set to 200f F and displacement happens from 2 to 3µm .
11
Figure 2.4. Proposed stage with emulated resistors in drain of the transistors. The value of the resistor depends on the gap size of the capacitors. CMOS transistors provide constant current.
2.2. Emulated Resistor Based Interface Circuit
To correct the effect of limited signal to noise ratio and swing in the differential difference amplifier based interface circuit, a new method based on the the switched capacitor based emulated resistor at the drain of the input buffers is proposed. Figure 2.4 shows the proposed circuit. Using the proposed stage and block diagram shown in Figure 2.5, a rail to rail output swing can be derived. The capacitor CL acts as a low pass filter and removes effect of the spikes, as well as isolating the dc values of the two sides. The output swing versus linearity of proposed circuit is shown in Figure 2.7. Third order inter modulation distortion is sufficient for a linear displacement to voltage conversion. According to the simulations, signal to noise ratio of the proposed stage is sufficient for over 10 bits of analog to digital conversion. For intuitive noise analysis of the circuit, let’s first recall that the equivalent resistor of the switched capacitor circuit is equal to:
Req =
1 fclk Csen/ref
(2.1)
12
Figure 2.5. Conceptual diagram of the proposed emulated resistor based sensor interface.
Assuming Csen = Cref , the cutoff frequency of the low pass filter made by CL would be equal to :
ωc =
1 2Csen fclk = Rtot CL CL
(2.2)
Equation (2.2) implies that increasing CL or decreasing the clock frequency of switching will reduce the total noise at the differential end of the circuit.
Noting that noise sources are flicker noise of the MOS, plus the thermal noises due to the switching and MOS transistors, total noise of the circuit can be derived as:
T otalN oise =
p F licker2 (M OS) + T hermal2 (M OS + Switching)
(2.3)
Figure 2.6 shows the contribution of flicker and thermal noise. As seen from the figure, the major part of the noise comes from the small capacitors which contribute to the thermal noise of the circuit. Therefore, the boundary of the SNR of the proposed circuit is defined by the sensor capacitance value.
13
Figure 2.6. Comparative simulation of the contribution of different noise sources to the total noise of the circuit.
The problem of this circuit is its high sensitivity to the value of the reference signal. With a small variation in the fabrication process, the output value might be out of dynamic output range and the result can be invalid. Therefore, the use of this stage requires advanced techniques, like adaptive clock for switched capacitor resistors, and it implies the presence of complex circuits for adapting the clock frequency to the sensor capacitor.
2.3. Switched Capacitor Amplifier-Based Interface Circuit [1]
Singh et al. [20] proposed a method to convert a single-ended sensor’s capacitance variations to a differential output. The circuit which is used in this work is similar to [20] except that instead of a resistor in feedback (FB) path, an emulated switchedcapacitor (SC) resistor is used.
This method is prevalent for most capacitance sensing interfaces. Since the output voltage has medium range of swing, it is sufficiently robust to variations in the MEMS fabrication process. The main circuit is a simple switched capacitor amplifier, where one of the capacitors replaced by the sensor.
14
Figure 2.7. Output swing for the sensor with initial value of 200f F . Later on, the gap size varies from 2 to 3µm and the corresponding output voltage measured and drawn.
Figure 2.8 shows the general configuration of the proposed circuit. During Φ1 (Φ1 high) both C1s and C1r capacitors1 are charged through IB to Qs = C1s (V1 − Vi− ) and Qr = C1r (V1 − Vi+ ). Assuming2 C2r = C2s = C2 , C1r = Cr and C1s = Cs , in the second phase, the charge is transferred to C2 and generates a voltage3 :
Vo+ =
Cs (V1 − Vi− ) Cr (V1 − Vi+ ) , Vo− = C2 C2
∆Vout = Vo+ − Vo− =
Qs − Qr (Cs − Cr )(V1 − Vi ) = C2 C2
(2.4a)
(2.4b)
By assuming ∆C = Cs − Cr and Vin = (V1 − Vi ) we may rewrite (2.4) in the following form:
∆Vout = 1
Vin ∆C C2
(2.5)
Notation s states sensor side of differential configuration, r states reference side, and se stands for single-ended. 2 Otherwise a nonlinear offset due to mismatch of C2r and C2s will appear at the output; however, it can be solved by advanced offset removal techniques. 3 For an operational amplifier with sufficiently high gain, Vi+ = Vi− = Vi can be assumed.
15
Figure 2.8. Amplifier-Based capacitive sensing. The circuit is simply a switched capacitor amplifier, where one of the capacitors replaced with the sensor.
Equation (2.5) implies that the output voltage linearly varies with the sensor’s capacitance.
Due to high importance of noise, noise analysis of a commonly used single-ended to differential capacitive sensor interface circuit is presented in the following sections and calculations are compared with simulation results. Approximate expressions for the output referred thermal noise in track mode and hold mode are derived. The interface circuit converts the capacitance variations of a single-ended sensor into a differential output voltage which varies linearly with respect to the sensor’s capacitance. The investigated circuit uses three switches in order to convert sensor variations to voltage. The circuit is simulated with ELDO in U M C130nm technology and kT/C noise is calculated and compared with simulation values.
2.3.1. Noise Analysis of Switched Capacitor Amplifier Based Readout Circuit
Discrete time sensing techniques offer numerous advantages over their continuous time (CT) counterparts especially for power consumption of the circuit; however, their
16
noise performance is worse than CT sensor interface circuits [19]. Measuring low capacitance values mostly suffers from parasitic capacitance, especially when measured capacitance value is comparable to CMOS circuit intrinsic parasitics.
The main noise sources are flicker and thermal noises of the amplifier and thermal noises of the switches. Flicker noise depends on the surface area of the CMOS transistor and can be reduced by larger input stages [21, 22]. In addition, due to low frequency behavior of the flicker noise and for high precision circuits, techniques such as correlated double sampling (CDS) or chopper stabilization [21] could be used. Therefore, thermal noise due to opamp and kT/C noise from switched-capacitors are the major sources of noise in these circuits. The noise in each phase is the sum of the switching noise in that phase and the noise folded from the previous phase. The noise value should be separately calculated for each phase. Total noise of the circuit is the sum of the shaped opamp and switch noises in two phases.
2.3.1.1. Thermal Noise of the CMOS OTA. In this work, folded cascode operational transconductance amplifier (OTA) with PMOS input stage is used as shown in figure 2.9 [23] . 2 Input referred noise of M1 is equal to V¯n1 = 4kT ( (3g2m1 ) ). The thermal noise of 2 = ( 83 )kT gm3 . Therefore, the noise due to M3 referred to the input of the OTA M3 is I¯n3 gm3 2 can be written as V¯n3 = 8kT (3g 2 ) . Similarly, the contribution of M12 to the noise at m1
gm12 2 the input stage is V¯n10 = 4kT (3g 2 ) . Since M10 is degenerated, its corresponding noise m1
contribution is reduced and can be neglected. Similar noise values come from M2,4,11 . Since these noises are related to different devices, they are not correlated and appear at the differential output independently. Therefore, they can be calculated separately and summed finally to achieve the total noise. Adding noises due to M1,3,12 , the equivalent input referred thermal noise of the op amp at each of the input nodes is derived as: 8 kT gm3 + gm12 2 (1 + )nf , V¯neq,op,in = 3 gm1 gm1
(2.6)
17
Figure 2.9. Folded cascode OTA with PMOS input stage. For simplification CMFB is not shown.
18
where the noise factor nf depends on architecture. The current passing through M3 is 20% less than M12 , implying gm12 = 1.25gm3 . Substituting these results in (2.6) we derive a simpler expression: gm3 + 1.25gm3 8 kT 2 (1 + )nf V¯neq,op,in = 3 gm1 gm1 8 kT gm3 = (1 + 2.25 )nf 3 gm1 gm1
Equation (2.7) implies that if M1 is much larger than M3 then
(2.7)
gm3 gm1
will be min-
imized and therefore noise of the OTA will be reduced. However, in reality even with the large input stage, this ratio is not as small as the calculated ratio. Assuming gm3 gm1
' 0.5 equivalent power spectral density (PSD) of input referred thermal noise of
OTA becomes: 16kT 2 V¯neq,op,in ' 3gm1
(2.8)
The next step is to analyze the noise of the OTA under feedback condition as shown in Figure 2.8. Similar to [22], only the noise effect is considered and signal 2 is assumed to be zero. Assuming V¯noise,in is one arbitrary input referred noise and
opamp is compensated properly in the frequency range of interest (loopgain ≥ 1), the closed-loop transfer function can be approximated by the one pole expression:
H(s) =
Vout G0 = Vin+ 1 + sτ
(2.9)
where G0 is determined by the FB factor of the stage and by the dc gain of the opamp stage A0 , and τ is settling time constant. Assuming A0 >> β1 , G0 is equal to:
G0 =
and τ is given by
C0 (βgm1 )
1 1 C1 =1+ 1 ' β C2 β + A0
(2.10)
C2 , where C0 = CL + (CC11+C for folded cascode structure, similar 2)
19
to [22]. The PSD of the input white noise is shaped by the first order low-pass behavior of equation (2.9) and it is transferred to the output node. The mean square (MS) value of the noise at the output could be calculated by integrating the shaped PSD of the noise over all the frequency range from zero to infinity:
2 V¯noise,out
Z = 0
∞
2 2 H(j2πf ) 2 df = 16kT nf G0 V¯neq,op,in 3gm1 4τ
(2.11)
The output of unity-gain FB could be achieved simply by setting β = 1(C1 = 0) in (2.11): 4kT nf 2 V¯noise,out = 3gm1 τ
(2.12)
τ is related to configuration of the circuit in each phase4 . The contribution of opamp noise in each phase is different and discussed in 2.3.1.2 and 2.3.1.3.The approach above could be generalized and extended to switching noise. When thermal noise with a white spectrum Sv (f ) is processed through a first order low pass filter (LPF), the result is not white noise any more and its PSD has a f3dB = G2 Sv 2 V¯noise = 0 4τ
1 2πτ
and a MS value:
(2.13)
2.3.1.2. Thermal Noise in Phase I. Figure 2.10 depicts the circuit noise model during phase I. Noise due to switch S1 is related to one device; therefore, it is correlated and canceled out at the output. However, the noise is shaped by different gains and a portion of that appears at the output. Input referred noise power due to the switch 1 + Ron )Cs S1 is equal to 4kT Ron . Time constant of Cs during phase I is τ = ( gm1
and similarly for Cr . Due to low-pass behavior of transfer function of the opamp, the white noise is shaped by f3dB = 1/(2πτ ). Using the brick-wall filter approximation,
For assumption β ∼ = 1 minimum noise can be achieved. β is always greater than 1 based on FB path gain. 4
20
Figure 2.10. Noise model circuit when Φ1 is high.
the integrated noise from frequencies zero to infinity due to switch S1 can be derived: 2 V¯sw,p1
√ Cs Cr 2 | − | = 1 C2 (1 + gm1 Ron ) C2 kT
√
(2.14)
Equation (2.14) implies that the noise due to phase I is canceled out completely if capacitor values are symmetric at both sides(i.e. Cs = Cr ). For asymmetric values of capacitors, noise voltages are subtracted, since the noises are correlated for both halves.
For the thermal noise of the opamp, since noise sources are uncorrelated, they appear independently at the differential output. Using (2.8), output referred noise of the opamp during phase I is given by:
2 V¯op,p1 =
4kT nf 1 1 ( + ) 3(1 + gm1 Ron ) Cs Cr
(2.15)
During phase I, the charge noise on Cr and Cs transfers to the two C2 capacitors; however, during phase II, both ends of C2 are short circuited and no charge noise
21
Figure 2.11. Noise model circuit when Φ2 is high.
appears on C2 which can be derived as: 2 V¯op,p1 =
Cs Cr 4kT nf ( 2 + 2) 3(1 + gm1 Ron ) C2 C2
(2.16)
Therefore, the total noise during the phase I is : 4kT nf Cs Cr ( 2 + 2) 3(1 + gm1 Ron ) C2 C √ √ 2 Cs Cr 2 kT + | − | 1 C2 1 + gm1 Ron C2
2 V¯n,tot1 =
(2.17)
2.3.1.3. Thermal Noise in Phase II. During phase II, S1 is open and S2s and S2r are conducting, as shown in Figure 2.11.
Noises due to switches S2s and S2r are related to two different devices; therefore, they are uncorrelated. The noise due to switches S2s and S2r can be modeled as current 2 sources entering the input whose value is I¯nR = on
the input node is approximately switching in phase II is
4kT . 2 R gm1 on
1 ; gm1
4kT . Ron
The equivalent impedance at
therefore, equivalent input referred noise due to
The time constant of Cs and Cr during phase II is
22
τ =
Cs gm1
and a similar term exists for Cr . As result, the noise due to switches in this
phase can be obtained as:
2 V¯sw,p2 =
kT 1 1 ( + ) gm1 Ron Cs Cr
(2.18)
Consequently, output referred noise of the opamp during phase II, whose noise is transferred to C2 in next phase, can be obtained as: Cr 4kT nf Cs 2 ( 2 + 2) V¯op,p2 = 3 C2 C2
(2.19)
Therefore, the total noise during phase II is: 4kT nf Cs + Cr kT 1 1 2 V¯n,tot2 = ( )+ ( + ) 2 3 C2 gm1 Ron Cs Cr
(2.20)
2.3.2. Total Noise and Optimal Operating Point
Total noise is equal to the sum of the noises in phases I and II. Summing expressions (2.17) and (2.20), the total uncorrelated noise of the interface circuit can be derived as: 4kT (Cs + Cr )nf 4kT nf Cs + Cr 2 V¯n,tot = + ( ) 2 3C2 3(1 + gm1 Ron ) C22 √ √ Cs Cr 2 kT kT 1 1 + | − | + ( + ) 1 C2 gm1 Ron Cs Cr 1 + gm1 Ron C2
(2.21)
Assuming Cs = Cr = C1 and defining x = gm1 Ron , the structure will be an amplifier with gain C1 /C2 and equation (2.21) can be simplified as: 2kT 4 4 1 8kT C1 2 ( + + )+ V¯n,tot = C1 3 1 + x x 3(1 + x) C22
(2.22)
23
(2.22) implies that noise is reduced for large x. The interesting result is that for SC amplifier, most of the noise is due to opamp and its effect is more significant if the noise factor is added. By taking smaller switches and increasing tail current of the opamp, the optimized operation point can be realized.
2.3.3. Simulation Results
For simulation, umc 130nm technology is used with ELDO. The supply voltage of the circuit is ±0.6V and the switches work at 1M Hz with 50% duty cycle. In order to minimize the effect of harmonics on the extracted noise voltage, IB set to 25nA. The size of NMOS switches is such that Ron = 8kΩ and gm1 = 2.4mS. This will minimize output referred noise through maximizing gm1 Ron . Capacitors are C2 = Cr = 300f F . Calculated and simulated values for different Cs are shown in Table 2.1. For these values, noise is simulated with transient analysis and the noisy signal is subtracted from the noiseless one, then the PSD of the noise and its integral are calculated using MATLAB [24]. Integrated noise over all frequencies gives the total noise of the circuit.
Figure 4.13 shows the PSD of output noise for three cases: noiseless OTA and flicker noise turned off, thermal noise of the opamp is added to the simulation, and flicker noise is also added. The noise in the SC-emulated resistor has low pass behavior; however capacitors fold the noise of all frequencies, spikes, etc.
The results verify that the main source of noise in this interface circuit is opamp noise. Due to folded cascode architecture of OTA, appropriate noise factor for OTA in this simulations is nf = 1.33. The simulations verify the model proposed. The most important result of this modeling is that the major part of noise rises from the amplifier. It implies the importance of low-noise design of the amplifier for the noise reduction in the sensor interface stage.
24
Cs
Table 2.1. Results of simulation and calculation values Noise Type Noise Source Simulations Calculated
100f
Thermal
Switches
4.65nV 2
5.34nV 2
100f
Thermal
Switches,OTA
46.31nV 2
39.57nV 2
Switches,OTA
52.33nV 2
NA
100f Thermal,Flicker 200f
Thermal
Switches
3.79nV 2
2.26nV 2
200f
Thermal
Switches,OTA
48.62nV 2
45.08nV 2
Switches,OTA
53.22nV 2
NA
200f Thermal,Flicker 300f
Thermal
Switches
3.53nV 2
1.44nV 2
300f
Thermal
Switches,OTA
52.35nV 2
52.80nV 2
Switches,OTA
56.56nV 2
NA
300f Thermal,Flicker
Figure 2.12. Flicker and Thermal of all components, Only Thermal and Only Switches’ Thermal . Integrated noise for SC-emulated resistor (fully switched capacitor) is 56.56nV . Cs = 300f
25
3. ANTI ALIASING FILTER
When developing data acquisition (DAQ) systems, it is usually necessary to place an antialiasing filter before the analog-to-digital converter (ADC) to remove highfrequency noise and signals. Figure 3.1 shows the general circuit diagram for this type of application [25].
In order to design a filter, first we describe different models of filters. Then, a filter is designed based on the typical switched capacitor biquad filter.
3.1. Filters
Filters in electronics are the circuits which select and pass the useful frequencies, while ban the useless parts of the signal (e.g.,harmonics) or out of band noises.
3.1.1. Different Filter Types
The most commonly used filters are:
• Butterworth Filters: The frequency response of the Butterworth filter is maximally flat (has no ripples) in the passband and rolls off towards zero in the stopband [26]. Butterworth filters
Figure 3.1. Topology of a typical data converter system.
26
have a monotonically changing magnitude function with ω, unlike other filter types that have non-monotonic ripple in the passband and/or the stopband. • Chebyshev I Filters: Type I Chebyshev filters are the most common types of Chebyshev filters. They have ripples in the passband and no ripples in the stopband. • Chebyshev II Filters: Also known as inverse Chebyshev filters,Chebyshev II filters are less common because they do not roll off as fast as Type I, and require more components. They have no ripple in the passband, but have ripples in the stopband. • Elliptic Filters: Elliptic filters have the steepest cutoff of any filter for a specified order and ripple. • Bessel Filters: Bessel filter are linear filters with a maximally flat phase delay, which preserves the wave shape of filtered signals in the passband. Bessel filters are often used in audio crossover systems.
3.1.2. Realization of Switched Capacitor Biquad Filters
Since the circuit is a precision circuit with a high sensitivity to amplitude, the maximally flat filter of Butterworth is a good choice. The expected cutoff frequency is set to 100kHz in order to reduce the out of band noise and spikes and harmonics of the interface circuit. On the output side, it delivers data for the next stage, which is a switched capacitor sigma delta converter.
3.2. Specifications of the Filter
In order to have the minimum components and complexity, second order Butterworth is sufficient for our application. Undisputedly higher order filters have better performance, but in regard of less complexity, fewer components and less power dissipation, the minimum order filter has more advantages over higher orders.
27
Figure 3.2. Basic relationship of fS , fGBW , fP EAK , and fC . There are six frequencies that impact the design of this filter [25]:
• fsignal : Input signal bandwidth • fLSB : Filter frequency with a tolerated gain error that has a desired number of least significant bits (LSBs). It is preferable that fLSB is equal to fSIGN AL • fC : Corner frequency of Low-pass Filter (LPF) • fP EAK : Amplifier maximum full-scale output versus frequency • fS : Sampling frequency of the next stage (ADC) • fGBW : Amplifier unity gain bandwidth
Figure 3.2 shows the basic relation of these frequencies. For the following evaluation, the filter system will work with the following throughout:
• Input signal bandwidth of fsignal = 20kHz • Low-pass filter Corner frequency of fC = 200kHz • SD-ADC sampling frequency of fS = 12.5M Hz • Unity gain bandwidth of fGBW = 800M Hz
Now, we should determine the magnitude of the acceptable gain error from the LPF [27]. This gain error does not occur instantaneously at the frequency that is chosen to be measured. The LPF gain error progressively gets larger with frequency at DC, this gain error is zero. . An LSB error in dB is equal to:
20 × log
2N –err , 2N
(3.1)
28
Figure 3.3. Flowchart for extracting the transfer function of Butterworth filter.
where N is the number of converter bits and the whole number, err, is the allowable bit error. In our case, the signal bandwidth is 20kHz and acceptable gain error is equal to one code, which is equivalent to 1 LSB. For a 10-bit ADC where err equals 1 and N equals 10, the gain error equals –8.49mdB. This value is the gain difference of the dc and required passband frequency. The components and clock frequencies are chosen to satisfy to required precision.
3.3. Realization of Filter
3.3.1. Extraction of the Transfer function
In order to design the second order switching Butterworth filter, we use MATLAB code, which it’s flowchart is shown in Figure 3.3, for extracting the transfer function in Z domain.
Therefore, the transfer function which is returned by the code is as follows:
T (z) =
0.0023572(z + 1)2 (z 2 − 1.858z + 0.8675)
(3.2)
29
Figure 3.4. 2nd order Butterworth filter.
Filter response for this filter is shown in Figure 3.4
3.3.2. Circuit Implementation
In order to realize the transfer function, we use the switched capacitor high Q biquad filter [28]. The transfer function of the biquad filter shown in the Figure 3.5 is as follows: 00
0
00
00
0
Vout C z 2 + (C1 C3 + C1 C3 − 2C1 )z + (C1 − C1 C3 ) H(z) = =− 1 2 Vin z + (C2 C3 + C3 C4 − 2)z + (1 − C3 C4 )
(3.3)
Feedback capacitors are set to 1pF and appropriate values for the other elements are depicted in table 3.1 . Frequency response of the filter extracted by several transient analyses and shown in figure 3.6. In addition to this, total noise appeared at the output of the filter and before filter visually and quantitatively is shown in Figure 3.7.
30
Table 3.1. Capacitor values for filter 0
00
C1
C1
C1
C2
C3
C4
52f
0
0
52f
200f
662f
Figure 3.5. High Q switched capacitor biquad filter.
Figure 3.6. Filter frequency response after realization. Gain error is less than 8mdB inside the band.
Figure 3.7. Comparison of total noise of the circuit after passing through the filter and before the filter.
33
4. ANALOG TO DIGITAL CONVERSION
This chapter is investigated to the design and implementation of a digital to analog converter. Initially, basic definitions and fundamentals will be provided. Afterwards, the design and implementation of a switched capacitor sigma delta converter designed and implemented. The application of switching circuits in the CMOS market is rising up thanks to their wide range of advantages over their continuous time counterparts, among which are the stability and power concerns.
4.1. Fundamentals of Data Converters
Figure 4.1 is the block diagram of a typical analog to digital (ADC) converter.
At the input, anti-aliasing filter is responsible for removing the out of band noise and interference signals during sampling. Then, a sample and hold circuit takes the analog input voltage at the sampling phase and holds it while the ADC digitizes it. Based on the sampling speed, data converters are categorized into two classes:
• Nyquist Rate Converters • Oversampling Converters
The process of converting continuous time analog values to discrete time digital signals is named quantization. Figure 4.2 shows the response of an ideal ADC with finite resolution to a ramp input.
Figure 4.1. Block diagram of an ADC.
34
(a)
(b)
Figure 4.2. (a)Output of an ADC for a ramp input. (b) Quantization error of an ADC .
35
The ADC digitizes the analog ramp input signal. In each step, the quantizer generates the same digital code for a range of input values. The difference between the generated code and the original analog value is referred to as quantization error or quantization noise. This error depends on the sampling frequency and the resolution of the ADC circuit. Increasing sampling frequency and resolution might lead to decrease in quantization noise.
Subtracting the corresponding digital value from the real analog value results in the quantization error VQ . If the signal does not exceed the full swing, the error is , where [29] uniformly distributed and limited to ± VLSB 2 VLSB =
F ullScale 2N − 1
(4.1)
It is statistically proven that the average of the quantization error is zero. The ADC is overloaded if the analog signal exceeds the swing range, and then, quantization error exceeds ± VLSB . After quantization, a digital filter removes the unwanted signals 2 and further improves the resolution of the converter.
4.2. Specifications of Data Converters
Some technical terms for describing the performance of a sampled data systems are presented in this section [29–31]. A 3 bit ADC is presumed for describing the terms; however, similar analogy can be applied to a DAC as well. Figure 4.3 shows an ideal transfer curve of a 3 bit ADC and quantization error (Qe ).
• Resolution: Analog resolution (or resolution) is the smallest analog signal variation when digital code changes by only 1 LSB. For example, the resolution of a converter with 10 bits and 1V full scale analog value is 1 ÷ 210 = 977µV . • Differential Non-Linearity (DNL): The maximum deviation of the step size of a real data converter from the ideal
36
Figure 4.3. Transfer curve and quantization error of an ideal 3 bit ADC.
width of the bins ∆ is named differential non-linearity error (DNL). Assuming that Xk is the transition point between successive codes k − 1 and k, the actual width of the bin k is ∆r (k) = (Xk+1 − Xk ); differential linearity error function (DLE) is defined by:
∆=
∆r (k) − ∆ ∆
(4.2)
Figure 4.4 depicts a DNL error diagram for a sample 12 bit converter. DNL is supposed to be less than half a LSB within the entire dynamic range of the ADC. The maximum differential nonlinearity is the maximum of |DN L(k)| for all k. • Integral Non-Linearity (INL): The measure of the deviation from the endpoint-fit line is named Integral NonLinearity (INL). The use of the endpoint-fit line corrects the gain and offset error. Figure 4.5 shows and example of INL plot drawn. The maximum of the INL is the maximum of |IN L(k)| for all k. For the case illustrated in figure 4.5 the INL
37
Figure 4.4. Differential non-linearity error (DNL) of a possible 12-bit ADC.
Figure 4.5. INL obtained with the endpoint-fit line. is 1.3 LSB measuring the deviation from the endpoint-fit line. The INL, as for the DNL, is measured in LSB. • Offset Error: Offset error is the analog value of the digital output word for the input signal which should have ideally produced a zero output. It is the constant difference between the actual finite resolution characteristic and the ideal finite resolution characteristic measured at the vertical jump. Figure 4.6 shows an example of offset error.
38
Figure 4.6. Offset error for an analog-to-digital (a) and a digital-to-analog (b) converter.
Figure 4.7. Gain error for an analog-to-digital (a) and a digital-to-analog (b) converter. • Gain Error: Difference between the ideal and the actual curves at the full scale value, when the offset error has been reduced to zero is defined as the gain error. it is also measured as the difference between the ideal slope of the transfer curve and the actual slope of the transfer curve. • Monotonicity: Monotonicity is the ADC feature that produces output codes that are consistently increasing with increasing input signal and consistently decreasing with decreasing input signal. Therefore, the output code will always either remain constant
39
or change in the same direction as the input [30]. • Accuracy: Accuracy is defined as the difference between the expected and the actual converter responses. The absolute accuracy includes the offset, gain, and linearity errors, but relative accuracy is defined as the accuracy after the offset and gain errors have been removed [32]. • Dynamic Range (DR): Dynamic range is the range of amplitudes that the ADC can effectively resolve. If the signal is too large, it overloads the ADC and if it is too small it gets lost in the quantization noise. It is defined as the ratio of the full scale value to the smallest difference it can resolve (i.e., VLSB ).
DRdB = 6.02N
(4.3)
The input dynamic range can also be defined as the magnitude of the baseband signal power at SN R = 0dB [32]. • Signal to Noise Ratio (SNR): Signal to Noise Ratio is the ratio of the signal power to the total noise power at the output. In Nyquist rate converters, the sampling frequency is usually twice the signal bandwidth. The SNR of a Nyquist rate converter is given as [30]:
SN R = 6.02N + 1.76dB
(4.4)
• Signal to Noise and Distortion Ratio (SNDR): Signal to Noise and Distortion Ratio is the ratio of the signal power to the total noise and the harmonic power at the output [32]. • Spurious Free Dynamic Range (SFDR): Spurious Free Dynamic Range is the ratio of the root-meansquare signal amplitude to the root-mean-square value of the highest spurious spectral component in the first Nyquist zone [30].
40
• Total Harmonic Distortion(THD): Total Harmonic Distortion is the ratio of the sum of the powers of all harmonic frequencies above the fundamental frequency to the power of the fundamental frequency [32]. As a formulation, it can be written as: s T HD =
V22 + V32 + V42 + ... V12
(4.5)
SN RActual − 1.76 6.02
(4.6)
• Effective Number of Bits (ENOB): According to (4.4), it is defined as:
EN OB =
4.3. Classification of Data Converters
Generally speaking, data converter systems are categorized into two major classes depending on the sampling frequency used for the process.
4.3.1. Nyquist-Rate Converters
In an ADC system, the analog signal is initially sampled by a sampling frequency, fs in a sample-and-hold circuit, which transforms it into a discrete time analog signal, only with amplitudes at periodic discrete time intervals (Ts = 1/fs ). According to the Nyquist Theorem, the sampling frequency should be more than twice the sampled signal in order to be able to reconstruct the signal from discrete time values. The name of the Nyquist-Rate converter also comes from the Nyquist Theorem. Hence, specifying the Nyquist rate is equal to specifying the bandwidth of the decimation filter. Equation (4.4) gives the equation for Nyquist Rate converters.
41
4.3.2. Oversampling Converters
In oversampling converters, the input signal is sampled at a rate much higher than twice the bandwidth. The oversampling rate, M , as an equation, can be written as:
M=
fs fs = fN 2fB
(4.7)
Obviously, the oversampling ration of 1 equals to a Nyquist Rate sampling. The SNR of an oversampling data converter can be derived as [30]
SN R = 6.02N + 1.76 + 10Log(M )dB
(4.8)
This equation implies that with fewer bits and higher sampling rate, we can achieve higher number of bits. Moreover, it can be noticed that every doubling of the sampling rate improves the SNR performance by 3 dB.
4.4. Delta Sigma Converters
∆Σ converters are classified under the oversampling converters category. They are implemented by two transfer functions: a high pass Noise Transfer Function(NTF) and low pass signal transfer function (STF). As shown in Figure 4.8 the loop has two filters: a forward filter G(z) and a feedback filter H(z). The input signal X(z) is subtracted by feedback signal H(z) and fed into the forward filter, G(z) and is quntized to give the digital output. The quantization introduces an error E(z) which is independent of the input signal and is directly added to the output. Signal is transferred by the STF and noise by NTF, the superposition theorem for linear circuits is applied, and therefore, the output equation of this modulator can be written as:
Y (z) = ST F (z)X(z) + N T F (z)E(z)
(4.9)
42
Figure 4.8. Generalized SD modulator with loop-filter G(z).
We can further find the STF and NTF as:
ST F (z) =
G(z) Y (z) = X(z) 1 + G(z)H(z)
(4.10)
N T F (z) =
Y (z) 1 = E(z) 1 + G(z)H(z)
(4.11)
4.4.1. Noise Shaping in SD Modulators
The basic idea behind Sigma and Delta converters is that most of the in-band noise is pushed away from the signal and results in the further improvements in the SNR. For large G(z) and unity H(z), if the STF approaches 1 and NTF becomes a high pass transfer function, the noise shaping is such that the noise is pushed away to the higher frequencies, while the signal is passed. From this idea, it follows that if filters are implemented using the integrator, G(z) is large around zero frequency.
Further, it is seen that the amount of quantization noise falls into the bandwidth of the oversampled ADC, and results in the improvement of the SNR. Figure 4.9 shows the spectrum at the output of a noise shaping quantizer loop compared to those
43
Figure 4.9. Comparison of noise shaping in the oversampling and Nyquist-Rate data converters.
obtained from Nyquist and Oversampling converters. The noise shaping modulator does not eliminate the quantization noise; rather, it pushes the quantization noise to higher frequencies [33].
4.4.2. Discrete Time vs. Continuous Time Σ∆ Modulator
Modulators can be implemented either as a sampled-data system or in the continuous time domain [32]. The main difference is related to the switched capacitor integrator in the discerete time modulator and RC integrator in the continuous time integrator.Each modulator has its own advantages and disadvantages. Switched capacitor integrators take advantage of fine-line VLSI capabilities by eliminating the need for physical resistors. On-chip and precise resistors are hard to achieve in CMOS process, if not impossible. In addition, resistors in continuous-time integrators are a major source for thermal noise and are required to be small in order to minimize the corresponding noise. For the same time-constant, reducing the resistors implies that the feedback capacitors need to be increased. This makes the on-chip capacitors unfeasible for the sufficiently large capacitors.
Since the time-constant is a function of capacitor ratios (Cs /Cf ) and of the sampling frequency, the frequency response of switched-capacitor integrators can be more accurately predicted . On the other hand, the time-constant of continuous-time integrators is a product of the resistor and the capacitor, and might have considerable variations under the fabrication process. The absolute value of on-chip poly resistors
44
Figure 4.10. (a) Switched-capacitor integrator (b) Continuous-time integrator.
typically varies by 30% from the nominal/desired value, whereas capacitor ratios are usually better controlled (typical variation is only 1%) [32].
Less sensitivity to clock jitter and opamp settling time are another advantage of switched-capacitor systems. As long as the Operational Amplifier (opamp) settles to the required accuracy, it does not matter whether the opamp slews or linearly settles. Continuous-time integrators, however, must be linear at all times [32].
For continuous time converters, since the opamp in an active-RC integrator does not have to settle to full accuracy every half clock period, a very high oversampling ratio is achievable [34]. The oversampling ratio in switched-capacitor integrators is limited by the achievable bandwidths of the opamps. This makes continuous-time modulators very appealing for high-speed applications (e.g.,mmWave ADCs) [32].
Finally, the anti-aliasing filter is required for discrete time systems in order to attenuate energies at multiples of the sampling frequency which may potentially fold down to baseband. Continuous-time systems eliminate the need for an anti-aliasing filter prior to the sigma-delta ADC. This elimination is equivalent to significant power savings for the transducer or receiver [34].
4.4.3. Design of Delta Sigma Converter
Due to numerous advantages of discrete time converters, in this work we implement the ADC in discrete time mode. As mentioned in the previous sections, sampleddata systems take the advantage of better stability and easier implementation. For
45
Figure 4.11. The switched capacitor second order Σ∆ modulator used in this work.
continuous time systems, clock jitter in the feedback (DAC) might be problematic. Furthermore, the interface circuit itself is works with a switching circuit.
4.4.3.1. Second Order Switched Capacitor Σ∆ ADC. The architecture used in this work was proposed in [32]. In this work, we implement the system in 130nm − U M C technology. The architecture is shown in Figure 4.11 . Reference voltages are chosen as ±55mV , which corresponds to reasonable voltage variation due to full scale displacement in the capacitive transducer.
4.4.3.2. Switched Capacitor Integrator. The integrator implemented and used in this work is a switched-capacitor parasitic-insensitive integrator. Since the integrator itself is discrete in time, a sample and hold circuit which is to precede the integrator can be eliminated [32].
The performance of the switched capacitor integrator can be explained by charge transfer over the capacitors. Figure 4.12 shows the architecture of the integrator. It is assumed that the operational transconductance amplifier (OTA) has a high gain and the initial voltage stored on Cf is zero. The operation of this integrator should be examined by the transfer function of this circuit. The integrator employs the bottomplate sampling technique to minimize signal dependent charge-injection. After a few,
46
Figure 4.12. The switched capacitor integrator.
steps we can find the transfer function as:
Vout (z) =
Cs z −1 Vin (z) Cf 1 − z −1
(4.12)
In addition, relative gain error m(ω) due to the finite gain of the opamp can be derived as [32]: 1 C1 (1 + ) A0 2C2
(4.13)
C1 /C2 . 2A0 tan(ωTs )
(4.14)
m(ω) = −
and relative phase error Θ(ω) as:
Θ(ω) =
To design the integrator, and as a whole, the Σ∆ modulator, we need switches, OTA, Digital to Analog Converter (DAC) and latched comparator. Hereafter, the design and implementation of these components are studied.
47
4.4.3.3. Specifications of Desired Sigma Delta Converter. In this thesis, a 10 bit Σ∆ modulator is required. The reason is that for a Black and White image, we need almost 10 bit data for each pixel. This may let us design the initial version of the photo-mechanical Terahertz Camera [3]. The exported data can be transferred to the computer for further processing and a clear image. The sensor interface circuit gives 0 − 200mV of output range for different values of separation in the output. Out target is 100mV swing for the input range of the ADC. The input signal is around DC, but to get a better idea about the performance of ADC, we have a 20kHz input signal. For frequencies near DC, the output in the frequency domain is together with the offset and low-frequency noise components, and it is hard to recognize the SNR and other operational performance of the ADC. To wrap up, the specifications of the ADC are as follows:
• finput = 20kHz • ∆Vinput = 100mV • Resolution: Post Layout 10 Bits • Second Order Sigma Delta • Bandwidth = 70kHz • fsampling = 12.5M Hz • OversamplingRate = 128
Next section will be on the implementation of the components and ADC to satisfy these requirements.
4.5. Implementation of Delta Sigma Converter
This section investigates the design of different components for the Sigma Delta modulator, as well as the full converter design.
48
Figure 4.13. (a) NMOS switch; (b) Transmission Gate (TG) switch.
4.5.1. Switches
Switches are the most common components in a switching circuit. There are two possible approaches to design the switch. The first is to use a simple NMOS as the switch, and the second is to use a pair of NMOS-PMOS transistors as a transmission gate (TG). Figure 4.13 shows both of these switches. The advantage of the NMOS switch is its simplicity and the advantage of TG is less voltage drop in both sides of the switch [30].
Transistors sizing in this thesis for NMOS and TG switching are shown in Table 4.1. For simplicity, NMOS switches are the most common switches, but for the feedback link of the ADC, since the feedback voltage is comparable with the voltage which is dropped on the NMOS switch, TGs are used instead. Table 4.1. Transistor sizing for the switches Switch Type Wn (µ) Ln (µ)
Wp (µ)
Lp (µ)
NMOS
2
0.2
NA
NA
TG
2
0.2
4
0.2
4.5.2. Operational Amplifier
Folded Casocode amplifier is used for the ADC and other parts. The main advantage of the Folded Cascode amplifier for switching circuits is that it is single stage, while providing sufficiently high gain. The problem with multi-stage amplifiers is that
49
their stablization in switched capacitors is more difficult.
The OTA to be designed is to meet the following specifications:
• Voltage Gain, Av = 60dB • SR = 200V /mus • Gain-bandwidth (GB) 120 MHz • Output Voltage Swing, −0.3V 6 Vout 6 0.3V • Power Supplies VDD = 0.6V, VSS = −0.6V • Load Capacitance CL = 2pF
Figure 4.14 shows the implemented folded cascode amplifier. Switched capacitor common mode feedback is used for the OTA. Switching frequency of the common mode feedback (CMFB) circuit set to 5M Hz. Figure 4.15 shows the CMFB circuit. Table 4.2 shows the sizing of the transistors for the OTA. Table 4.3 lists the capacitor values of the CMFB circuit. Transient analysis performed for the OTA. The gain for different frequencies extracted and the frequency response is depicted in Figure 4.16.
Table 4.2. Transistor sizing for the OTA Transistor
W (µ) L(µ) nf ingers
M1,2
20
0.4
20
M3,4
4
0.4
7
M5,6
20
0.4
5
M7,8
20
0.4
30
M9,10
20
0.4
30
M11,12
4
0.4
5
M13
20
0.4
8
Table 4.3. Transistor Sizing for the CMFB Capacitor Capacitance Cc
500f
Cs
100f
50
Figure 4.14. Folded cascode operational amplifier.
Figure 4.15. Common mode feedback circuit.
Figure 4.16. Folded cascode OTA frequency response.
52
Biasing circuit is designed to bias the OTA based on the circuit proposed in [23]. The role of biasing circuit is to provide the voltages required by the folded cascode circuits. NMOS and PMOS transistors in the biasing circuit are adjusted to drive the amplifier circuit.
4.5.3. Latched Comparator
Latched comparator is another important part of the circuit. The quantization is done in this part and its sensitivity to voltage variations is of high importance and directly effects the ADC. The comparator architecture is based on [32] and only it is transferred to 130nm − U M C technology.
Figure 4.17 shows the structure of the employed quantizer. For a typical Nyquist Rate ADC, an 8 bit ADC should have a quantizer with 8 bits of sensitivity. But for the oversampling quantizer, a 1 bit quantizer is enough to work in high sampling rates. Therefore, higher speed has more importance than the precision.
To combine the sample and hold behavior and the comparator and satisfy the speed, a latched comparator is the best choice [32]. Table 4.4 depicts the sizing of the transistors for the designed quantizer.
Table 4.4. Transistor sizing for latched comparator. Transistor
W (µ) L(µ) nf ingers
M1,4
2
1
1
M2,3
10
1
1
M5,6
20
1
1
M8,9
20
1
1
M7,10
5
1
1
M11,13
5.6
0.35
1
M12,14
2.8
0.35
1
53
Figure 4.17. Latched comparator.
Figure 4.20 shows the output of the latched comparator for a sinusoidal signal input. Simulations show that high to low and low to high changes are performed with around 100mV of change Figure 4.19 depicts the sweep for checking sensitivity of comparator.
4.5.4. 1 Bit DAC
A CMOS based DAC used for the feedback link [35]. Even though the required DAC converter is a 1 bit converter and can be implemented with only switches, the CMOS based DAC is a better choice due to several reasons and it results in higher final resolution for the design. Figure 4.18 depicts the employed DAC circuit.
4.5.5. Non overlapping Clocks
Non-overlapping clocks are important. Delayed clocks have 3nS of delay in comparison to their non-delayed versions. ck1 and ck3 are delayed versions of ck2 and ck4 ,
Figure 4.18. 1 Bit DAC for the feedback link.
Figure 4.19. Latched comparator response.
55
Figure 4.20. Latched Comparator sensitivity checking, it works with less than 50mV of variations.
Figure 4.21. Non-overlapping clocks.
58
respectively. Figure 4.21 depicts the non-overlapping clocks employed in the work.
4.5.6. SNR vs. Input Voltage Plot
The input voltage effects the SNR at the output nodes. So, according to the different input voltages, ouput SNRs are recorded and drawn. Figure 4.22 shows the graph of SNR versus input voltages before, while reference voltages are set to ±55mV . The reason for checking the pre-layout values is related to time concerns for post layout simulations. The voltages where the peak SNR for the post layout and pre-layout will be approximately the same and the figure can describe the behavior of the ADC.
Figure 4.22. SNR versus input voltage for Vref = ±55mV .
60
5. SIMULATION AND RESULT
In this chapter, layouts of the individual parts as well as all circuit are drawn. Post layout simulations related to different sections of the circuit is presented and explained.
5.1. Layout of the Circuits
The layout is one of the important steps in the implementation of any integrated circuit. Specifically for design of amplifier, a tiny mismatch in differential configuration may result in a huge offset. An asymmetric layout leads to appearance of the second harmonics and a non-linear circuit. The most important part in the layout of our circuit is related to the folded cascode opamp layout. Very small mismatch results in a DC offset. Therefore, the most precise and symmetric design implemented for the opamp. Another practical point in layout, is related to common centroid layout. Due to variations in the fabrication process, it is better to make any element equally distributed in both sides of the circuit. This leads to a circuit components which are equally effected by the fabrication process. As a result, their variations may be eliminated or ignored by the fully differential structure. Such a technique is used for the capacitors in the design. For example, the CMFB circuit of the folded cascode OTA includes 4 capacitors. As shown in Figure 5.1, these capacitors are halved and equally appeared in both sides of configuration.
For other parts of the circuit, including the filter, DAC, interface circuit and the Sigma Delta circuit, the layout sketched to have the minimum nonlinear effects, as much as possible. In simulation section, we implement the post layout simulation of the circuit for each part.
61
Figure 5.1. Folded cascode OTA layout.
62
Figure 5.2. Second order biquad Butterworth filter layout.
63
Figure 5.3. Sensor interface layout.
64
Figure 5.4. Latched comparator layout.
65
Figure 5.5. 1 Bit digital to analog converter layout.
Figure 5.6. Sigma Delta ADC layout.
Figure 5.7. Positive and negative outputs of the ADC in performing state and the input signal - post layout.
67
5.2. Post-Layout Simulations of the Circuits
In this section, the related simulations of the circuit are presented. Each part initially designed as block. The performance of each block analyzed and after the sufficiently good performance of each block, overall block is implemented. In this section, the simulation result of each sub block presented. In addition, the result of final circuit is shown in Figure 5.9. It shows that the goal of the final circuit is achieved.
Figure 5.8. Post layout simulation of latched comparator.
Figure 5.9. SNR of the post layout ADC.
mismatch in the sensor and reference capacitors.
Figure 5.10. SNR of the post layout complete circuit for Csensor = 100f F and Cref erence = 300f F . Harmonics are due to the
71
6. CONCLUSION AND FUTURE WORKS
6.1. Conclusion
In this thesis, three methods are presented for measuring the small capacitance variations. All of these three methods show acceptably linear response with respect to electrode displacement and gap variations. Due to limited accuracy in MEMS fabrication process, conventional method, which has limited output range, is chosen to guarantee linear operation of the interface circuit for all possible sensor values. Other two configurations have two different disadvantages: for one of the circuits, the output has a rail-to-rail output range and very small variation in the sensor value may result in an out of range output. As a result, it requires very low tolerance MEMS process. The other circuit has very limited output range and requires very low noise amplifiers in the next stages to magnify the output of the interface circuit, consequently leading to an impractical circuit. Therefore, the main advantage of the conventional circuit is related to its low sensitivity to the MEMS fabrication process.
On the other hand, the MEMS process should be carefully performed in the lateral and area dimensions. The accuracy of MEMS process can directly impact the accuracy and linearity of the interface circuit. For a big sensor, in comparison to reference capacitor, or a small sensor, the interface circuit may easily enter to out of range values, resulting in an inaccurate output.
The outputs of the interface circuits include kT /C noise and spikes of the clocking frequency; therefore, a filter before the ADC conversion could improve the SNR and SNDR of the signal. This filter is designed by a second order Butterwoth filter, which works in switched capacitor mode. Afterwards, the noise of the unfiltered signal is compared with the filtered signal. The result shows that the noise in the filtered signal is much smaller than the noise of the interface circuit itself.
72
In the last step, the filter’s output converted to a modulated digital value by an oversampling ADC. A switched-capacitor Sigma Delta is used as the ADC, since it is oversampling converter and it is easier to achieve high data bit conversion. Table 6.1 shows the specifications achieved in the thesis. Table 6.1. Specifications earned in this thesis. Parameter
Specification
Sensing capacitance
120f F − 380f F
Resolution
8.51 Bit
Oversampling Ratio
128
Accuracy
1nm
Supply Voltage
±0.6V
Process
130nm U M C
Power Consumption
4.46mW
Input Signal
20kHz
Signal Bandwidth
70kHz
Inband integrated noise
22.3nV 2 √ 33.4nV / Hz
Noise floor
6.2. Future Works
One of the works that limited time didn’t let us to do is the comparison of the linearity, sensitivity to sensor variations, sensitivity to MEMS fabrication process and maximum achievable bit conversion of the three interface methods. This thesis investigates methods for the interface circuit in an array of capacitive sensors for measuring the displacement, and it is possible to propose more and better sensor interface circuits.
Another problem that can be studied in future, is to use different methods for data conversion part. The reason is that Sigma Delta is a straight forward method, but it is hard to combine the interface circuit with the data converter part. For example, it is possible to directly convert the capacitance value a digital value using SuccessiveApproximation-Register (SAR) or other methods. Therefore, the design of a novel methods, which combines the interface circuit with the ADC for array of sensors,
73
might be a good approach.
Another problem is the offset of the interface circuit, which is less studied for the asymmetric and single ended sensors. There are many available approaches to reduce or remove the effect of offset in the fully differential capacitive sensors, but such methods are less studied for the single ended sensors, and there is a need to design methods to remove the effect of offset in the asymmetric interface circuits.
Finally, it is possible to ask a more basic question: is it possible to design an interface circuit, which converts the capacitance value to a digital value without any specific concern about the range of the sensed capacitor? If so, such a circuit can be widely used for many interface circuits for capacitive readout.
74
REFERENCES
1. Vosoughi, M. A., H. Torun and G. Dundar, “Noise Analysis in Switched Capacitor Amplifier Based Sensors”, CAS (NGCAS), 2017 New Generation of , pp. 249–252, IEEE, 2017. 2. Oh, S. J., Y.-M. Huh, J.-S. Suh, J. Choi, S. Haam and J.-H. Son, “Cancer diagnosis by terahertz molecular imaging technique”, Journal of Infrared, Millimeter, and Terahertz Waves, Vol. 33, No. 1, pp. 74–81, 2012. 3. Bilgin, H., S. Zahertar, S. Sadeghzadeh, A. D. Yalcinkaya and H. Torun, “A MEMSbased terahertz detector with metamaterial-based absorber and optical interferometric readout”, Sensors and Actuators A: Physical , Vol. 244, pp. 292–298, 2016. 4. Ma, H., Capacitive displacement sensing for the nanogate, Ph.D. Thesis, Massachusetts Institute of Technology, 2004. 5. APC International, L., Piezoelectric ceramics: Principles and applications, APC International, 2002. 6. Fraden, J., Handbook of modern sensors: physics, designs, and applications, Springer Science & Business Media, 2004. 7. Ghosh, A. K., Introduction to measurements and instrumentation, PHI Learning Pvt. Ltd., 2012. 8. Puers, R., “Capacitive sensors: When and how to use them”, Sensors and Actuators A: Physical , Vol. 37, pp. 93–105, 1993. 9. Paradiso, J. A., “New technologies for monitoring the precision alignment of large detector systems”, Nuclear Instruments and Methods in Physics Research Section A: Accelerators, Spectrometers, Detectors and Associated Equipment, Vol. 386,
75
No. 2, pp. 409–420, 1997. 10. Baxter, L., “Capacitive sensors: Design and applications”, IEEE Press Series on Electronics Technology, Vol. 1, 1996. 11. Devices, A., “ADXL50 monolithic accelerometer with signal conditioning”, Data sheet, 1996. 12. Lemkin, M. and B. E. Boser, “A three-axis micromachined accelerometer with a CMOS position-sense interface and digital offset-trim electronics”, IEEE Journal of solid-state circuits, Vol. 34, No. 4, pp. 456–468, 1999. 13. Kulah, H., J. Chae, N. Yazdi and K. Najafi, “A multi-step electromechanical Σ∆ converter for micro-g capacitive accelerometers”, Digest of Technical Papers, 2003. 14. Schiffer, B. R., A. Burstein and W. J. Kaiser, “An active charge cancellation system for switched-capacitor sensor interface circuits”, IEEE Journal of Solid-State Circuits, Vol. 33, No. 12, pp. 2134–2138, 1998. 15. Fedder, G. K., Simulation of microelectromechanical systems, Ph.D. Thesis, University of California at Berkeley, 1994. 16. Chau, K.-L., S. Lewis, Y. Zhao, R. Howe, S. Bart and R. Marcheselli, “An integrated force-balanced capacitive accelerometer for low-g applications”, Sensors and Actuators A: Physical , Vol. 54, No. 1, pp. 472–476, 1996. 17. Geen, J. A., S. J. Sherman, J. F. Chang and S. R. Lewis, “Single-chip surface micromachined integrated gyroscope with 50/h Allan deviation”, IEEE Journal of Solid-State Circuits, Vol. 37, No. 12, pp. 1860–1866, 2002. 18. Bernstein, J., R. Miller, W. Kelley and P. Ward, “Low-noise MEMS vibration sensor for geophysical applications”, Journal of microelectromechanical systems, Vol. 8, No. 4, pp. 433–438, 1999.
76
19. Wu, J., G. K. Fedder and L. R. Carley, “A low-noise low-offset capacitive sens√ ing amplifier for a 50-µg/ Hz monolithic CMOS MEMS accelerometer”, IEEE Journal of Solid-State Circuits, Vol. 39, No. 5, pp. 722–730, 2004. 20. Singh, T. and T. Ytterdal, “A single-ended to differential capacitive sensor interface circuit designed in CMOS technology”, IEEE International Symposium on Circuits and Systems, pp. 948–951, 2004. 21. Enz, C. C. and G. C. Temes, “Circuit techniques for reducing the effects of opamp imperfections: autozeroing, correlated double sampling, and chopper stabilization”, Proceedings of the IEEE , Vol. 84, No. 11, pp. 1584–1614, 1996. 22. Schreier, R., J. Silva, J. Steensgaard and G. C. Temes, “Design-oriented estimation of thermal noise in switched-capacitor circuits”, IEEE Transactions on Circuits and Systems I: Regular Papers, Vol. 52, No. 11, pp. 2358–2368, 2005. 23. Gray, P. R. and R. G. Meyer, Analysis and design of analog integrated circuits, John Wiley & Sons, Inc., 1990. 24. Schmid, H., “How to use the FFT and Matlab’s pwelch function for signal and noise simulations and measurements”, Institute of Microelectronics, University of Applied Sciences NW Switzerland , 2012. 25. Baker, B. C., “Designing an anti-aliasing filter for ADCs in the frequency domain”, Analog Applications, 2015. 26. Bianchi, G. and R. Sorrentino, Electronic filter simulation & design, McGraw-Hill New York, 2007. 27. Baker, B., “Analog filters and specifications swimming: Mapping to your ADC”, On Board with Bonnie, TI Blog, 2014. 28. Gregorian, R., K. W. Martin and G. C. Temes, “Switched-capacitor circuit design”,
77
Proceedings of the IEEE , Vol. 71, No. 8, pp. 941–966, 1983. 29. Allen, P. E. and D. R. Holberg, CMOS analog circuit design, Oxford Univ. Press, 2002. 30. Maloberti, F., Data converters, Springer Science & Business Media, 2007. 31. Razavi, B., Principles of data conversion system design, Vol. 126, IEEE Press New York, 1995. 32. Nathany, S. K., Design of a 14-bit fully differential discrete time delta-sigma modulator , Master’s Thesis, Rochester Institute of Technology, 2006. 33. Bourdopoulos, G. I., A. Pnevmatikakis, V. Anastassopoulos, T. L. Deliyannis and D.-S. Modulators, Modeling, design and applications, World Scientific, 2003. 34. Wongkomet, N., A comparison of continuous-time and discrete-time sigma-delta modulators, Ph.D. Thesis, Department of Electrical Engineering and Computer Sciences, University of California at Berkeley, 1995. 35. Chaudhari, J. H. and G. D. Amin, “Design and simulation of 1-bit sigma delta ADC in 0.18 µm CMOS technology”, International Journal of Computer Applications and Information Technology, Vol. 2, pp. 50–53, 2013. 36. Oppenheim, A. V., A. S. Willsky and S. H. Nawab, Signals and systems, Vol. 2, Prentice-Hall Englewood Cliffs, NJ, 1983.
78
APPENDIX A: CALCULATION OF ABSTRACT NOISE BY MATLAB
In order to validate the theoretical noise model, there should be a abstract noise assigned to simulations. Such a noise calculations are not trivial in switched capacitor circuits. Therefore, a reliable method for measuring the noise of the switched capacitor circuits should be presented.
The approach in this thesis is mostly based on the method proposed in [24]. In this appendix, the method briefly described and the codes are attached.
A.1. Spectral Density
It describes the distribution of power into frequency components composing a signal. Each signal can be written as a some of single frequency components, according to Fourier Analysis. Each of these frequency components are called spectrum.
Spectral density has two types: Energy Spectral Density and Power Spectral Density. For the Signals which are concentrated in the specific time interval, the integral of energy over the time is a bounded value. In this case the Energy Spectral Density is used.
For the signals which are expanded over time and have infinite integral energy, the Power Spectral Density can be used. According to Parseval theorem, integration of PSD over the frequency domain is equivalent to the integration of square of the signal in time domain and returns the total power of the signal. For more details, interested reader may refer to [36].
79
A.2. Measuring Noise Value by Matlab
In some cases, there is a need to measure the pure noise value. As an instance, the verification of the theoretic noise model, requires a method to ensure the designers about their model. Some Computer-Aided-Design (CAD) tools have not sufficient mechanism to measure the pure noise in the switching circuits. The reason is that for switching circuits, the transient analysis is required. In that case, the rational value for SNR, SNDR and so forth can be derived by a simple FFT or PSD functions. However, for pure value of the noise, a method is required. Most of the new software (e.g.,Cadence) have tools for transient noise analysis, however, some others suffer from the lack of a user friendly method.
To measure the pure value of the noise in Eldo Mentor Graphics, initially we simulate the circuit in transient noise mode. There are 2 signals available as the result of simulation: noisy and noiseless. By subtracting the noisy signal from the noiseless one, a pure noise signal can be achieved. The important point in these simulations is that as the target value is the noise, it is necessary to keep the input signal only for initiating the simulations. High input signal values may result in the harmonics of the input signal and it may cause misinterpretations in the final values of the noise.
After drawing the pure noise signal, it should be exported in a file for MATLAB. The preferred file format is CV S . The sampling frequency should be sufficiently high for the exported noise values. The typical value which is employed in this work is 20 times greater than the sampling frequency of the circuit. When the file is exported, the rest is done with MATLAB. Following subsection will explain the method for the noise evaluation by MATLAB.
A.2.1. Windowing Function
This function requires windowing in addition to the other values. Window function promises to produce a clearer spectral representation of the signal. Since the signals are not periodic, windowing shapes the signal to a periodic-like signal and
80
makes a better view for real signals, which are not periodic. There are two factors regarding the windowing:
• Coherent Gain • Noise Gain
Assuming the signal values x(i), for i = 0, 1, 2, ..., and windowing function values w(i), for i = 0, 1, 2, ..., the shaped function is as w(i)x(i). Then, coherent gain can be described as: N −1 1 X w(i) CG = N i=0
(A.1)
N −1 1 X NF = w(i)2 N i=0
(A.2)
and noise gain as:
where N is number of input signal components. For a rectangular window, CG = N G = 1. Different values of the windowing factor components are available in table A.1. Hanning windowing is always a good option for switching circuits [30]. Table A.1. Maximum scallop loss and correction factors for different windowing Window
functions. CG NG
ScallopLoss
rectangular
1.0000 1.0000
3.92dB
Hamming
0.5400 0.3974
1.78dB
Hanning
0.5000 0.3750
1.42dB
Bartlett
0.5000 0.3333
−
Blackman-Harris 0.3587 0.2580 Flat Top
0.2156 0.1752
0.83dB −
81
A.2.2. Normalization of the Integrated Spectral Power
Assume that Tsamp is the sampling period of the signal and Tsim as the simulation or measurement time. Then,
fbin =
1 Tsim
=
1 N Tsamp
(A.3)
Then the real RM S value can be derived by the correction factor of scaling:
sn =
N G.fbin CG2
(A.4)
This normalization is critical for getting real RM S values from the signal.
A.2.3. pwelch Function in MATLAB
MATLAB has several functions for PSD calculation. Each of these functions use specific algorithm to find the PSD. Among these algorithms, pwelch function has the best performance for calculation of the RMS noise value [24]. Pwelch function of the MATLAB has the pretty complete algorithm for calculating the RM S value of a signal or noise.
Assuming signal x is given, we can get the data of the one sided periodogram of x with [P xx, f ] = pwelch(x). This function cuts up the signal to eight segments with half overlap, each. In practice, we obtain this number by actually executing [P xx, f ] = pwelch(x) and size(f ). So signal values are actually re-used to give better frequency resolution, but the averaging factor simply is na = 8. he windowing appropriate for switching circuit cases is hanning window with its correction factor. The final code is shown in Figure A.1.
82
Figure A.1. The MATLAB code used for power spectral density and calculation of pure noise.