Resonance models describe a wide variety of musical sounds using .... of 1986 International Computer Music Conference, La Haye, 1986. [W97]. B. B. Welch.
A 3D Graphical User Interface for Resonance Modeling Amar Chaudhary
Adrian Freed
Sami Khoury
David Wessel
Center for New Music and Audio Technology University of California 1750 Arch Street Berkeley, CA 94709 {amar,adrian,khoury,wessel}@cnmat.berkeley.edu Resonance models describe a wide variety of musical sounds using perceptually-meaningful parameters. The compact representation of resonance models allows efficient storage, modification and real-time implementation. Widespread adoption of resonance models has been hampered by the lack of specialized tools to display and manipulate them. We demonstrate here a novel 3D editor designed for musicians, composers and sound designers to manipulate sounds described by resonance models. Visualization and modification of resonance parameters is based on familiar metaphors from the physical world. The editor is a component of OpenSoundEdit, a portable sound-editing framework. 1. Introduction A resonance model describes the response of an acoustical system to sound input. Benefits of resonance models include high quality real-time synthesis; selecting resonances by frequency, amplitude, and duration regions; incorporating transposition models that reshape the spectrum; and generating harmonic or inharmonic series. Since the entire temporal evolution of each decaying sinusoid is defined by a single parameter, resonances are very efficient to store and modify. Furthermore, resonance models use a uniform representation for a wide variety of sounds affording effective timbral interpolation and extrapolation, and efficient real-time implementation. The filter bank interpretation of resonance models allows them to be used for sound modification and cross synthesis. Widespread adoption of resonance models has been hampered by the lack of specialized tools to display and manipulate them. We demonstrate here a novel 3D editor designed for musicians, composers and sound designers to manipulate sounds described by resonance models. Section 2 of this paper provides an overview of resonance modeling. Section 3 describes the editor and illustrates its use through examples. Section 4 discusses implementation issues and section 5 concludes the paper. 2. An Overview of Resonance Models Resonance is the response of an acoustic system to a sound source, called an excitation [PBB86]. A wide variety of natural musical sounds can be modeled using excitations and resonances. If the excitation is an impulse, the response is a set of exponentially-decaying sinusoids: N
x(t ) = ∑ 10 gi / 20 e − π k i t cos(ω i t + φ i )
(2.1)
i =1
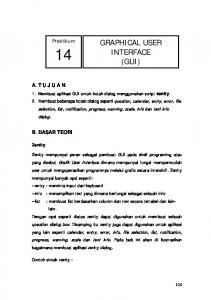
where gi, ωi, ki and φi are the gain (i.e., initial amplitude, expressed in decibels), frequency, bandwidth and phase of the ith sinusoid, respectively. The gain determines initial energy of the resonance, and the bandwidth determines the rate of decay. A smaller bandwidth means a longer decay, and a bandwidth of zero means the resonance stays at constant energy. The resonance model is the set collection of N quadruples {ωi, gi, ki, φi}. Resonance models can be more generally realized using a bank of second-order filters. The filter realization of a resonance model can be applied to any excitation source. We now describe a method for viewing and editing resonance models that is independent of the realization. 3. The ResonanceEditor The ResonanceEditor is a specialized component of OpenSoundEdit, an extensible framework for visualizing and editing sound representations [CFR98]. In OSE, sounds are displayed in a 3D display window, as shown in Figure 3.1.
1
The Display Window Frequency selection labels in Hertz and standard pitches
Ground and sky metaphors establish horizontal plane. Moveable frames used for 2D projections of the model and selection of components
Selected partials are highlighted
External editing controls for the selected ResonanceEditor. Figure 3.1. The ResonanceEditor in OpenSoundEdit..
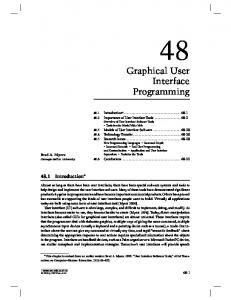
The visual appearance of the OSE 3D display consists of an earth-tone ground plane and blue sky, establishing a familiar and unambiguous horizontal plane. Basic navigational controls are provided that favor a familiar orientation perpendicular to the ground plane. These navigational controls are constrained to translation on the ground plane, rotation about the y-axis and flying in an arc over the current position, as illustrated in Figure 3.2.
frequency
frequency
time
time
frequency
time
Figure 3.2. A ResonanceEditor as viewed from different perspectives. Time and frequency directions are shown.
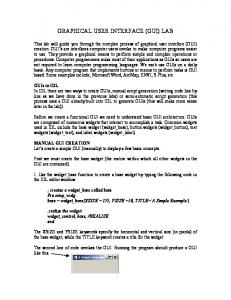
As sound objects are brought into the editor world, they are assigned an available region on the ground plane and a specific ResonanceEditor is instantiated to operate on them. The ResonanceEditor starts by drawing a framework of axes. A time/frequency axis is drawn on the ground plane. The vertical axis represents the logarithm of resonance amplitudes. Resonances are drawn in 3 dimensions as lines parallel to the time/log amplitude plane with negative slopes with respect to the time axis. Each line represents the exponential component of the impulse response of a second order resonating filter, i.e., a decaying sinusoid, as described in Equation 2.1 The endpoints of this line are (0, gi, ω) and (t′i, Amin, ω) where Amin is the user-definable threshold of hearing, and t′i is the time at which the energy of the resonance reaches Amin, calculated as follows: t i′ =
g i − Amin π ( log10 e)ki
(3.1)
If the bandwidth ki is zero, the resonance is represented by a horizontal line starting at (0, gi, ωi).
2
Amplitude A
gi
Frequency ω ωi
Amin t′i
Time t
a) Visualization model
b) A ResonanceEditor
Figure 3.3. Resonance model visualization.
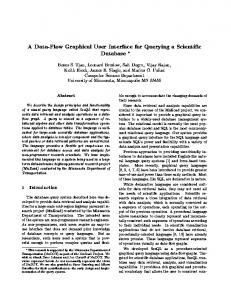
The ResonanceEditor view includes moveable time-selection and amplitude-threshold frames parallel to the frequency-amplitude and time-frequency (i.e., ground) planes, respectively. The time-selection frame can be moved along the time axis and black lines representing the amplitude values at the selected time are projected on the frame. Visually speaking, these lines are the shadows formed by the yellow exponential-decay lines on the time-selection frame. The threshold frame can be moved along the amplitude axis, change the value of Amin. Shadow lines indicating how long each resonance lasts until its energy reaches the threshold are drawn on the frame. The time is calculated using Equation 3.1. Resonance partials to be edited are specified by selecting a frequency range along the top bar of the time frame. Selected resonance partials can be transposed, gain-scaled or time-scaled. They can also be cut, copied and pasted into other ResonanceEditor views, as illustrated in Figure 3.4.
A tubular bell model.
Selected partials.
A tam-tam model.
Tubular bell partials are pasted into the tam-tam model
Figure 3.4. Selecting, copying and pasting resonance partials. Click on each image to hear the associated audio.
3
4. Implementation Issues The ResonanceEditor is implemented as an extension to OSE and written using C++ and Tcl/Tk, a scripting language and user-interface toolkit [W97]. The ResonanceEditor code is platform-independent and uses graphics and user-interface routines provided by OSE. Real-time audio feedback is achieved using a synthesis server, an application that produces sound in response to Open Sound Control (OSC) messages [WF97]. Current synthesis servers implement both exponentially-decaying sinsusoids and filterbanks [C97]. The Sound Description Interchange Format [W98] is used to read and write files and share models with other users and applications. The ResonanceEditor implementation has been run successfully on an SGI O2 running Irix 6.3 and an Intel Pentium Pro 200Mhz running Windows NT 4.0. More detailed information about the implementation can be found in the OSE report [C98]. 5. Discussion The 3D interface adopted in the ResonanceEditor provides the user a more expressive and intuitive view of sound representations that previously required special mappings onto two dimensions [F97]. Direct manipulation allows efficient editing of sound representations using familiar gestures, such as pulling, stretching and sweeping. Early tests underscored the need for 3D interface models that are well-known. For example, early versions of OSE displayed sounds on a completely black background and allowed the user unconstrained translation and rotation of the viewpoint. Such an interface presents the user with the metaphor of “flying through space,” which is unfamiliar and disorienting. The addition of the ground and sky metaphors provide a familiar orientation, which is further enhanced by constraining movement to be parallel to the ground plane. Furthermore, properties of familiar 3D environments can be used to provide additional useful information. For example, the black lines projected onto the time and threshold frames use a familiar “shadow” metaphor for projecting the three dimensional representations onto two dimensions. The shadows afford different viewpoints of the data using the same calibration and without the clutter of multiple windows. Acknowledgments We gratefully acknowledge the NSF Graduate Research Fellowship Program and Silicon Graphics, Inc. for their support of this research. References [C97]
CNMAT Additive Synthesis Tools. http://cnmat.CNMAT.Berkeley.EDU/CAST
[C98]
A. Chaudhary. “OpenSoundEdit: An Interactive Visualization and Editing Framework for Timbral Resources.” Masters Degree Report, University of California at Berkeley, 1998. http://bmrc.berkeley.edu/papers.
[CFR98]
A. Chaudhary, A. Freed, L.A. Rowe. “OpenSoundEdit: An Interactive Visualization and Editing Framework for Timbral Resources.” 1998 International Computer Music Conference, Ann Arbor, MI, 1998.
[F97]
http://cnmat.CNMAT.Berkeley.EDU/Research/Resonances/
[PBB86]
Y. Potard , P-F. Baisnée, J-B. Barrière. “Experimenting with Models of Resonance Produced by a New Technique for the Analysis of Impulsive Sounds.” Proceedings of 1986 International Computer Music Conference , La Haye, 1986.
[W97]
B. B. Welch. Practical Programming in Tcl & Tk, 2nd Edition. Prentice Hall, Upper Saddle River, NJ, 1997.
[WF97]
M. Wright, A. Freed. “OpenSound Control: A New Protocol for Communicating with Sound Synthesizers.” Proceedings of the 23rd International Computer Music Conference , Thessoloniki, Greece, 1997. http://www.cnmat.berkeley.edu/Research
[W98]
M. Wright et al. “New Applications of the Sound Description Interchange Format.” 1998 International Computer Music Conference, Ann Arbor, MI.
4