A 3D Visualisation to Enhance Cognition in Software Product Line Engineering Ciarán Cawley1, Goetz Botterweck1, Patrick Healy1, Saad Bin Abid1, and Steffen Thiel2 1
Lero, University of Limerick, Limerick, Ireland {ciaran.cawley,goetz.botterweck,patrick.healy, saad.binabid}@lero.ie http://www.lero.ie 2 Furtwangen University of Applied Sciences, Furtwangen, Germany
[email protected] http://www.hs-furtwangen.de/
Abstract. Software Product Line (SPL) Engineering is a development paradigm where core artefacts are developed and subsequently configured into different software products dependent on a particular customer's requirements. In industrial product lines, the scale of the configuration (variability management) can become extremely complex and very difficult to manage. Visualisation is widely used in software engineering and has proven useful to amplify cognition in data intensive applications. Adopting this approach within software product line engineering can help stakeholders in supporting essential work tasks by enhancing their understanding of large and complex product lines. In this paper we present our research into the application of visualisation techniques and cognitive theory to address SPL complexity and to enhance cognition in support of the SPL engineering processes. Specifically we present a 3D visualisation approach to enhance stakeholder cognition and thus support variability management and decision making during feature configuration.
1 Introduction Software product line engineering has rapidly emerged as an important software development paradigm during the last few years. SPL engineering promises benefits such as “order-of-magnitude improvements in time to market, cost, productivity, quality, and other business drivers” [1]. The primary principle underpinning SPL engineering is the development of core assets through a domain engineering process and the subsequent configuration of those assets through an application engineering phase. These core assets comprise the product line and contain variation points that support their configuration. Configuration of variation points allows the same asset to implement different requirements / features within different final software products. This configuration stage is a core part of application engineering. Many of the expected benefits rely on the assumption that the additional up front effort in domain engineering, which is necessary to establish the product line, provides G. Bebis et al. (Eds.): ISVC 2009, Part II, LNCS 5876, pp. 857–868, 2009. © Springer-Verlag Berlin Heidelberg 2009
858
C. Cawley et al.
a long term benefit as deriving products from a product line during application engineering is (expected to be) more efficient than traditional single system development. However, to benefit from these productivity gains we have to ensure that application engineering processes are performed as efficiently as possible. This has proven extremely challenging [2, 3] with industrial sized product lines containing thousands of variation points each of which can be involved in many dependent relationships with various other parts of the product line. One way of addressing this is to support the SPL engineering activities by providing interactive tools that use, at their core, visualisation theory and techniques that are suited for comprehension of large data sets and inter-relationships. Adopting visualisation techniques in software product line engineering can aid stakeholders by supporting essential work tasks and in enhancing their understanding of large and complex product lines. This paper introduces software product lines and presents our visualisation approach to enhance stakeholder cognition of the large and complex data sets that require understanding and management during the application engineering phase of the SPL process. We build on our previous work [4, 5] which elaborated on our initial ideas and we focus here on exemplifying, describing and discussing a working implementation. The rest of this paper is structured as follows. In Section 2 we introduce Software Product Lines and discuss the inherent data complexity challenges. In section 3 we discuss related work. In Section 4 we present our visualisation approach from a conceptual viewpoint. In Section 5 and 6 we provide a concrete implementation of the visualisation approach and discuss its benefits and limitations. The paper finishes with an overview of future work and conclusions.
2 Software Product Lines 2.1 The Process and Challenges Two areas within software product line engineering that can cause particular difficulties for practitioners are the management of variability and the process of product derivation. Variability refers to the ability of a software product line development artefact/asset to be configured, customized, extended, or changed for use in a specific context [6]. It thus provides the required flexibility for product differentiation and diversification within the product line. Product derivation is the process whereby the product line variability is manipulated and managed in order to produce a single final software product (variant). Empirical work by Deelstra et al. [2] was expanded on by Hotz et al. [3] and two fundamental issues at the root of most other problems were identified: The complexity of the product line in terms of variation points, variants and dependencies; The large number of implicit properties or dependencies associated with variation points and variants. These tend to be undocumented or only known to experts.
A 3D Visualisation to Enhance Cognition in Software Product Line Engineering
859
Part of our ongoing work targets variability management directly by providing a considered visualisation approach based on a meta-model that describes the software product line in a supportive way. 2.2 Modelling and Visualisation Approaches Describing a software product line in terms of a feature model [7] is a prevalent mechanism employed to address variability management. A feature describes a capability of the product line from a stakeholder’s point of view and is represented as a node with relationships between features as links (or edges). For example, a Seatbelt Reminder feature of a car restraint system requires the Seatbelt Detection Sensor feature. A feature diagram is typically represented as a tree where primitive features are leaves and compound features are interior nodes. The meta-model that we have developed and use as the basis for our visualisation approach consists of three separate but integrated meta-models. These describe features, decisions (which provide a high-level abstracted view on features and are essentially a combination of features that satisfy a particular need), and components (e.g. java classes) which implement features. The details of this meta-model are out of scope for this paper and the interested reader is guided to a previous publication [8] for further information.
3 Related Work A traditional approach to visualising feature models is to render features as nodes in a node-link diagram and to represent their relationships with each other through edges linking those nodes. Where multiple models are involved with additional relationships existing between those models, the same approach can be taken making the graphs grow ever more complex. Tools such as pure::variants [9] and Gears [10] primarily use items such as lists and hierarchical tree views. These, though familiar, lack evidence of their effectiveness with large scale product lines. The approach presented here addresses the issues from a non-traditional, relationship-centric perspective. The DOPLER [11] tool, although again employing lists and hierarchical trees, allows for more sophisticated graph layouts to be visualised. These, however, follow the node-link diagram approaches mentioned above. 3D software visualisation tools such as VISMOOS [12] and MUDRIK [13] provide interesting use of 3D approaches to supporting cognition, however, they do not support SPL engineering and focus on comprehension while omitting process support. Work by Robertson et al [14] and Risden [15], where they compare task performance using 3D versus 2D techniques provides interesting evidence that 3D techniques can be effective in certain circumstances.
4 Visualisation Approach There are a number of visualisation techniques that can be applied to the model visualisations described above, however, the approach presented here addresses the issues from a different perspective.
860
C. Cawley et al.
During feature configuration of a large SPL, one of the primary difficulties is understanding and managing the relationships that exist between and within different models. For example, during feature configuration, a stakeholder concerned with adding a specific feature is particularly interested in the effect that selecting that feature has on the rest of the system. Its selection may cause multiple other features to be selected and/or eliminated from the configuration, which again can have consequences for other features. Also, we need to consider the effects on elements in other models e.g. components. Hence, understanding and managing these relationships is key to an efficient configuration process. With this in mind, the approach taken here aims to focus the visualisation on the relationships that exist between model elements and not on the elements themselves and in this way make the relationships the primary visual element. 4.1 Visualising Sets of Relationships As an example case of interrelated SPL models we use a DFC model, which describes a product line in terms of Decisions, Features and Components: A decision model captures a small number of high-level questions and provides an abstract, simplifying view onto features. A feature model describes available configuration options in terms of “prominent or distinctive user visible aspects, qualities, or characteristics” [7]. A component model describes the implementation of features by software or hardware components. These three models are interrelated. For instance, making a decision might cause several features to become selected, which in turn require a number of components to be implemented. Fig. 1 shows a traditional approach [8] to visualising such inter-model and intramodel relationships. Using a tree layout, this example visualises a DFC model that describes automotive REStraint Control Units (RESCU). The product line described by this model contains features of electronic control units (ECUs) for automotive restraint systems such as airbags and seatbelt tensioners The example uses a details on demand approach to visualising the relationships pertaining to a specific element or elements of interest. In the example, the central tree graph represents the feature model, the left tree graph represents the decision model and the right tree graph represents the component model. The nodes in each graph represent the elements of the particular model, the straight edges represent parent/child relationships and the curved edges represent other inter-model and intra-model relationships such as implements (e.g. feature implements decision), excludes (e.g. feature excludes feature) and requires (e.g. feature requires feature). 4.2 Visualising a DFC Model Using 3 Dimensions Taking an example from Fig. 1, we can see (marked using ovals) that the BladderMat feature (partly) implements the Hardware B decision and also that it itself is (partly) implemented by the BladderMatSDriver component. Whereas, these model elements
A 3D Visualisation to Enhance Cognition in Software Product Line Engineering
861
Fig. 1. A DFC Model Tree View Visualisation
and the two relationships that exist between them comprise just a subset of the relationships that the BladderMat feature is involved in, we confine our discussion in this sub section to these in order to provide an initial understanding of our approach. Sections 5 and 6 will elaborate more concerning the details.
862
C. Cawley et al.
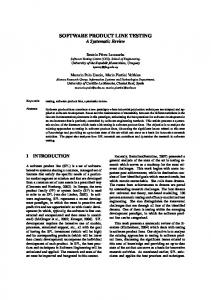
Fig. 2. Visualising Inter-Model Relationships
Fig. 2 presents a three-dimensional space which provides the container for our DFC model visualisation. It primarily consists of three graph axes. The decision model is mapped to the Y-axis, the feature model to the X-axis and the component model to the Z-axis. The mapping is currently a simple sequential listing of the model elements along an axis. For illustration purposes we show the example that we have just identified above. The Hardware B decision is highlighted on the Y-axis, the BladderMat feature on the X-axis and the BladderMatSDriver component on the Zaxis. The blue sphere rendered within the coordinate space is the point where these three separate model elements “intersect”. A sphere rendered at that specific point indicates that those three model elements are associated with each other. Hence, one visual element (the sphere) represents the three model elements and the inter-model relationships that exist between them (feature implements decision and component implements feature). It is therefore also referred to as a relation set identifier. By using a colour encoding scheme, additional relationships can be identified. One such use is colouring the relation set (sphere) with green to indicate that the feature involved in this relation set is a required feature due to the selection of another feature - all relation set identifiers involve a feature. This exemplifies the encoding of an intra-model relationship. This three dimensional space provides the environment that can allow a stakeholder visualise, interact with and analyse the relationships that exist between and within the three models.
A 3D Visualisation to Enhance Cognition in Software Product Line Engineering
863
This visualisation is concerned with representing three appropriate models at any given time but is not intended to be limited to only three models. Although we intend to extend our approach towards support for additional models, in this paper we focus on visualising our three integrated DFC models. The next section describes our implementation and provides further illustration. We use a specific scenario to highlight the main visualisation and its interactivity. Subsequently in Section 6 we discuss the reasoning and argue benefits and limitations.
5 Implementation Throughout our description of the implementation we will use our example “RESCU” DFC model introduced in Section 4.1. The model consists of eighteen requirement decisions each of which is implemented through one or more features each of which in turn is implemented through one or more components.
Fig. 3. A 3D Visualisation as an Eclipse Plugin
Fig. 3 presents a screenshot of the visualisation. The implementation consists of an Eclipse plug-in [16] which, when installed within the Eclipse IDE, provides a set of views aimed at supporting SPL feature configurations. The centre view provides the 3D implementation under discussion. The decision tree view to its left and the textual view to its right are synchronised supporting views but are not required by it.
864
C. Cawley et al.
5.1 User Interface The main interface comprises a three-dimensional co-ordinate space. Decisions are listed vertically along the Y-axis, features along the X-axis and components along the Z-axis. As described in Section 4, the relation sets (spheres) rendered within the coordinate space identify where sets of relationships exist between the three models (axes). 5.1.1 Basic Interactivity As the mouse is moved over the labels along each axis, labels are magnified to provide readability and to identify features, decisions or components. If a label is clicked on a particular axis and a set of relationships exist that relates that model element to the other two models, then a relation set will be displayed at the corresponding 3D co-ordinate. Also, the corresponding labels on other axes (identifying associated model elements) will be highlighted. By moving the mouse over a relation set, the labels of the three model elements involved in that relation set are further magnified to distinguish them and aid legibility (also see Fig. 2) The visualisation as a whole can be flexibly manipulated by the stakeholder. It can be rotated in any direction by 360 degrees; it can be panned horizontally and vertically and can be zoomed towards and away from the user. This supports navigation of the visualisation and allows preferred viewing dependent on the particular information of interest. 5.1.2 Visualising Additional Relationships Up to this point, we have mainly described how the visualisation represents the relationships that exist between elements in different models. However, one of the main purposes of this visualisation is to additionally identify relationships that exist between different elements of the same model. A relation set that does not represent any additional relationships other than intermodel ones is coloured blue. In that case, the relation set shows that a particular decision, feature and component are related to each other through two implements relationships. Let us now consider that the feature identified in that set of two relationships requires another feature. By default, all relation sets within the co-ordinate space that involve that required feature among its relationships will be displayed and coloured green. The green visually indicates that the feature represented within its relation set is a required feature (given the users current selection). Similarly, a red relation set indicates that the feature represented within its relation set has an excludes relationship with another feature related to the user’s current selection. 5.2 Transitive Relationship Complexity Consider that a user has selected a decision and that the visualisation has rendered all relation sets where that decision is involved (e.g. if only one feature implemented the decision and that feature was implemented by only one component then only one relation set would exist that directly involved that decision). If that one feature either required or excluded another feature then as described in the previous subsection, the visualisation, by default, will also render any relation sets that the required/excluded
A 3D Visualisation to Enhance Cognition in Software Product Line Engineering
865
feature was involved with. These transitive relationships introduce additional complexity on a number of levels, namely features excluding or requiring other features, decisions requiring other decisions and components requiring other components. To manage this complexity the stakeholder has access to a number of filtering options (see Fig. 3). A detailed explanation of these filters is out of scope here; suffice it to say that the stakeholder can choose to manage different aspects of the complexity incrementally. Additionally, any filtered information can be brought more or less into view dynamically by the user using the slider at the top right allowing a context to remain while filtering out less relevant information. 5.3 Example Scenario Using Fig. 3 as an example we can highlight some of the attributes of the visualisation. In this example the stakeholder has, by moving the mouse over its label on the Y-axis and clicking on it, selected the decision “High End Occupant Protection?”. The stakeholder has also selected the “Primary” setting for the “Show Linked Features” filter which is part of the “Filter Decision Selections” filter panel. This filter pattern will filter out any transitive relation sets to an extent specified by the filter slider setting which increases/decreases their transparency. The selection of the “High End Occupant Protection” requirement decision results in 26 encoded relationships involving 24 distinct model elements across 3 separate models, visualised using 10 colour encoded spheres (relation set identifiers). Three blue and five green relation sets immediately indicate three implementing and five required features respectively, in relation to the selected decision. Two transparent relation sets indicate additional transitive relationships exist, one of which is red indicating a mutually exclusive feature. By hovering the mouse over any of the relation sets or clicking a relation set the relevant decision, feature and component are clearly highlighted.
6 Discussion The overarching motivation for this approach stems from the immense complexity that can be present in large scale SPLs. Traditional approaches to managing such complexity can lead to problems such as “mapshock” (a phenomenon where someone perceiving an overly complex diagram has an audible reaction to information overload). The DFC meta-model provides a basis where SPL data can be described in more manageable entities using decisions to provide a high level mapping of features which are implemented by components. This basis provides a useful platform to apply cognitive theory and interactive visualisation techniques to address management of this complexity. 6.1 Cognitive Benefits The approach presented here uses as part of its basis, the theory of augmented thinking using visual queries on visualisations - cognitively, constructing a visual query entails identifying a visual pattern that will be used by a mental search strategy over a graphical visualisation [17]. Below are three of the most salient points of this theory.
866
C. Cawley et al.
1. Data should be presented in such a way that informative patterns are easy to perceive. 2. The cognitive impact of the interface should be minimised so that thinking is about the problem and not the interface. 3. The interface should be optimised for low cost, rapid information seeking. In our approach, the main visual pattern of importance is a colour encoded sphere. The interface itself is, for the most part, a spatial container for those visual patterns where additional information is retrieved on demand. In brief, through these core ideas we attempt to emulate the above key points. Next we discuss some of the specific techniques employed. Focus+Context describes the ability to work at a focussed level while maintaining the overall context within which you work. The 3D container in which the relation sets are rendered provides a mapping of each of the models on its axes and we argue that this provides the perception of the SPL as a whole while working with individual elements and relationships. Distortion techniques (transparency) and filtering allow exploration of relevant data while keeping complexity in the background. These transparent relation sets also act as pull cues to draw the user’s attention to this additional complexity. Details On Demand, Dynamic Queries and animation are techniques implemented through the use of mouse interactions with both the axes labels and relation sets. Colour encoding guided by work such as that carried out by Kerbs [18] aims to provide preferred aesthetics. The 3D nature of the visualisation supports the world-in-hand metaphor (which inherently employs kinetic depth cues and parallax motion) allowing the user to manipulate the visualisation through rotation, panning and zooming for appropriate viewing. 6.2 Benefits to Feature Configuration We argue that by providing a visualisation based on enhancing cognition through the use of visualisation techniques and cognitive theory, a stakeholder can be supported in their task to make configuration decisions while deriving a new variant from a large scale SPL. By supporting the stakeholder in this way we argue that the feature configuration process becomes less complicated and hence less error-prone and more efficient. With this approach, the complexity inherent in a large SPL is broken down into more manageable blocks. However, within the context of the visualisation which perceptually contains all three models as a whole, the stakeholder can work with individual model elements and their relationships while keeping that context. Using this approach, the stakeholder can explore and understand the complex relationships that exist in an incremental fashion, allowing informed judgement of the possibilities and effects of a particular configuration step. For example, using transparency, the user can keep transitive complexity in the background until desired. Importantly, high risk or possibly problematic instances can be easily identified while evaluating decision selections. For example, the appearance of a number of red relation sets would indicate that the current selection warrants further investigation as to the impact of and alternatives to those eliminated features.
A 3D Visualisation to Enhance Cognition in Software Product Line Engineering
867
6.3 Limitations Many of the limitations discussed here are a result of additional implementation that needs to be carried out. This additional work is currently being undertaken and is also discussed in Section 7. The magnification/FishEye implementation on the axes (particularly the z-axis) is presently rudimentary and will be enhanced to increase its effectiveness. Having multiple relation sets representing the same feature could be considered redundant if the user is only interested in the features themselves at a given time. One possibility to address this is to allow removing/combining “redundant” relation sets on-demand where appropriate. A traditional feature model view is not available. Such a tree view layer that can be displayed on demand for a variety of purposes including a partial feature model is planned.
7 Conclusion and Future Work The elicitation of expert opinion is deemed of great importance as part of the next steps to evaluate and guide the future direction of our relationship visualisation approaches. The modelling of a large commercial system based on our meta-model is currently in progress with a planned evaluation to follow. In addition, planned work for the immediate future will be aimed at addressing the main limitations that exist through further implementation. This work will mostly be concerned with providing additional supporting task based information using dynamic queries and details on demand techniques. Also, work to support ease of use and perception is planned. In conclusion, this paper builds on previous work in employing visualisation theory and techniques to address complexity issues in SPL feature configuration. Specifically, it reports on a visualisation implementation based on previously published ideas and discussions. We present and argue that such an implementation can enhance stakeholder cognition during feature configuration providing the basis for a more efficient and less error-prone process. The approach focuses on representing the relationships that exist between and within three separate but integrated models as the primary visual elements in a 3D visualisation. We discuss the benefits and limitations of the approach using an illustrated example.
References 1. SEI: Software Product Lines, http://www.sei.cmu.edu/productlines/ 2. Deelstra, S., Sinnema, M., Bosch, J.: Product Derivation in Software Product Families: A Case Study. Journal of Systems and Software 74, 173–194 (2005) 3. Hotz, L., Wolter, K., Krebs, T., Nijhuis, J., Deelstra, S., Sinnema, M., MacGregor, J.: Configuration in Industrial Product Families - The ConIPF Methodology. IOS Press, Amsterdam (2006)
868
C. Cawley et al.
4. Cawley, C., Thiel, S., Botterweck, G., Nestor, D.: Visualising Inter-Model Relationships in Software Product Lines. In: Proceedings of the 3rd International Workshop on Variability Modeling of Software-Intensive Systems (VAMOS), Seville, Spain (2009) 5. Cawley, C., Thiel, S., Healy, P.: Visualising Variability Relationships in Software Product Lines. In: 2nd International Workshop on Visualisation in Software Product Line Engineering (ViSPLE), Limerick, Ireland (2008) 6. Van Gurp, J., Bosch, J., Svahnberg, M.: On the notion of variability in software product lines. In: WICSA Proceedings, pp. 45–54. IEEE Computer Society, Los Alamitos (2001) 7. Kang, K., Cohen, S., Hess, J., Novak, W., Peterson, S.: Feature-oriented domain analysis (FODA) feasibility study. Technical Report CMU/SEI-90-TR-21. Software Engineering Institute, Carnegie Mellon University (1990) 8. Botterweck, G., Thiel, S., Nestor, D., Abid, S.B., Cawley, C.: Visual Tool Support for Configuring and Understanding Software Product Lines. In: The 12th International Software Product Line Conference (SPLC 2008), Limerick, Ireland (2008) 9. Pure-systems GmbH: Variant Management with pure:variants (2003-2004), http://www.pure-systems.com 10. Biglever Software: Gears, http://www.biglever.com 11. Rabiser, R., Dhungana, D., Grünbacher, P.: Tool Support for Product Derivation in LargeScale Product Lines: A Wizard-based Approach. In: 1st International Workshop on Visualisation in Software Product Line Engineering (ViSPLE 2007), Tokyo, Japan (2007) 12. Rohr, O.: VisMOOS (Visualization Methods for Object Oriented Software Systems). University of Dortmund (2004), http://ls10-www.cs.uni-dortmund.de/vise3d/prototypes.html 13. Ali, J.: Cognitive support through visualization and focus specification for understanding large class libraries. Journal of Visual Language and Computing (2008) 14. Robertson, G., Cameron, K., Czerwinski, M., Robbins, D.: Polyarchy Visualization: Visualizing Multiple Intersecting Hierarchies. In: Conference on Human Factors in Computing Systems. ACM, Minneapolis (2002) 15. Risden, K., Czerwinski, M.P., Munzner, T., Cook, D.B.: An initial examination of ease of use for 2D and 3D information visualizations of web content. Int. J. Human-Computer Studies, 695–714 (2000) 16. Eclipse IDE, http://www.eclipse.org 17. Ware, C.: Information Visualisation: Perception for Design. Kaufmann Series in Interactive Technology. Morgan Kaufmann, pp. 370–383. Morgan Kaufmann, San Francisco (2004) 18. Kerbs, R.W.: An Empirical Comparison of User Color Preferences in Electronic Interface Design. In: 19th International Symposium on Human Factors in Telecommunication Berlin, Berlin, Germany (2003)