The Third International Conference on Software Engineering Advances
A Benchmark for Embedded Software Processes used by Special-purpose Machine Manufacturers Valentin Plenk University of Applied Sciences Hof Alfons Goppel Platz 1, 95028 Hof, Germany
[email protected]
Abstract
special-purpose machines. In the course of these interviews two major problems were identified as the big challenges, that should be addressed by software engineering processes: scheduling and reuse in spite of the differences. Furthermore it became evident, that although all interviewees were ready to admit that their processes might be improved, no dominant (and new) problem could be found. Surely only a subset of the software engineering processes in literature addresses the field of special-purpose machine engineering and its major problems – e.g: [2, 7, 8, 9, 10, 12, 13] – but there seems to be enough knowledge that is only waiting to be applied. The common statement was: “My processes are not perfect, but they work for me. Can you promise that the adoption of a specific method will yield quantifiable benefits for my company?” There is obviously no simple and general answer to that question. [11] for example addresses this question in the context of fairly big organizations. This paper has a similiar focus: it proposes two benchmark criteria to measure a company’s process quality with respect to reuse and scheduling. These measurements can be the base of a decision to change the processes. They can also be used as a “corporate memory” to estimate the size of future projects. First of all the following text gives an overview of the two major problems, scheduling and reuse in spite of the differences. Then two benchmark criteria for reuse and scheduling are defined. Lastly the significance of the criteria is shown by way of actual industry projects.
A series of interviews conducted with companies in the field identified two hot spots in special-purpose machine software processes: scheduling and reuse. Two benchmark criteria are proposed to measure the quality of the processes with respect to reuse and scheduling in a specific company with respect to other companies. The significance of the criteria is shown by way of actual industry projects. An application is proposed where the criteria can be used to estimate efforts and schedules.
1. Introduction The necessity of software engineering is obvious and undisputed in academia. There are many books describing process models for software design and implementation – e.g: [1, 3, 4, 5]. Personal experience and some critical papers [6, 11] indicate that in practice these ideas are not fully adopted. This lack appears to be especially expressed in the field of special-purpose machine engineering. (This field happens to be the author’s focus of interest, the lack might be bigger or smaller in other fields.) Companies in the field of special-purpose machine engineering have to address a multidisciplinary problem: special-purpose machines consist of mechanics, electronics and (embedded) software. All three constituents have to be designed and manufactured/implemented and integrated – if possible in parallel. This problem is exacerbated by challenging schedules and the uniqueness of each individual machine. Any single machine is quite different from any other machine. These companies usually deliver lots ranging from 1 to 5 machines. A number of small to medium sized manufacturers were interviewed to survey the practices employed in designing, implementing and managing the embedded software in
978-0-7695-3372-8/08 $25.00 © 2008 IEEE DOI 10.1109/ICSEA.2008.10
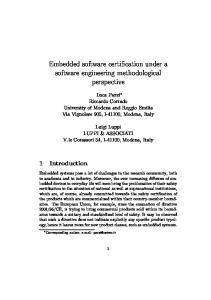
2. Typical Project schedule Figure 1 displays the typical schedule for a project to create a special-purpose machine. The three main tasks of mechanical, electrical and software design each depend on the others’ result and thus must be scheduled in sequence. With careful coordination they
166
ngsname
'08 D S order
21. Apr '08 M M F
S
28. Apr '08 D D
S
05. Mai '08 M M F
S
12. Mai '08 D D
S
19. Mai '08 M M F
S
26. Mai '08 D D
S
02. Jun '08 M M F
S
09. Jun '08 D D
S
16. M
nical design
mechanical design
cal design
electrical design
re design
software design
buffer
re implementation
software implementation
acturing (mechanics)
manufacturing (mechanics)
acturing (switching cabinet)
manufacturing (switching cabinet)
bly
assembly
ssioning (and testing)
commissioning (and testing) acceptance
ance
vgvshj,gdscgdjkcg gcew
with hvgvshj,gdscgdjkc
Figure 1. Typical schedule for design and manufacturing of a special purpose machine
can be run partially in parallel as shown in the figure. The critical path consists of the project’s “mechanical” parts from mechanical design over manufacturing to assembly. The software can be implemented in parallel to manufacturing and assembly of the mechanical components. This Seite 1 results in a big time buffer for the software – this task is apparently not critical. In practice this buffer is not helpful because the schedule problems do not stem from exceeding or not using the buffer (due to a late start of the software implementation task) but rather from problems discovered during setup and testing of the system. These problems can reside as well in the mechanical or electrical part of the system as in the software.
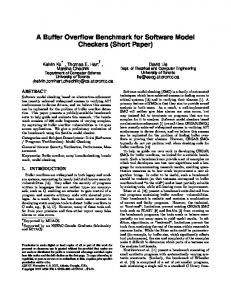
Figure 2. Typical bill of materials for a special-purpose machine
to a project into mechanical design Wmech , electrical design and software WControl and manufacturing and assembly WAssembly .
4.1. The “Project Map” By adding up all data over the project duration the total size of a project results in
3. Typical Reuse Practice
WT otal = Wmech + WControl + WAssembly
Figure 2 shows an example of a bill of materials that illustrates the different approach towards reuse in mechanical, electrical and software design: Whilst the mechanics are mostly organized in reusable sub assemblies (the example uses sub assembly 4712 twice with different tooling), neither the electrical design nor the software in this bill of materials are structured in a reusable way. Parts of the electrical design like the proximity switches 47122 and 47123 are occasionally covered by the mechanical bill of materials. The switching cabinet, where all electrical threads meet, however is not divided in reusable sub assemblies nor is the software.
(1)
By relating the individual parts to the total project size WM
=
WCo
=
WA
=
Wmech · 100% WT otal WControl · 100% WT otal WAssembly · 100% WT otal
(2) (3) (4)
all projects must reside on the plane 100% = WM + WCo + WA
(5)
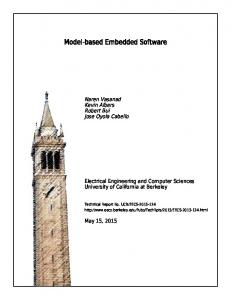
shown in figure 3 a). The individual parts move on this plane according to their quota. Assuming for instance a quota of WA = 50% for manufacturing and assembly, the quotas for WM and WCo can only move on the straight line WM = 50%−WCo (dotted line in figure 3 b). So the top view in figure 3 b) shows the breakup of the design work into mechanical and electrical and software design.
4. Benchmarks To address the questions of reuse and project scheduling in an impartial way and to circumvent the complexity and diversity of the different special-purpose machine projects, the companies were asked to provide cost accounting data for the projects that differentiate the working hours charged
167
40,00%!
begin of commissioning!
Effort!
100 90
30,00%!
100 90 80
18,1%!
70
80
60 50
panic quotient: 0,9!
W_A
W_Co! W_M! W_A!
40 30 20
70
10 0 0 20
W_M
40
60
60 W_Co
80 100
0
10
20
30
40
50
60
70
80
90
100
20,00%!
W_M
a) 3D view
50 40
10,00%!
19,4%!
30 20 0,00%! 0,00%!
10 0
0
10
20
30
40
50 60 W_Co b) Top view
70
80
90
20,00%!
40,00%!
60,00%!
80,00%!
100,00%! Time!
100
Figure 4. Cumulated efforts for a project with QP = 0.9
Figure 3. The project plane according to equation 5 is on the critical path anyway (but well before commissioning) and b) problems that are discovered late in a project have to be solved or bypassed by software due to shorter lead times. The ratio between effort before and after beginning of commissioning can be expressed as a “panic quotient”:
All the projects must lie inside the triangle 0% ≤
WM
0% ≤
WA
0% ≤ WCo
≤ 100%
(6)
≤ 100%
(8)
≤ 100%
(7)
QP =
because outside this area one of the quotas would be negative. Projects that are able to reuse all of the design work, i.e: WCo = WM = 0%, lie in the origin of figure 3 b). The complete effort is used for manufacturing and assembly, i.e: WA = 100%. This applies to (standard) machines built in big production-runs. Projects with a mechanical design effort that corresponds to the electrical design effort lie on the straight line WM = WCo . With respect to the quota used for manufacturing and assembly they lie closer to the origin (WA → 100%) or almost at the upper bounding line (WA → 0%). Projects with a dominant mechanical quota will lie above the straight line, projects with a dominant WCo below. Projects with similarities allow to build up experience, that should result in reusable mechanical or control modules. This (increasing) reuse causes the points to move towards the origin.
WCoaf ter WCobef ore
(9)
In projects with a small quotient in the range 0 ≤ QP ≤≈ 0.5 the major part of software and electronics design and implementation was done before commissioning. Only a small part of the effort had to be completed during the final phase on the critical path. This is interpreted as good planning and it can be assumed that the work was performed in an orderly manner. Quotients in the range ≈ 0.8 ≤ QP ≤ ∞ appear more critical. Higher quotients mean that bigger and bigger parts of the work have to be completed during the final phase on the critical path. This is interpreted as poor planning (apparently the buffer before commissioning was not used) and it is expected that the work was performed under considerable pressure - i.e: in “panic”. When interpreting big quotients one must however keep in mind, that for small efforts, especially in the case of well designed reuse, the denominator WCobef ore will be (very) small and therefore the quotient will be big, even though the project was well run.
4.2. The “panic quotient”
4.3. Data Evaluation
The data can also be evaluated as a time series. According to a typical schedule as shown in figure 1, the major part of the design work should be finished (well) before beginning of commissioning. Figure 4 shows an example of a project where the software implementation becomes part of the critical path. According to experience this situation strikes the software group, because a) the mechanical design
Three companies have provided data for a total of 20 projects. Figure 5 shows the position of the projects in the plane according to figure 3. The projects shown as circles were run in a company that has accomplished a complete reuse of the control design
168
40
0.57
35 30
1.2 0
1.1
0.68 0.2
0.93 0.44
0
0.13
25 W_M
The big number 1.4 belongs to a project with high reuse. One would therefore expect that the effort after commissioning is (considerably) less than the effort before commissioning. A closer look at figure 7 d) shows, that the effort before commissioning is so small, that the small but unavoidable routine effort after commissioning (e.g: teaching a robot) results in big quotients. The panic quotients for the “asterisk” projects are in the range from 0 to 1.2. A closer look at the two outliers reveals that the project at (13.4%, 7.4%) shows effort curves similiar to figure 7 d). Figure 6 shows that the project at (31.5%, 27.4%) has two clear phases of effort as introduced in figure 4. If the start of the second phase is interpreted as the actual beginning of software setup and testing, the panic quotient for this project results in 1.4 (as opposed to the 0.44 calculated from the date for commissioning provided by the company).
0
0.6 0.46
0.38
1.4
20 15
0
10
0.44
0.93
5 00
0
0
5
10
15
20 W_Co
25
30
35
40
Figure 5. Project Map with Panic Quotients
50,00%!
W_Co!
Effort!
from project to project although the mechanics have to be changed (quite substantially in some projects). The projects shown as crosses were run in a company that builds very diverse machines and is therefore not able to achieve a comparable level of reuse. One set of data in the “cross” series describes four more or less identical machines that were produced in four different projects. The data points are connected by dotted arrows indicating the temporal sequence of the projects. The first point shows that the mechanical design took about two times the effort of the electrical design and the software. In the second point the relationship is approximately the opposite: the electrical design and the software needed two times more effort than the mechanical design. This indicates that the electrical design and the software could not be reused as much as the mechanical design. The following points show less and less effort and thus more and more reuse of the design. Figure 7 shows the cumulated efforts in the four more or less identical projects. These curves confirm the increasing reuse because the assembly effort takes an increasing part of the total effort. The projects shown as asterisks were run in a company, that builds diverse machines, that are less complex from control software’s point of view. This is reflected in the distribution pattern: all but two projects lie in an area where the mechanical design effort is bigger than the electrical design and the software effort. The panic quotients for the “circle” projects are in the range from 0 to 1.1 (the raw data for this calculation are not included in this paper). The panic quotients for the “cross” projects are in the range from 0.44 to 1.4. The four related projects show the values 0.57, 0.46, 1.4 and 0.44.
W_M! W_A!
40,00%!
30,00%!
company's date: before: 21,0 %, after: 10,6% Panic quotient: 0,4
20,00%!
10,00%!
0,00%! 0,00%!
expected date: before: ~ 13,0 %, after ~18,5% Panic quotient: 1,4
20,00%!
40,00%!
60,00%!
80,00%!
100,00%!
Time!
Figure 6. Project with two clear phases of effort in WCo
4.4. Applications The project map helps grouping similar projects and identifying outliers. This can be used inside one company to identify projects/groups of projects with similar characteristics or to observe changes in the map over time. E.g: the series of the four similar “crosses” in figure 5 indicates a difference in learning between mechanical and electrical/software design, that might need a closer look. The project map can also be used as a basis for comparisons between companies. Although some care must be taken not to compare apples and oranges – e.g: softwarewise simple machines to machines with complex operating sequences – it appears acceptable to take one company’s set of projects and compare it to another company’s set of projects. The “asterisks” and the “circles” in figure 5 for example show quite different characteristics with respect to software reuse. If the machines are comparable, the dif-
169
ference can show the necessity to improve the company’s processes. Another application uses the project map of one company’s projects as an estimation tool. Machine manufacturers and their customers generally specify the mechanical properties and the overall mechanical functionality of a machine before the order is placed. The electronic/software part of the machine is usually not explicitly specified – neither before the order nor during the project. Based on the mechanical estimates made in the offer phase the electronic/software estimates can be derived from the projects’ average location in the project map. In this context the panic quotient can be used to find a realistic project schedule by extrapolating the test (and redesign) efforts after commissioning.
[7] S. Kubica. Variantenmanagement modellbasierter Funktionssoftware mit Software-Produktlinien, volume 40 of Arbeitsberichte des Institus f¨ur Informatik. Institut f¨ur Informatik, Universit¨at Erlangen-N¨urnberg, Martensstr. 3, 91058 Erlangen, Juli 2007. [8] S. M¨ohringer. Entwicklungsmethodik f¨ur mechatronische Systeme. Number 156 in HNI-Verlagsschriften Rechnerintegrierte Produktion. Heinz Nixdorf Institut, Universit¨at Paderborn, 2004. [9] J. Roßmann, O. Stern, and R. Wischnewski. Eine Systematik mit einem darauf abgestimmten Softwarewerkzeug zur durchg¨angigen Virtuellen Inbetriebnahme von Fertigungsanlagen. VDI-Berichte, (1980):707 – 716, 2007. [10] B. D. Valnion. Neues Paradigma f¨ur das Design von Automatisierungssystemen. CADplus Business+Engineering, (5/6):54–57, 2005. [11] R. van Solingen. Measuring the roi of software process improvement. IEEE Software, pages 32 –38, April/May 2004. [12] H. Weber. Rapid Control Prototyping: Steuerungen f¨ur den Sondermaschinenbau. Etz, 127(S5):50, 59–67, 2006. [13] D. Witsch, A. Wannagat, and B. Vogel-Heuser. Entwurf wiederverwendbarer Steuerungssoftware mit Objektorinetierung und UML. Automatisierungstechnische Praxis (atp), 50(5):54 – 60, 2008.
5. Summary The two benchmark criteria defined above show a good potential for measuring reuse and scheduling. The benchmarks were used to identify and specifically discuss outliers in a second set of interviews. This revealed that the raw cost accounting data may be slightly skewed if a person (and the respective working hours) cannot clearly be attributed to one of the three parts. The panic quotient is especially sensitive to the quality of input data. Apart from establishing the importance of good input data, the interviews have also shown that the benchmarks really help to find outliers and to discuss, whether there is something to be learnt from these projects. The evaluated data can also be used as a basis to estimate the size of new projects. The project map helps estimating the efforts for electrical design from the expected efforts for mechanical design. The panic quotient can be used to estimate the test (and redesign) efforts after commissioning.
References [1] K. Beck and C. Andres. Extreme programming explained: embrace change. Addison-Wesley, Boston, MA, 2nd edition, 2005. [2] T. Blochwitz and S. Altmann. Entwurf von SPSSteuerungen am virtuellen Maschinenprototyp. Automatisierungstechnische Praxis (atp), 50(1):16 – 20, 2008. [3] F. P. Brooks Jr. The mythical Man-Month. Addison Wesley, 20th anniversary edition, 1995. [4] T. DeMarco. The Deadline – a novel about project management. Dorset House Publishing, New York, 1997. [5] E. Denert. Software Engineering – Methodische Projektabwicklung. Springer, Berlin, 1992. [6] B. Graaf, M. Lormans, and H. Toetenel. Embedded software engineering: the state of the practice. IEEE Software, 20(6):61 – 69, 2003.
170
begin of commissioning!
W_Co! W_M! W_A!
W_Co! W_M! W_A!
begin of commissioning!
40,00%! Effort!
Effort!
40,00%!
30,00%!
30,00%!
panic quotient: 0,5!
10,5%!
20,00%!
10,00%!
20,00%!
panic quotient: 0,6!
7,8%!
23,0%!
10,00%!
13,7%!
0,00%! 0,00%!
20,00%!
40,00%!
60,00%!
80,00%!
0,00%! 0,00%!
100,00%! Time!
20,00%!
a) first project
60,00%!
80,00%!
100,00%! Time!
b) second project W_Co! W_M! W_A!
begin of commissioning!
W_Co!
80,00%!
W_M!
begin of commissioning!
Effort!
Effort!
50,00%!
40,00%!
40,00%!
W_A!
60,00%!
30,00%! 40,00%!
20,00%!
2,4%! 5,3%!
10,0%! 0,00%! 0,00%!
20,00%!
40,00%!
60,00%!
80,00%!
0,00%! 0,00%!
100,00%! Time!
c) third project
20,00%!
40,00%!
60,00%!
80,00%!
100,00%! Time!
d) fourth project
Figure 7. Cumulated efforts over time for the four more or less identical machines
171
panic quotient: 0,4!
14,3%! 10,00%!
panic quotient: 1,4!
20,00%!