invasive recording of cortical hemoglobin oxygenation in human subjects ... proposes a novel BCI for detecting changes resulting from increases ... We measured hemoglobin responses .... computed by dividing each time sample by the mean of the optical .... (Best2AvgLRch), using MIBIF to select 4 out of 32 channels of HB,.
2010 International Conference on Pattern Recognition
A brain-computer interface for mental arithmetic task from single-trial nearinfrared spectroscopy brain signals Kai Keng Ang, Cuntai Guan Institute for Infocomm Research, A*STAR, Singapore {kkang, ctguan}@ i2r.a-star.edu.sg
Kerry Lee, Jie Qi Lee Centre for Research in Pedagogy and Practice, National Institute of Education, Singapore {kerry.lee, jieqi.lee}@ nie.edu.sg
Abstract Near-infrared spectroscopy (NIRS) enables noninvasive recording of cortical hemoglobin oxygenation in human subjects through the intact skull using light in the near-infrared range to determine. Recently, NIRS-based brain-computer interfaces are introduced for discriminating left and right-hand motor imagery. A neuroimaging study has also revealed event-related hemodynamic responses associated with the performance of mental arithmetic tasks. This paper proposes a novel BCI for detecting changes resulting from increases in the magnitude of operands used in a mental arithmetic task, using data from single-trial NIRS brain signals. We measured hemoglobin responses from 20 healthy subjects as they solved mental arithmetic problems with three difficulty levels. Accuracy in recognizing one difficulty level from another is then presented using 5×5-fold crossvalidations on the data collected. The results yielded an overall average accuracy of 71.2%, thus demonstrating potential in the proposed NIRS-based BCI in recognizing difficulty of problems encountered by mental arithmetic problem solvers.
1. Introduction Brain-Computer Interface (BCI) is a communication system that directly translates brain signals into commands for controlling an external device [1]. Methods for measuring brain signals include electroencephalography (EEG), functional magnetic resonance imaging (fMRI), magnetoencephalography (MEG), positron emission tomography (PET), and 1051-4651/10 $26.00 © 2010 IEEE DOI 10.1109/ICPR.2010.917
Shoko Nioka, Britton Chance Department of Biochemistry and Biophysics, University of Pennsylvania, PA, USA {nioka, chance}@ mail.med.upenn.edu
more invasive methods such as electrocorticogram (ECoG) and implanted electrodes [1]. Recently, the feasibility of using near infrared spectroscopy (NIRS) in the development of BCIs for left and right-hand motor imagery has been demonstrated [2], [3]. Although various methods exists, only EEG and NIRS are suitable for widespread everyday use since MEG, fMRI and PET are technically complex, expensive and have limited real-time capabilities [4]. NIRS is a non-invasive optical neural imaging technique that measures concentration changes of oxyhemoglobin (HbO2) and deoxyhemoglobin (Hb) in the cerebral vessels by means of different absorption spectra in the near infrared range [5]. The suitability of recognizing left and right motor imagery from hemodynamic responses for developing BCI was first demonstrated in [6], and later in [2], [3]. However, studies have shown that other cognitive tasks, such as mental arithmetic, generally cause an increase of HbO2 associated with decreases of Hb in the prefrontal cortex [7]. There are recent seminar papers that investigated hemodynamic response using NIRS on mental arithmetic tasks [8], [9], and the recognition of mental workload from NIRS signals [10], [11]. To the best of the authors’ knowledge, there is currently no NIRSbased BCI designed to recognize the problem size in mental arithmetic tasks. The motivation behind the investigation is that the amplitude of an event-related brain potentials has been shown to be modulated by the size of operands in mental arithmetic tasks [12]. This paper proposes a novel BCI for recognizing the size of operands in a mental arithmetic task from single-trial NIRS brain signals, and presents preliminary results from a study on 20 healthy subjects. 3752 3768 3764
2. Methodology
32 channels of concentration changes in deoxyhemoglobin (HB) and oxyhemoglobin (HBO2).
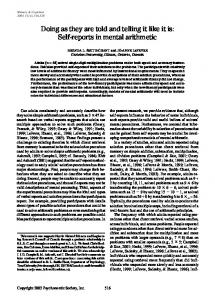
2.1. Data collection protocol The data was collected from 20 healthy, righthanded participants (12 male, 8 female; mean age=24.7 years, range 19–30). All subjects had no neurological injury, completed at least 12 years of education, were fully informed, and consented to participate in the study. The subjects were seated in a comfortable chair in a room with normal lighting and were asked to relax before the experiment commenced. They were also asked to minimize movement and to respond as quickly and correctly as possible during data collection. The recording session for each subject was less than 30 mins. During data collection, the subjects underwent a total of 75 trials of arithmetical tasks that were evenly distributed into 3 difficulty levels: easy, medium, and hard. The subjects performed two single-digit additions (e.g. 5 + 4) for the easy tasks, single-digit and doubledigits additions (e.g. 5 + 34) for the medium tasks, and two double-digits additions (e.g. 53 + 34) for the hard tasks. Arithmetical tasks that involved the carry-over operation are one of the contributing factors of problem size effect. Hence these tasks were excluded. 5 trials of the same difficulty level formed a block and a total of 15 randomized blocks were presented to the subjects. The duration of each trial was 12 s. At the start of each trial, the arithmetic task was presented at the center of a display screen and remained for a maximum of 9 s or until the subject responded. After the subject responded, a fixation cross appeared for the remainder of the 12 s duration. After completing 1 block, a fixation cross would appear for 30 s before the next block began. The data were collected using 16-channel continuous-wave near infrared spectroscopy (see Fig. 1) device to compute hemodynamic changes in the prefrontal cortex while performing the mental arithmetic tasks. The probes comprised 4 triwavelength (730nm 805nm, and 850nm) LEDs and 10 detectors held onto the subject’s forehead using a Velcro band. The 730nm wavelength was used to detect deoxy Hb, 850nm to detect oxy Hb, and 805nm to detect the dark current or fixed-pattern noise. A total of 16 channels was collected for each wavelength using a sampling frequency of 3 Hz. This yielded a total of
8
This section describes how the NIRS brain signal is collected, how the hemodynamic responses are computed, and the methodology for recognizing the operand size from the hemodynamic responses in the proposed NIRS-based BCI.
Fig. 1 Multichannel near infrared optodes arrangement on the prefrontal cortex for the study. A pair of LED and probe yields 1 channel of HB and 1 channel of HBO2 signal. A total of 16 channels of HB and 16 channels of HBO2 signals are thus collected.
2.2. Preprocessing Let the optical density for wavelength λ acquired from a set of source and detector labeled as channel c be denoted as OD λc . First, the optical densities for wavelength λ1=730nm and λ2=850nm are subtracted from wavelength 805nm to remove the fixed-pattern noise. Next, the relative change in optical density is computed by dividing each time sample by the mean of the optical signal acquired for the session [2] given by λ 1 T ∆ODc ( t ) = ODλc ( t ) (1) ∑ ODcλ (τ ) , T τ =1 λ
where ∆ ODc is the normalized change in optical density, and T is the total number of time samples acquired for the session. λ
∆ ODc is then low-pass filtered using Chebychev type II filter with a cut-off frequency of 0.14 Hz and pass-band attenuation of 0.02 dB. Next, lineardetrending is perfomed to remove the drift (low frequency bias) in the NIRS measurements due to various reasons, such as subject movement, blood pressure variation, and instrumental instability [13]. After filtering and detrending, unity is added to bring the mean of the optical density to unity instead of zero. The change in optical density ∆OD λc is then computed as the negative logarithm from the resultant given by � λc , ∆ODλ = − log ∆OD (2) c
(
)
λ
� c denotes the filtered, linearly-detrended where ∆ OD optical density with unity added.
2.3. Computing hemodynamic responses In NIRS studies, optical density changes ∆ODc can be expressed as a linear combination of the changes in oxyhemoglobin ∆[HbO2]c and deoxyhemoglobin ∆[Hb]c. This equation, referred to as the modified Beer-Lambert law (MBLL) [5], [14], is given by λ λ ∆ODλc = Lλ DPFλ ε Hb ∆ [ Hb ]c +ε HbO ∆ [ HbO 2 ]c , (3) 2
(
3765 3769 3753
)
where ελ is the wavelength-dependent extinction coefficient, Lλ is the path length from source to detector, and DPFλ is the differential path-length. Typically, dual wavelength measurements of optical absorption are often converted to changes in HbO2 and HB by solving the series of linear equations [2] λ λ λ ∆ [ HbO 2 ]c −1 T ∆OD 1 L 1 DPF 1 T c , (4) = (E E) E λ2 λ2 λ2 ∆OD c L DPF ∆ [ Hb ]c where λ1 ε HbO E= λ 2 2 ε HbO2
λ ε Hb 1
.
(5)
λ ε Hb 2
conditional entropy using Parzen Window [16], [17]. The features are then sorted in descending mutual information and the first k features are then selected. Next, the Naïve Bayesian Parzen Window (NBPW) classifier [15] is used to classify the selected features. The NBPW classifier estimates conditional probability p(x|ω) using Parzen Window and prior probability P(ω) from training data samples, then predicts the class ω with the highest posterior probability p(ω|x) given a test sample x using Bayes rule and the naïve assumption that all the features are conditionally independent.
2.4. Feature extraction
3. Experimental Results
Feature extraction is performed by taking the average ∆[HB]c and ∆[HBO2]c across 12s of NIRS data recorded for a single trial. Since there are 16 channels, this resulted in a total of 32 features for a single trial. The above feature extraction is compared with the method in [11] that employed features using averaged ∆HB and ∆HBO2 from the left and right side of the prefrontal cortex. This method is implemented by averaging ∆HB and ∆HBO2 from channels c = 1, 2, 3 and 4 for the left and channels c = 13, 14, 15 and 16 for the right in this work. This resulted in four time series features ∆[HB]left, ∆[HBO2]left, ∆[HB]right ∆[HBO2]right for each trial. Taking the average across 12s of NIRS data resulted in a total of 4 features for a single trial. The feature vector for a trial ith trial is formed using
The performance of the proposed NIRS-based BCI using the feature extraction techniques described in section 2.4 are evaluated using 5×5-fold crossvalidations on the single-trial NIRS data collected. Feature selection and training of the classifier are performed on the training data, and classification performance is then evaluated on the test data in each fold. The performance is evaluated on two of three difficulty levels and the results are presented in TABLE I. The averaged performance of each feature extraction technique is presented in the last row.
The mutual information of each feature I(fj, C) can
TABLE I Results for Easy versus Hard (EvH), Easy versus Medium (EvM), Medium versus Hard (MvH); using Averaged Left and Right HB, HBO2 channels (AvgLRch), using MIBIF to select 2 of AvgLRch (Best2AvgLRch), using MIBIF to select 4 out of 32 channels of HB, HBO2 (Best4ch); and using MIBIF to select 5 channels (Best5ch) AvgLRch Best2AvgLRch Best4ch Best5ch Sub EvH EvM MvH EvH EvM MvH EvH EvM MvH EvH EvM MvH 1 74.0 70.0 72.8 67.6 56.8 70.0 70.0 69.6 73.6 72.0 68.8 75.6 2 76.0 86.0 68.0 77.2 86.0 65.2 76.8 84.8 79.6 76.4 86.8 80.0 3 52.8 63.2 70.4 51.6 64.4 66.0 67.6 66.4 70.4 70.8 69.2 72.8 4 73.2 74.4 63.2 70.4 69.2 52.0 68.0 76.8 67.6 68.8 74.8 70.8 5 72.8 73.2 70.4 67.2 74.8 59.2 68.8 76.4 72.0 67.2 74.8 73.2 6 65.2 74.0 67.6 64.4 75.6 59.6 69.2 73.6 70.8 69.2 73.2 71.2 7 56.8 57.6 50.4 48.4 53.2 48.0 53.6 64.0 55.6 54.0 63.2 60.0 8 62.4 70.4 66.8 60.8 61.6 67.6 67.6 64.4 63.2 64.8 71.2 64.4 9 72.4 70.4 65.2 70.0 66.4 61.6 81.6 78.4 78.4 79.6 79.2 76.4 10 72.4 59.6 63.2 73.2 60.4 55.6 70.4 72.0 73.2 71.6 72.8 72.4 11 60.0 56.0 69.6 53.6 54.0 64.8 61.6 68.0 78.8 62.8 71.2 78.4 12 66.4 64.8 71.6 70.0 63.2 69.6 66.0 62.0 70.4 67.2 64.4 70.8 13 50.4 54.4 56.4 54.4 50.0 46.0 66.0 60.8 61.2 66.8 64.8 62.8 14 60.4 53.6 53.6 53.6 50.4 52.0 62.8 68.0 67.2 61.2 70.4 66.8 15 52.0 63.2 61.6 50.4 66.8 65.2 71.6 65.2 67.6 70.8 62.8 68.4 16 65.2 57.2 72.0 68.8 53.2 72.4 69.6 72.4 72.0 71.2 72.4 74.8 17 65.6 62.4 60.0 64.8 62.0 58.0 65.6 77.6 56.4 66.8 74.4 55.2 18 65.6 74.8 62.0 56.8 79.6 63.6 74.8 82.4 70.4 81.2 82.4 68.4 19 49.2 60.0 53.6 44.0 60.4 45.6 64.8 68.4 68.4 60.0 70.0 70.0 20 70.8 71.2 62.8 73.2 75.2 60.8 91.6 92.4 84.0 92.8 91.6 84.4 Avg 64.2 65.8 64.1 62.0 64.2 60.1 69.4 72.2 70.0 69.8 72.9 70.8 64.7 62.1 70.5 71.2
be computed by estimating the entropy and the
Statistical analysis using 1-way ANOVA on the
x i = ∆ [ HbO 2 ] ∆ [ Hb ] , where xi∈ℝ
1×nt
(6)
, i=1,2,…,nt; nt denotes the total number
of trials in the training data. The feature matrix from training data is then
X = [ x1
x 2 ⋯ x nt ] . T
(7)
2.5. Feature selection and classification Feature selection is then performed to select discriminative features using the Mutual Informationbased Best Individual Feature (MIBIF) algorithm [15] on the training data. The MIBIF algorithm first computes the mutual information of each feature with the class labels. The mutual information between the features F ={f1, f2,…, fnf} whereby fj comprises the jth column of X, and the class C can be represented as [16]
I ( F ; C ) = H ( C ) − H (C | F
)
(8)
3766 3770 3754
results of the proposed NIRS-based BCI using different feature extraction techniques in TABLE I revealed significant differences (p=1.87×10⁻¹⁰). Selecting 2 features extracted by averaging ∆HB and ∆HBO2 from left and right channels using the MIBIF algorithm yielded significantly poorer results from t-test compared to all features (µ=64.7% from AvgLRch versus 62.1% from Best2AvgLRch, p=1.84×10⁻⁵). In contrast, selecting 4 features extracted by averaging ∆HB and ∆HBO2 across each individual channels yielded significantly better results than averaging ∆HB and ∆HBO2 from left and right channels (mean 70.5% from Best4ch, p=2.66×10⁻⁹). Increasing the features selected to 5 significantly improved the results further (µ=71.2% from Best5ch, p=0.03), but further increase to 6 did not yield significantly improved results (µ=71.55%, p=0.16, Best6ch omitted from TABLE I).
4. Conclusions This paper presents a novel BCI for detecting the problem size effect in a mental arithmetic task from single-trial NIRS brain signals. A study is performed on 20 healthy subjects to measure changes in the concentration of oxyhemoglobin (∆HBO2) and deoxyhemoglobin (∆HB) responses in performing three difficulty levels of mental arithmetic. The performance of the proposed NIRS-based BCI is evaluated using 5×5-fold cross-validations on the single-trial NIRS data collected using various features extraction methods. The results showed that performing feature selections on ∆HB and ∆HBO2 from all the channels yielded an averaged accuracy of 71.2%, which is significantly better than using features by averaging ∆HB and ∆HBO2 from the left and right side of the prefrontal cortex. The results demonstrated the potential of the proposed NIRS-based BCI for recognizing the problem size effect in mental arithmetic task. More advanced feature selection and classification methods could be employed to further improve the classification performance.
References [1] J. R. Wolpaw, N. Birbaumer, D. J. McFarland, G. Pfurtscheller, and T. M. Vaughan, "Brain-computer interfaces for communication and control," Clin. Neurophysiol., vol. 113, no. 6, pp. 767-791, Jun. 2002. [2] R. Sitaram, H. Zhang, C. Guan, M. Thulasidas, Y. Hoshi, A. Ishikawa, K. Shimizu, and N. Birbaumer, "Temporal classification of multichannel near-infrared spectroscopy signals of motor imagery for developing a brain-computer interface," NeuroImage, vol. 34, no. 4,
pp. 1416-1427, Feb. 2007. [3] S. M. Coyle, T. E. Ward, and C. Markham, M., "Braincomputer interface using a simplified functional nearinfrared spectroscopy system," J. Neural Eng., vol. 4, no. 3, p. 219, Sep. 2007. [4] J. J. Daly and J. R. Wolpaw, "Brain-computer interfaces in neurological rehabilitation," The Lancet Neurology, vol. 7, no. 11, pp. 1032-1043, 2008. [5] A. Villringer and B. Chance, "Non-invasive optical spectroscopy and imaging of human brain function," Trends Neurosci., vol. 20, no. 10, pp. 435-442, 1997. [6] S. Coyle, T. Ward, C. Markham, and G. McDarby, "On the suitability of near-infrared (NIR) systems for nextgeneration brain-computer interfaces," Physiol. Meas., vol. 25, no. 4, p. 815, Aug. 2004. [7] M. Tanida, K. Sakatani, R. Takano, and K. Tagai, "Relation between asymmetry of prefrontal cortex activities and the autonomic nervous system during a mental arithmetic task: near infrared spectroscopy study," Neurosci. Lett., vol. 369, no. 1, pp. 69-74, 2004. [8] E. Unlu, H. Bolay, and A. Akin, "Hemodynamic correlates of mental arithmetic task in migraine," in Proc. BIYOMUT, 2009, pp. 1-4. [9] K. Ciftci, B. Sankur, Y. Kahya, and A. Akin, "Complexity and functional clusters of the brain during mental arithmetic," in Proc. SIU, 2008, pp. 1-4. [10] L. Hirshfield, K. Chauncey, R. Gulotta, A. Girouard, E. Solovey, R. Jacob, A. Sassaroli, and S. Fantini, "Combining Electroencephalograph and Functional Near Infrared Spectroscopy to Explore Users’ Mental Workload," in Foundations of Augmented Cognition. Neuroergonomics and Operational Neuroscience, 2009, pp. 239-247. [11] L. M. Hirshfield, E. T. Solovey, A. Girouard, J. Kebinger, R. J. K. Jacob, A. Sassaroli, and S. Fantini, "Brain measurement for usability testing and adaptive interfaces: an example of uncovering syntactic workload with functional near infrared spectroscopy," in Proc. ACM CHI, 2009, pp. 2185-2194. [12] M. I. Núñez-Peña, M. L. Honrubia-Serrano, and C. Escera, "Problem size effect in additions and subtractions: an event-related potential study," Neurosci. Lett., vol. 373, no. 1, pp. 21-25, 2004. [13] K. E. Jang, S. Tak, J. Jung, J. Jang, Y. Jeong, and J. C. Ye, "Wavelet minimum description length detrending for near-infrared spectroscopy," Journal of Biomedical Optics, vol. 14, no. 3, pp. 1-13, May 2009. [14] T. J. Huppert, S. G. Diamond, M. A. Franceschini, and D. A. Boas, "HomER: a review of time-series analysis methods for near-infrared spectroscopy of the brain," Appl. Opt., vol. 48, no. 10, pp. D280-D298, 2009. [15] K. K. Ang and C. Quek, "Rough Set-based Neuro-Fuzzy System," in Proc. IJCNN'06, 2006, pp. 742-749. [16] N. Kwak and C.-H. Choi, "Input feature selection by mutual information based on Parzen window," IEEE Trans. Pattern Anal. Mach. Intell., vol. 24, no. 12, pp. 1667-1671, Dec. 2002. [17] E. Parzen, "On Estimation of a Probability Density Function and Mode," Annals Math. Statist., vol. 33, no. 3, pp. 1065-1076, Sep. 1962. 3767 3771 3755