TELKOMNIKA, Vol. 11, No. 6, June 2013, pp. 2983 ~ 2990 e-ISSN: 2087-278X
2983
A Bubble Detection Algorithm based on Sparse and Redundant Image Processing Ye Tian*, Change Zheng, Qiuhong Ke Beijing Forestry University, No. 35 Qinghua East Road, Haidian District, Beijing, 100083, China Corresponding author, e-mail:
[email protected]*,
[email protected],
[email protected]
Abstract Deinked pulp flotation column has been applied in wastepaper recycling. Bubble size in deinked pulp flotation column is very important during the flotation process. In this paper, bubble images of deinked pulp flotation column were first caught by digital camera, and then the bubbles were detected by using a detection algorithm based on sparse and redundant image processing. The results show the algorithms are very practical and effective on bubble detection in deinked pulp flotation column. Keywords: bubble detection, sparse and redundant, image processing Copyright © 2013 Universitas Ahmad Dahlan. All rights reserved.
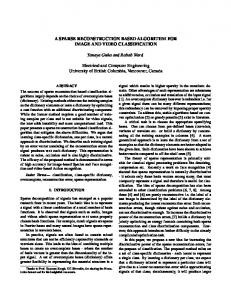
1. Introduction Flotation column is mainly used in ore dressing, which adopts convection sorting principle in order to separate and recycles minerals. The speed of pulp and bubble is low, but their relative speed is very high to achieve the purpose of the mineral separation. Flotation column does not need enormous driving units, and both global structure and control system are simple, Flotation column has the virtue of smaller occupation area, meanwhile the removal efficiency of stickiest and ash is apparent. So it can be used in recycling secondary fiber from waste paper which has become a hot spot in recent years [1-2]. Currently, flotation column had been industrialized in Canada, Sweden and so on. So the deinked pulp flotation column was introduced to our university from Canada through State Forestry Bureau 948 project. Since the bubble size in deinked pulp flotation column determines the air surface area per unit, which directly influences the ability of bubble capturing pulp ink particles and other impurities mix in pulp during the flotation process. In addition, bubble size also affects bubble's working rising speed. So in recent years, the bubble size measurement of floatation column gradually has become the research focus [1-2]. In our equipment, flotation column is composed of Cylinder made up of transparent PVC material, so it is in favor of observing circumstances of cylinder and the size of the bubble when flotation column is working. Use of a digital camera can capture dynamic bubble images directly. Because paper pulp and cylinder are translucent, we choose a back light for illumination, that’s also called transmitted light. Light source is LED bright-field illumination. As shown in Figure 1, Figure 1(a) is the original image of bubbles, while Figure 1(b) is the result after histogram equalization.
(a) original image(1112x763)
(b) after histogram equalization
Figures 1. Bubble Image Received December 18, 2012; Revised March 10, 2013; Accepted April 10, 2013
2984
e-ISSN: 2087-278X
Since the bubbles are transparent in flotation column, from Figure 1, we can see the bubbles edges more clear than their bodies which have almost the same color as the paper pulp. Therefore, the bubble edge detection plays an important role in our applications. Figure 2 shows gray histogram of the original image, and Table 1 gives its related data.
Table 1. The Statistics Data of the Original Bubble Image
0.12 0.1 0.08
Mean
Median
Maximum
Minimum
89.02
90
112
49
Standard dev 6.535
0.06 0.04 0.02 0 50
60
70
80
90
100
110
Figure 2. Bubble's Gray Histogram
Because the original image 's contrast is poor and affected by the very large noise.(see Figure 1(b) and Table 1 Standard dev), classic edge extraction operators (such as Sobel, Roberts, Etc.) which are extremely sensitive to noise and impossible to apply. Canny operator is an edge detecting operator based on an optimal algorithm, but it is proved to be poor performance for the bubble edges’ detection. Edges are the abrupt change points in the image. These abrupt change points give the object contour. On the other hand, Edges and some important details are high-frequency in image. They will be affected by lots of noise in the high-frequency. The algorithms must ensure to be able to not only reduce the noise but also detect bubble edges in order to obtain the continuous and distinct edges. This paper will realize the bubble dection by sparse and redundant image processing.
2. Research Method In the last decade, In field of multiresolution analysis, sparsity has been used in a wide range of image processing applications (feature extraction, denoise, restoration, and compression). Differing from the traditional resentations, sparsity offers a wider range of generating elements (called atoms). A signal is strictly or exactly sparse if most of its entries are equal to zero. if a signal is not sparse, we can sparsify it through an appropriate transform. for example, a sine signal is not sparse in time domain, but its Fourier transform is strictly sparse. By means carefully selected atoms (such as sinusoids, wavelets,and Gausssians), we can transform a signal to a desired form. Different transforms often are used by different purposes [3]: - The Fourier transform for stationary signals - The windowed Fourier transform for locally stationary signals - The wavelet transform for representing isotropic features, such as point , noise - The ridgelet transform for perfectly straight edges - The curvelet transform for curvilinear structures Every transform include analysis and synthesis operations. Analysis is the operation that associates with each signal x a vector of coefficients attached to an atom: x . Synthesis is the operation of reconstructing x by superposing atoms: x . Analysis and synthesis are different linear operations [3]. T
2.1. Two-Dimensional Decimated Wavelet Transform and Bubble Detection In One-Dimensional DWT, a scaling function (t) and a wavelet function (t) are used for obtaining approximate information and details informations. So One-Dimensional DWT algorithm can be exended to two-dimension by separable products of a scaling function and a TELKOMNIKA Vol. 11, No. 6, June 2013 : 2983 – 2990
TELKOMNIKA
2985
e-ISSN: 2087-278X
wavelet function. it will generate an approximate subimage(low-frequency subband) and the three detail subimages(high-frequency subband). They are horizontal, vertical, and diagonal directions' details, as shown in Figure 3 [2].
Figure 3. Image Decomposition based on Wavelet Transform
After two-dimensional decimated wavelet transform, A is approximation image of the original image which contains the most information of the original image. H, V, D preserve the details of the original image. H preserves the horizontal edge details. V preserves the vertical edge details. V preserves the diagonal details which are influenced by noise greatly. Using multiresolution analysis, The approximation A can be decomposed as needed. Finally, the original image will be transformed to an approximate image and a series of wavelet(detail) images at different resolution levels, as shown in Figure 4 [3-4].
Horizontal Approximation A2 Vertical
Details 2 level j=2
1
Diagonal
Details level j=2
2 2
Horizontal Details level j=1
11
Details 2 level j=2
Vertical Details level j=1
3
12
Diagonal Details level j=1
13
Figure 4. DWT Representation of an Image
2.1.1. Approximation Image Edge Detecting based on Canny Operator A is approximation (smoothed) image of the original image, In A, edge detecting by applying canny operator, Canny operator has the most stringent criterions of edge detecting. A good effect will be obtained adopted canny operator when processing the image containated by additive white Gaussian noise. Applying canny operator on the approximation image, clear edges can be obtained, but some real edges are missed, and there exist some append edges in the image. Thus the edge details of the wavelet subimages should be used. 2.1.2. Denoising of the Wavelet Subimages based on Wavelet Transform. Because wavelet subimage corresponds to high-frequency component of original image, the wavelet coefficients of the wavelet subimage which have smaller amplitude present
A Bubble Detection Algorithm based on Sparse and Redundant Image Processing (Ye Tian)
2986
e-ISSN: 2087-278X
the most noise part, and the wavelet coefficients which have larger amplitude present the details of the image. Using hard or soft thresholding, reduce the noise in the wavelet subimage. Many thresholding or shrinkage rules have been proposed in the last decade. Among them, hard and soft thresholding are certainly the most well known [3-4]. Hard thesholding consists of setting to zero all coefficients whose magnitude is less than a threshold t. it means the keep-or-kill rule.
( i , j ), ( i , j ) t ( i , j ) HardThresh ( ( i , j ))
(1)
0 , otherwise
Soft thresholding is defined as the kill-or-shrink rule:
sign ( ( i , j )) ( ( i , j ) t , ( i , j ) t
( i , j ) SoftThresh ( ( i , j ))
(2)
0 , otherwise
(i, j )
is the wavelet coefficient.
2.1.3. Wavelet Reconstruction Using wavelet reconstruction, the resulting image will be obtained. 2.2. Redundant Wavelet Transform and Bubble Detection Because the discrete wavelet transform (DWT) leaded to the loss of the translationinvariance property, a large number of artifacts are generated when an image is reconstructed after modification of its wavelet coefficients. By redundant wavelet transform, that problem can be avoided. Compared to DWT, redundant wavelet transform keeped the filter bank construction and eliminated the decimation step in the DWT. So redundant wavelet transform means the undecimated wavelet transform (UWT). The isotropic undecimated wavelet transform (IUWT) algorithm is well known in the astronomical domain because it is well adapted to astronomical data, where objects are more or less isotropic in most cases [5-7]. The bubbles are alse the same. IUWT has motivated the following choice for the analysis scaling and wavelet functions [3]:
1 3 3 (t 2 4t 1 6t 12 ( t 1 , t 2 ) 1 D ( t 1 ) 1 D ( t 2 )
1 D ( t )
3
4 t 1 t 2 ), 3
3
(3)
t t 1 1 t t ( 1 , 2 ) (t1 , t 2 ) ( 1 , 2 ) 4 2 2 4 2 2 Where 1 D (t ) is the 1-D B-spline of order 3 (i.e., B3-spline) and the wavelet function is defined as the difference between two resolutions. The related pair of filters(h,g) is defined by:
h1 D [ k ] [1, 4 , 6 , 4 ,1] / 16 , k 2 , , 2 h[ k , l ] h1 D [ k ]h1 D [ l ]
(4)
g [ k , l ] [ k , l ] h[ k , l ] Where is defined as [0,0]=1 and [k,l]=0 for all (k, l) (0, 0). It is easy that the reconstruction is obtained by the simple coaddition of all wavelet scales and the final smooth subband, J
a 0 [k , j] a J [k , j ] j [k , j] j 1
TELKOMNIKA Vol. 11, No. 6, June 2013 : 2983 – 2990
(5)
TELKOMNIKA
2987
e-ISSN: 2087-278X
3. Results and Analysis 3.1. Wavelet Transform and Bubble Detection First, we applied DWT to experiment using db10 wavelet. Table 2-Table 4 give the different decomposition levels information.
Table 2. A1: Approximation Mean 177.5
Median 178.7
Maximum 217.3
Minimum 108.6
Standard dev 12.71
Table 3. A2: Approximation Mean 352.9
Median 355.2
Maximum 428.6
Minimum 225.4
Standard dev 25.04
Table 4. A3: Approximation Mean 89.02
Median 89.54
Maximum 106.5
Minimum 56.24
Standard dev 6.251
Because the standard dev of A2 is the biggest, which means A2 contains the most information of the original image. So we select 2 - level wavelet decomposition as shown in Figure 5.
Figure 5. DWT Decomposition
In Figure 5, the noises appeared in details of level 1 and level 2. They can be removed by hard or soft thresholding. Figure 6 shows the result of bubble detection for the image. In Figure 6(b), on approximation of A2 level, Edge detecting bases on canny operator, two thresholds are 0.2 and 0.4, is 1.5. To denoising, the wavelet coefficients of 1-level set zeros. After edge detecting and denoising, wave reconstruction is used. See Figure 6(c). In Figure 6(d), After thresholding, the binary image is obtained. Using morphology's open, close and fill hole operator [8], see Figure 6(e). The results of bubble detection are very good.
A Bubble Detection Algorithm based on Sparse and Redundant Image Processing (Ye Tian)
2988
e--ISSN: 2087-278X
(a) The orig ginal image (1112x763) (
esult by Cann ny operator in A2 (b) Detecting re (214x301)
(c) Wa ave reconstruction
(d d) Thresholding
(e)Morrphology proc cessing Figure 6. Bubble B detec cting result 3.2. IUWT and Bubble Detec ction Figure 7 shows s the IU UWT of the im mages of "bu ubble" at five e resolution le evels.
(a)
(b)
(c)
(d)
(e)
(f)
Figurre 7. The IUW WT of the "bu ubble" image e. The additio on of these ssix images will w reproducces the origin nal image. KOMNIKA Vol. V 11, No. 6, 6 June 2013 3 : 2983 – 29 990 TELK
TELKOMNIKA
2989
e-ISSN: 2087-278X
The IUWT of the "bubble" image consist of five detail images and the smooth images. each of the six images is the same size of orginal image. The redundancy factor is equal to 6. In order to acquire faint feature of "bubble" image and denoising, the details of level 1 and level 2 are set zeros, log apply to the others, that means: a 0 [ k , j ] log( a J [ k , j ])
5
sign ( j3
j
[ k , j ]) log( j [ k , j ] 0 . 001 )
(6)
The reconstruction image showed in Figure 8.
Figure 8. The Reconstruction of "bubble" Image
(a) The Reconstruction Image Using Equation (6)
(c) The complement of (b)
(e) The answer of (d)-(c)
(b) Thresholding
(d) Fill hold operator
(f) Open and close operator
Figure 9. Bubble Detecting Result by IUWT A Bubble Detection Algorithm based on Sparse and Redundant Image Processing (Ye Tian)
2990
e--ISSN: 2087-278X
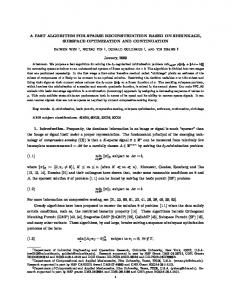
Figure 9 shows the result of bubble b detec ction. Using morphologyy processing g, see Figurre. 9 (c)-(f). The bubbless are detectted. Figure 10 show the e different be etween DWT T and IUWT T.
(a) The Original Image
(b) The Ima age after DW WT Applyed
(c) The Image after IUW WT Applyed
F Figure 10. Different Betw ween DWT an nd IUWT. In Figure 10 (b), it stre esses the da ark edge of bubble, b and Figure 10 (c)) , it stresses s the bright edge of bub bble, not only the edge of bubble in Figure 10 (cc) is more sm moother than in Figurre 10 (b), butt alse it also consistents c w the origiinal shape. with
4. Co onclusion This pap per proposed d a bubble detection d alg gorithm based on sparsse and redu undant image e processing g, the algorithm not only reduce the noise n simplyy and also ke eep the fine image i edges. Finally, the e bubbles arre detected.
Ackn nowledgeme ents This workk was suppo orted by the National Na atural Sciencce Foundatio on of China under Grant 31200544, and the Ressearch Fund dation for the e Doctoral Prrogram of Hiigher Educattion of China a under Gran nt 20110014120012.
References [1] S Sun Liying, Li Qiongyan, Qian Q Hua, Tia an Ye. Applic cation of Image Enhancem ment Technology in B Bubble Dimension Measure ement of dein nked pulp flottation column. Advanced M Materials Res search. 2 2012; (510): 48 84-489. [2] Ye Y Tian, Hua Qian, Q Qiuhong g Ke. A bubble e detection alg gorithm based d on wavelet ttransform and canny o operator for De einked Pulp Flotation Colum mn. Applied Mechanics M and d Materials. 20 013; 278(280): 11621166. [3] Jean-Luc Starcck, Fionn Mu urtagh, Jalal M Fadili. Sparrse Image an nd Signal Processing. New w York: C Cambridge University Press. 2010. [4] Stephane S Malla at. A Wavelet Tour of Signa al Processing. 2nd edition. Academic A Presss. 1999. [5] Mmalat M S, HW W Ang WL. Sin ngularity Detecction and Processing with Wavele. W IEEE E. 2002; 38(2): 6176 643. [6] Starck S JL, Murrtagh. Image restoration r with noise supprression using the t wavelet tra ansform. Astrronomy a Astrophysiics. 1994; 288 and 8: 343-348. [7] Starck S JL, Murtagh. Astronom mical Image and a Data Anallysis. 2nd editiion. New Yorkk: Springer. 20 006 [8] Rafael R C Gonzzalez. Digital Im mage Processsing. 2nd editio on. Pearson Education. E 200 05
KOMNIKA Vol. V 11, No. 6, 6 June 2013 3 : 2983 – 29 990 TELK